
Program Guide (111)
Children categories
Convert JSON to/from Excel in Python – Full Guide with Examples
2025-07-16 05:39:52 Written by zaki zou
In many Python projects, especially those that involve APIs, data analysis, or business reporting, developers often need to convert Excel to JSON or JSON to Excel using Python code. These formats serve different but complementary roles: JSON is ideal for structured data exchange and storage, while Excel is widely used for sharing, editing, and presenting data in business environments.
This tutorial provides a complete, developer-focused guide to converting between JSON and Excel in Python. You'll learn how to handle nested data, apply Excel formatting, and resolve common conversion or encoding issues. We’ll use Python’s built-in json module to handle JSON data, and Spire.XLS for Python to read and write Excel files in .xlsx, .xls, and .csv formats — all without requiring Microsoft Excel or other third-party software.
Topics covered include:
- Install Spire.XLS for Python
- Why Choose Spire.XLS over General-Purpose Libraries?
- Convert JSON to Excel in Python
- Convert Excel to JSON in Python
- Real-World Example: Handling Nested JSON and Complex Excel Formats
- Common Errors and Fixes
- FAQ
- Conclusion
Install Spire.XLS for Python
This library is used in this tutorial to generate and parse Excel files (.xlsx, .xls, .csv) as part of the JSON–Excel conversion workflow.
To get started, install the Spire.XLS for Python package from PyPI:
pip install spire.xls
You can also choose Free Spire.XLS for Python in smaller projects:
pip install spire.xls.free
Spire.XLS for Python runs on Windows, Linux, and macOS. It does not require Microsoft Excel or any COM components to be installed.
Why Choose Spire.XLS over Open-Source Libraries?
Many open-source Python libraries are great for general Excel tasks like simple data export or basic formatting. If your use case only needs straightforward table output, these tools often get the job done quickly.
However, when your project requires rich Excel formatting, multi-sheet reports, or an independent solution without Microsoft Office, Spire.XLS for Python stands out by offering a complete Excel feature set.
| Capability | Open-Source Libraries | Spire.XLS for Python |
|---|---|---|
| Advanced Excel formatting | Basic styling | Full styling API for reports |
| No Office/COM dependency | Fully standalone | Fully standalone |
| Supports .xls, .xlsx, .csv | .xlsx and .csv mostly; .xls may need extra packages | Full support for .xls, .xlsx, .csv |
| Charts, images, shapes | Limited or none | Built-in full support |
For developer teams that need polished Excel files — with complex layouts, visuals, or business-ready styling — Spire.XLS is an efficient, all-in-one alternative.
Convert JSON to Excel in Python
In this section, we’ll walk through how to convert structured JSON data into an Excel file using Python. This is especially useful when exporting API responses or internal data into .xlsx reports for business users or analysts.
Step 1: Prepare JSON Data
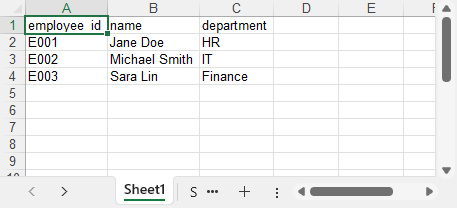
We’ll start with a JSON list of employee records:
[
  {"employee_id": "E001", "name": "Jane Doe", "department": "HR"},
  {"employee_id": "E002", "name": "Michael Smith", "department": "IT"},
  {"employee_id": "E003", "name": "Sara Lin", "department": "Finance"}
]
This is a typical structure returned by APIs or stored in log files. For more complex nested structures, see the real-world example section.
Step 2: Convert JSON to Excel in Python with Spire.XLS
from spire.xls import Workbook, FileFormat
import json

# Load JSON data from file
with open("employees.json", "r", encoding="utf-8") as f:
    data = json.load(f)

# Create a new Excel workbook and access the first worksheet
workbook = Workbook()
sheet = workbook.Worksheets[0]

# Write headers to the first row
headers = list(data[0].keys())
for col, header in enumerate(headers):
    sheet.Range[1, col + 1].Text = header

# Write data rows starting from the second row
for row_idx, row in enumerate(data, start=2):
    for col_idx, key in enumerate(headers):
        sheet.Range[row_idx, col_idx + 1].Text = str(row.get(key, ""))

# Auto-fit the width of all used columns
for i in range(1, sheet.Range.ColumnCount + 1):
    sheet.AutoFitColumn(i)

# Save the Excel file and release resources
workbook.SaveToFile("output/employees.xlsx", FileFormat.Version2016)
workbook.Dispose()
Code Explanation:
- Workbook() initializes the Excel file with three default worksheets.
- workbook.Worksheets[] accesses the specified worksheet.
- sheet.Range(row, col).Text writes string data to a specific cell (1-indexed).
- The first row contains column headers based on JSON keys, and each JSON object is written to a new row beneath it.
- workbook.SaveToFile() saves the Excel workbook to disk. You can specify the format using the FileFormat enum — for example, Version97to2003 saves as .xls, Version2007 and newer save as .xlsx, and CSV saves as .csv.
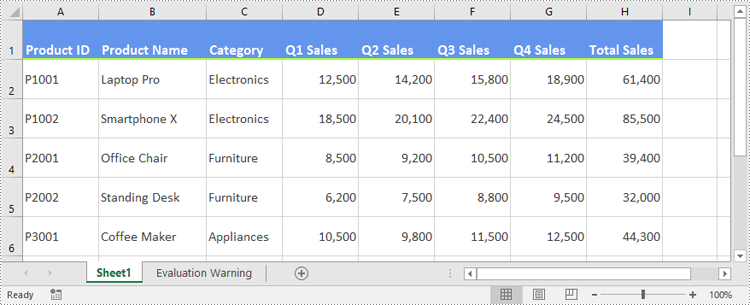
The generated Excel file (employees.xlsx) with columns employee_id, name, and department.
You can also convert the Excel worksheet to a CSV file using Spire.XLS for Python if you need a plain text output format.
Convert Excel to JSON in Python
This part explains how to convert Excel data back into structured JSON using Python. This is a common need when importing .xlsx files into web apps, APIs, or data pipelines that expect JSON input.
Step 1: Load the Excel File
First, we use Workbook.LoadFromFile() to load the Excel file, and then select the worksheet using workbook.Worksheets[0]. This gives us access to the data we want to convert into JSON format.
from spire.xls import Workbook

# Load the Excel file
workbook = Workbook()
workbook.LoadFromFile("products.xlsx")
sheet = workbook.Worksheets[0]
Step 2: Extract Excel Data and Write to JSON
import json
# Get the index of the last row and column
rows = sheet.LastRow
cols = sheet.LastColumn
# Extract headers from the first row
headers = [sheet.Range[1, i + 1].Text for i in range(cols)]
data = []
# Map each row to a dictionary using headers
for r in range(2, rows + 1):
row_data = {}
for c in range(cols):
value = sheet.Range[r, c + 1].Text
row_data[headers[c]] = value
data.append(row_data)
# Write JSON output
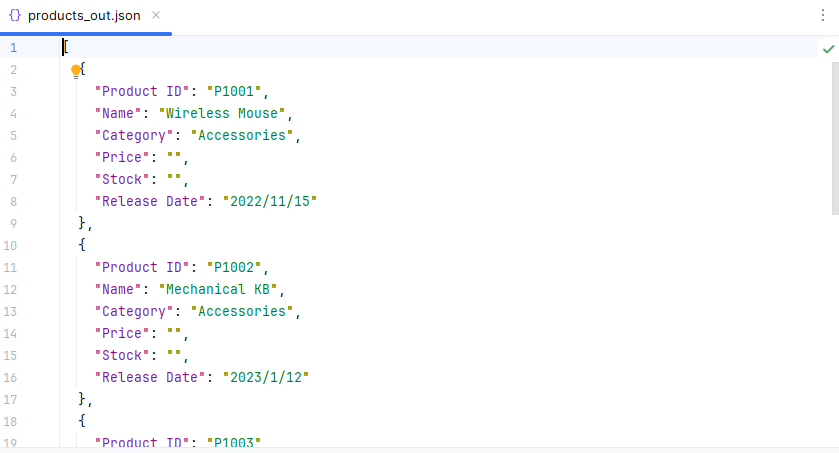
with open("products_out.json", "w", encoding="utf-8") as f:
json.dump(data, f, indent=2, ensure_ascii=False)
Code Explanation:
- sheet.LastRow and sheet.LastColumn detect actual used cell range.
- The first row is used to extract field names (headers).
- Each row is mapped to a dictionary, forming a list of JSON objects.
- sheet.Range[row, col].Text returns the cell’s displayed text, including any formatting (like date formats or currency symbols). If you need the raw numeric value or a real date object, you can use .Value, .NumberValue, or .DateTimeValue instead.
The JSON file generated from the Excel data using Python:
If you’re not yet familiar with how to read Excel files in Python, see our full guide: How to Read Excel Files in Python Using Spire.XLS.
Real-World Example: Handling Nested JSON and Formatting Excel
In real-world Python applications, JSON data often contains nested dictionaries or lists, such as contact details, configuration groups, or progress logs. At the same time, the Excel output is expected to follow a clean, readable layout suitable for business or reporting purposes.
In this section, we'll demonstrate how to flatten nested JSON data and format the resulting Excel sheet using Python and Spire.XLS. This includes merging cells, applying styles, and auto-fitting columns — all features that help present complex data in a clear tabular form.
Let’s walk through the process using a sample file: projects_nested.json.
Step 1: Flatten Nested JSON
Sample JSON file (projects_nested.json):
[
  {
    "project_id": "PRJ001",
    "title": "AI Research",
    "manager": {
      "name": "Dr. Emily Wang",
      "email": "emily@lab.org"
    },
    "phases": [
      {"phase": "Design", "status": "Completed"},
      {"phase": "Development", "status": "In Progress"}
    ]
  },
  {
    "project_id": "PRJ002",
    "title": "Cloud Migration",
    "manager": {
      "name": "Mr. John Lee",
      "email": "john@infra.net"
    },
    "phases": [
      {"phase": "Assessment", "status": "Completed"}
    ]
  }
]
We'll flatten all nested structures, including objects like manager, and summarize lists like phases into string fields. Each JSON record becomes a single flat row, with even complex nested data compactly represented in columns using readable summaries.
import json

# Helper: Flatten nested data and summarize list of dicts into strings
# e.g., [{"a":1},{"a":2}] → "a: 1; a: 2"
def flatten(data, parent_key='', sep='.'):
    items = {}
    for k, v in data.items():
        new_key = f"{parent_key}{sep}{k}" if parent_key else k
        if isinstance(v, dict):
            items.update(flatten(v, new_key, sep=sep))
        elif isinstance(v, list):
            if all(isinstance(i, dict) for i in v):
                items[new_key] = "; ".join(
                    ", ".join(f"{ik}: {iv}" for ik, iv in i.items()) for i in v
                )
            else:
                items[new_key] = ", ".join(map(str, v))
        else:
            items[new_key] = v
    return items

# Load and flatten JSON
with open("projects_nested.json", "r", encoding="utf-8") as f:
    raw_data = json.load(f)

flat_data = [flatten(record) for record in raw_data]

# Collect all unique keys from flattened data as headers
all_keys = set()
for item in flat_data:
    all_keys.update(item.keys())
headers = list(sorted(all_keys))  # Consistent, sorted column order
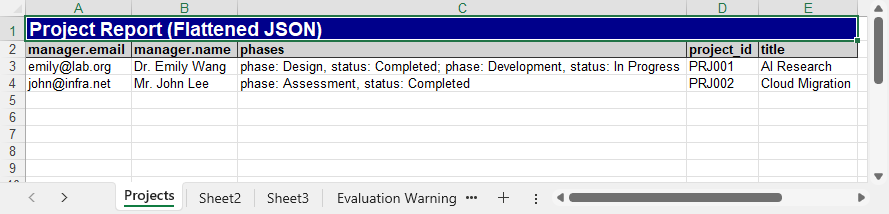
This version of flatten() converts lists of dictionaries into concise summary strings (e.g., "phase: Design, status: Completed; phase: Development, status: In Progress"), making complex structures more compact for Excel output.
Step 2: Format and Export Excel with Spire.XLS
Now we’ll export the flattened project data to Excel, and use formatting features in Spire.XLS for Python to improve the layout and readability. This includes setting fonts, colors, merging cells, and automatically adjusting column widths for a professional report look.
from spire.xls import Workbook, Color, FileFormat

# Create workbook and worksheet
workbook = Workbook()
sheet = workbook.Worksheets[0]
sheet.Name = "Projects"

# Title row: merge and style
col_count = len(headers)
sheet.Range[1, 1, 1, col_count].Merge()
sheet.Range[1, 1].Text = "Project Report (Flattened JSON)"
title_style = sheet.Range["A1"].Style
title_style.Font.IsBold = True
title_style.Font.Size = 14
title_style.Font.Color = Color.get_White()
title_style.Color = Color.get_DarkBlue()

# Header row from flattened keys
for col, header in enumerate(headers):
    cell = sheet.Range[2, col + 1]
    cell.BorderAround() # Add outside borders to a cell or cell range
    #cell.BorderInside() # Add inside borders to a cell range
    cell.Text = header
    style = cell.Style
    style.Font.IsBold = True
    style.Color = Color.get_LightGray()

# Data rows
for row_idx, row in enumerate(flat_data, start=3):
    for col_idx, key in enumerate(headers):
        sheet.Range[row_idx, col_idx + 1].Text = str(row.get(key, ""))

# Auto-fit columns and rows
for col in range(len(headers)):
    sheet.AutoFitColumn(col + 1)
for row in range(len(flat_data)):
    sheet.AutoFitRow(row + 1)

# Save Excel file
workbook.SaveToFile("output/projects_formatted.xlsx", FileFormat.Version2016)
workbook.Dispose()
This produces a clean, styled Excel sheet from a nested JSON file, making your output suitable for reports, stakeholders, or dashboards.
Code Explanation
- sheet.Range[].Merge(): merges a range of cells into one. Here we use it for the report title row (A1:F1).
- .Style.Font / .Style.Color: allow customizing font properties (bold, size, color) and background fill of a cell.
- .BorderAround() / .BorderInside(): add outside/inside borders to a cell range.
- AutoFitColumn(n): automatically adjusts the width of column
nto fit its content.
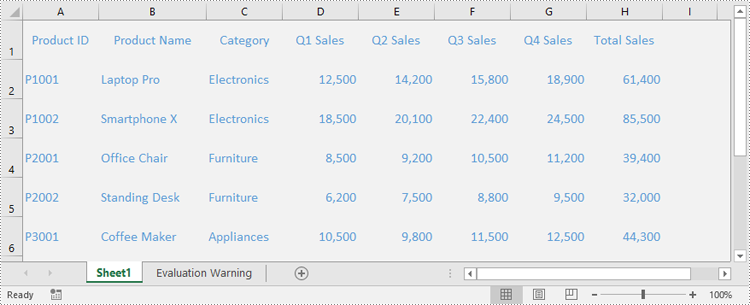
The Excel file generated after flattening the JSON data using Python:
Common Errors and Fixes in JSON ↔ Excel Conversion
Converting between JSON and Excel may sometimes raise formatting, encoding, or data structure issues. Here are some common problems and how to fix them:
| Error | Fix |
|---|---|
| JSONDecodeError or malformed input | Ensure valid syntax; avoid using eval(); use json.load() and flatten nested objects. |
| TypeError: Object of type ... is not JSON serializable | Use json.dump(data, f, default=str) to convert non-serializable values. |
| Excel file not loading or crashing | Ensure the file is not open in Excel; use the correct extension (.xlsx or .xls). |
| UnicodeEncodeError or corrupted characters | Set encoding="utf-8" and ensure_ascii=False in json.dump(). |
Conclusion
With Spire.XLS for Python, converting between JSON and Excel becomes a streamlined and reliable process. You can easily transform JSON data into well-formatted Excel files, complete with headers and styles, and just as smoothly convert Excel sheets back into structured JSON. The library helps you avoid common issues such as encoding errors, nested data complications, and Excel file format pitfalls.
Whether you're handling data exports, generating reports, or processing API responses, Spire.XLS provides a consistent and efficient way to work with .json and .xlsx formats in both directions.
Want to unlock all features without limitations? Request a free temporary license for full access to Spire.XLS for Python.
FAQ
Q1: How to convert JSON into Excel using Python?
You can use the json module in Python to load structured JSON data, and then use a library like Spire.XLS to export it to .xlsx. Spire.XLS allows writing headers, formatting Excel cells, and handling nested JSON via flattening. See the JSON to Excel section above for step-by-step examples.
Q2: How do I parse JSON data in Python?
Parsing JSON in Python is straightforward with the built-in json module. Use json.load() to parse JSON from a file, or json.loads() to parse a JSON string. After parsing, the result is usually a list of dictionaries, which can be iterated and exported to Excel or other formats.
Q3: Can I export Excel to JSON with Spire.XLS in Python?
Yes. Spire.XLS for Python lets you read Excel files and convert worksheet data into a list of dictionaries, which can be written to JSON using json.dump(). The process includes extracting headers, detecting used rows and columns, and optionally handling formatting. See Excel to JSON for detailed implementation.
How to Convert CSV to Excel (XLSX) in Python – Single & Batch Guide
2025-06-06 08:04:25 Written by zaki zouWhile working with CSV files is common in data processing, Excel (XLSX) often provides more advantages when it comes to data sharing, visualization, and large-scale analysis. In this guide, you’ll learn how to convert CSV to Excel in Python, including both single file and batch conversion methods. Whether you're automating reports or preparing data for further analysis, this guide will help you handle the conversion efficiently.

- Why Convert CSV to Excel
- Install Required Python Libraries
- Convert Single CSV to Excel
- Batch Convert CSV to XLSX
- FAQs
Why Convert CSV to Excel?
While CSV files are widely used for data storage and exchange due to their simplicity, they come with several limitations—especially when it comes to formatting, presentation, and usability. Converting CSV to Excel can bring several advantages:
Benefits of Converting CSV to Excel
- Better formatting support: Excel allows rich formatting options like fonts, colors, borders, and cell merging, making your data easier to read and present.
- Multiple worksheets: Unlike CSV files that support only a single sheet, Excel files can store multiple worksheets in one file, which is better for large datasets.
- Built-in formulas and charts: You can apply Excel formulas, pivot tables, and charts to analyze and visualize your data.
- Improved compatibility for business users: Excel is the preferred tool for many non-technical users, making it easier to share and collaborate on data.
Limitations of CSV Files
- No styling or formatting (plain text only)
- Single-sheet structure only
- Encoding issues (e.g., with non-English characters)
- Not ideal for large datasets or advanced reporting If your workflow involves reporting, data analysis, or sharing data with others, converting CSV to Excel is often a more practical and flexible choice.
Install Required Python Libraries
This guide demonstrates how to effortlessly convert CSV to Excel using Spire.XLS for Python. Spire.XLS is a powerful and professional Python Excel library that allows you to read, edit, and convert Excel files (both .xlsx and .xls) without relying on Microsoft Excel. Installing this CSV to Excel converter on your device is simple — just run the following command:
pip install Spire.XLS
Alternatively, you can download the Spire.XLS package manually for custom installation.
How to Convert CSV to Excel in Python: Single File
Now let’s get to the main part — how to convert a single CSV file to Excel using Python. With the help of Spire.XLS, this task becomes incredibly simple. All it takes is three easy steps: create a new workbook, load the CSV file, and save it as an Excel (.xlsx) file. Below is a detailed walkthrough along with a complete code example — let’s take a look!
Steps to convert a single CSV to Excel in Python:
- Create a Workbook instance.
- Load a sample CSV file using Workbook.LoadFromFile() method.
- Save the CSV file as Excel through Workbook.SaveToFile() method.
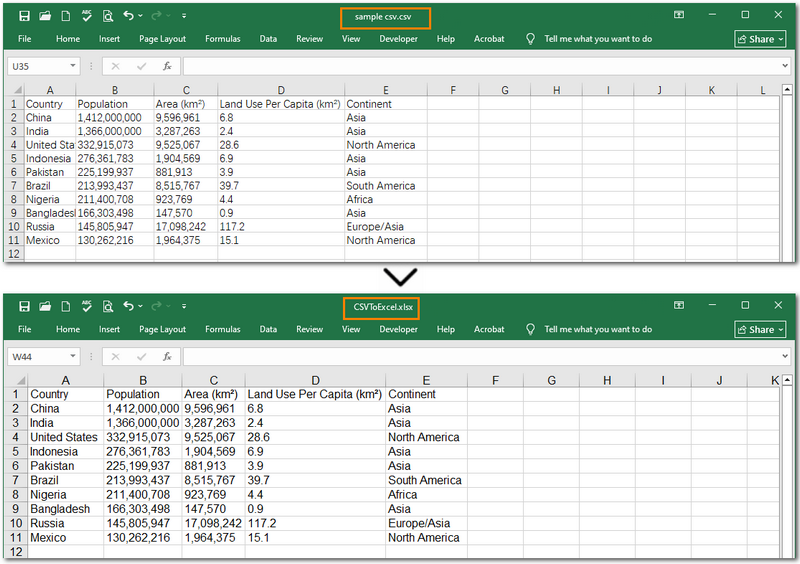
Below is the Python code to convert a CSV file to Excel. It also ignores parsing errors and automatically adjusts the column widths for better readability.
from spire.xls import *
from spire.xls.common import *

# Create a workbook
workbook = Workbook()

# Load a csv file
workbook.LoadFromFile("/sample csv.csv", ",", 1, 1)

# Set ignore error options
sheet = workbook.Worksheets[0]
sheet.Range["D2:E19"].IgnoreErrorOptions = IgnoreErrorType.NumberAsText
sheet.AllocatedRange.AutoFitColumns()

# Save the document and launch it
workbook.SaveToFile("/CSVToExcel1.xlsx", ExcelVersion.Version2013)
Warm Note: If you're only working with small files or doing some light testing, you can also use the free Spire.XLS. It's a great option for getting started quickly.
How to Batch Convert CSV to XLSX in Python
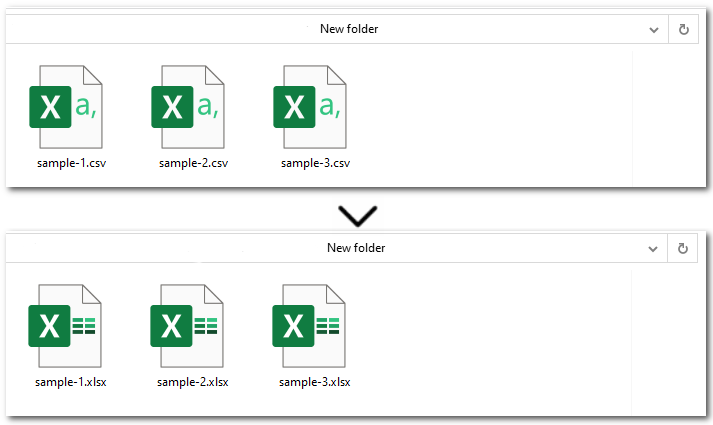
Another common scenario is when you need to convert multiple CSV files to Excel. Instead of manually replacing the file path and name for each one, there's a much more efficient approach. Simply place all the CSV files in the same folder, then use Python to loop through each file and convert them to Excel using the Workbook.SaveToFile() method. Let’s walk through the detailed steps below!
Steps to batch convert CSVs to Excel files in Python:
- Specify the file paths of input and output folders.
- Loop through all CSV files in the input folder.
- Create an object of Workbook class.
- Load each CSV file from the input folder with Workbook.LoadFromFile() method.
- Save the current CSV as an Excel file through Workbook.SaveToFile() method.
Here's the Python code to batch convert CSV to Excel (.XLSX):
import os
from spire.xls import *

input_folder = r"E:input\New folder"
output_folder = r"output\New folder"

# Loop through each CSV file
for csv_file in os.listdir(input_folder):
    if csv_file.endswith(".csv"):
        input_path = os.path.join(input_folder, csv_file)
        output_name = os.path.splitext(csv_file)[0] + ".xlsx"
        output_path = os.path.join(output_folder, output_name)

        # Create a Workbook instance and load CSV files
        workbook = Workbook()
        workbook.LoadFromFile(input_path, ",", 1, 1)

        # Save each CSV file as an Excel file
        workbook.SaveToFile(output_path, ExcelVersion.Version2013)
The Conclusion
This guide showed you how to convert CSV to Excel in Python with step-by-step instructions and complete code examples. Whether you're working with a single CSV file or multiple files, Spire.XLS makes the process simple, fast, and hassle-free. Need help with more advanced scenarios or other Excel-related tasks? Feel free to contact us anytime!
FAQs about Converting CSV to Excel
Q1: How to convert CSV to Excel in Python without pandas?
A: You can use libraries like Spire.XLS, openpyxl, or xlsxwriter to convert CSV files without relying on pandas. These tools provide simple APIs to load .csv files and export them as xlsx—no Microsoft Excel installation required.
Q2: What is the easiest way to convert multiple CSV files to Excel in Python?
A: Just place all CSV files in one folder, then loop through them in Python and convert each using Workbook.SaveToFile(). This approach is ideal for batch processing. Alternatively, online converters can be a quick fix for occasional use.
Q3: How to auto-adjust column width when converting CSV to Excel in Python?
A: After loading the CSV, call worksheet.autoFitColumns() in Spire.XLS to automatically resize columns based on content before saving the Excel file.

Text files (.txt) are a common way to store data due to their simplicity, but they lack the structure and analytical power of Excel spreadsheets. Converting TXT files to Excel allows for better data organization, visualization, and manipulation.
While manual import text file to Excel works for small datasets, automating this process saves time and reduces errors. Python, with its powerful libraries, offers an efficient solution. In this guide, you’ll learn how to convert TXT to Excel in Python using Spire.XLS for Python, a robust API for Excel file manipulation.
Prerequisites
Install Python and Spire.XLS
- Install Python on your machine from python.org.
- Install the Spire.XLS for Python library via PyPI. Open your terminal and run the following command:
pip install Spire.XLS
Prepare a TXT File
Ensure your TXT file follows a consistent structure, typically with rows separated by newlines and columns separated by delimiters (e.g., commas, tabs, or spaces). For example, a sample text file might look like this: 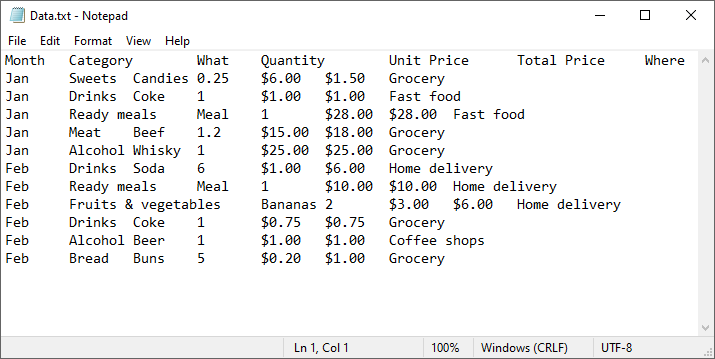
Step-by-Step Guide to Convert Text File to Excel
Step 1: Import Required Modules
In your Python script, import the necessary classes from Spire.XLS:
from spire.xls import *
from spire.xls.common import *
Step 2: Read and Parse the TXT File
Read the text file and split it into rows and columns using Python’s built-in functions. Define your delimiter (tab, in this case):
with open("Data.txt", "r") as file:
    lines = file.readlines()
data = [line.strip().split("\t") for line in lines]
Note: If different delimiter was used, replace the parameter "\t" of the split() method (e.g., spaces: split(" ")).
Step 3: Create an Excel Workbook
Initialize a workbook object and access the first worksheet:
workbook = Workbook()
sheet = workbook.Worksheets[0]
Step 4: Write Data to the Worksheet
Loop through the parsed data and populate the Excel cells.
for row_num, row_data in enumerate(data):
    for col_num, cell_data in enumerate(row_data):
        sheet.Range[row_num + 1, col_num + 1].Value = cell_data
        sheet.Range[1, col_num + 1].Style.Font.IsBold = True
Step 5: Save the Excel File
Export the workbook as an XLSX file (you can also use .xls for older formats):
workbook.SaveToFile("TXTtoExcel.xlsx", ExcelVersion.Version2016)
TXT to Excel Full Code Example
from spire.xls import *
from spire.xls.common import *

# Read TXT data
with open("Data.txt", "r") as file:
    lines = file.readlines()

# Split data by delimiter
data = [line.strip().split("\t") for line in lines]

# Create an Excel workbook
workbook = Workbook()

# Get the first worksheet
sheet = workbook.Worksheets[0]

# Iterate through each row and column in the list
for row_num, row_data in enumerate(data):
    for col_num, cell_data in enumerate(row_data):

        # Write the data into the corresponding Excel cells
        sheet.Range[row_num + 1, col_num + 1].Value = cell_data

        # Set the header row to bold
        sheet.Range[1, col_num + 1].Style.Font.IsBold = True

# Autofit column width
sheet.AllocatedRange.AutoFitColumns()

# Save as Excel (.xlsx or.xls) file
workbook.SaveToFile("TXTtoExcel.xlsx", ExcelVersion.Version2016)
workbook.Dispose()
The Excel workbook converted from a text file:
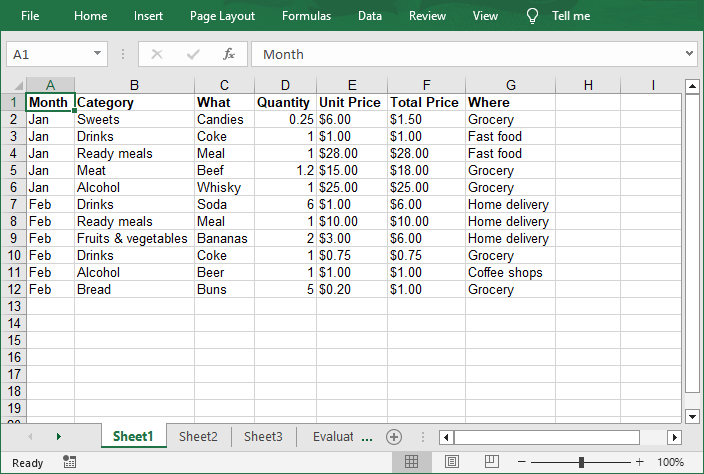
Conclusion
Converting TXT files to Excel in Python using Spire.XLS automates data workflows, saving time and reducing manual effort. Whether you’re processing logs, survey results, or financial records, this method ensures structured, formatted outputs ready for analysis.
Pro Tip: Explore Spire.XLS’s advanced features—such as charts, pivot tables, and encryption—to further enhance your Excel files.
FAQs
Q1: Can Spire.XLS convert large TXT files?
Yes, the Python Excel library is optimized for performance and can process large files efficiently. However, ensure your system has sufficient memory for very large datasets (e.g., millions of rows). For optimal results, process data in chunks or use batch operations.
Q2: Can I convert Excel back to TXT using Spire.XLS?
Yes, Spire.XLS allows to read Excel cells and write their values to a text file. A comprehensive guide is available at: Convert Excel to TXT in Python
Q3: How to handle the encoding issues during conversion?
Specify encoding if the text file uses non-standard characters (e.g., utf-8):
with open("Data.txt", "r", encoding='utf-8') as file:
    lines = file.readlines()
Get a Free License
To fully experience the capabilities of Spire.XLS for Python without any evaluation limitations, you can request a free 30-day trial license.
How to Filter Excel Pivot Tables with Python: Step-by-Step Guide
2025-05-16 10:01:44 Written by Administrator
Introduction
Pivot Tables in Excel are versatile tools that enable efficient data summarization and analysis. They allow users to explore data, uncover insights, and generate reports dynamically. One of the most powerful features of Pivot Tables is filtering, which lets users focus on specific data subsets without altering the original data structure.
What This Tutorial Covers
This tutorial provides a detailed, step-by-step guide on how to programmatically apply various types of filters to a Pivot Table in Excel using Python with the Spire.XLS for Python library. It covers the following topics:
- Benefits of Filtering Data in Pivot Tables
- Install Python Excel Library – Spire.XLS for Python
- Add Report Filter to Pivot Table
- Apply Row Field Filter in Pivot Table
- Apply Column Field Filter in Pivot Table
- FAQs
- Conclusion
Benefits of Filtering Data in Pivot Tables
Filtering is an essential feature of Pivot Tables that provides the following benefits:
- Enhanced Data Analysis: Quickly focus on specific segments or categories of your data to draw meaningful insights.
- Dynamic Data Updates: Filters automatically adjust to reflect changes when the underlying data is refreshed, keeping your analysis accurate.
- Improved Data Organization: Display only relevant data in your reports without altering or deleting the original dataset, preserving data integrity.
Install Python Excel Library – Spire.XLS for Python
Before working with Pivot Tables in Excel using Python, ensure the Spire.XLS for Python library is installed. The quickest way to do this is using pip, Python’s package manager. Simply run the following command in your terminal or command prompt:
pip install spire.xlsOnce installed, you’re ready to start automating Pivot Table filtering in your Python projects.
Add Report Filter to Pivot Table
A report filter allows you to filter the entire Pivot Table based on a particular field and value. This type of filter is useful when you want to display data for a specific category or item globally across the Pivot Table, without changing the layout.
Steps to Add a Report Filter
- Initialize the Workbook: Create a Workbook object to manage your Excel file.
- Load the Excel File: Use Workbook.LoadFromFile() to load an existing file containing a Pivot Table.
- Access the Worksheet: Use Workbook.Worksheets[] to select the desired worksheet.
- Locate the Pivot Table: Use Worksheet.PivotTables[] to access the specific Pivot Table.
- Define the Report Filter: Create a PivotReportFilter object specifying the field to filter.
- Apply the Report Filter: Add the filter to the Pivot Table using XlsPivotTable.ReportFilters.Add().
- Save the Updated File: Use Workbook.SaveToFile() to save your changes.
Code Example
- Python
from spire.xls import *

# Create an object of the Workbook class
workbook = Workbook()

# Load an existing Excel file containing a Pivot Table
workbook.LoadFromFile("Sample.xlsx")

# Access the first worksheet
sheet = workbook.Worksheets[0]

# Access the first Pivot Table in the worksheet
pt = sheet.PivotTables[0]

# Create a report filter for the field "Product"
reportFilter = PivotReportFilter("Product", True)

# Add the report filter to the pivot table
pt.ReportFilters.Add(reportFilter)

# Save the updated workbook to a new file
workbook.SaveToFile("AddReportFilter.xlsx", FileFormat.Version2016)
workbook.Dispose()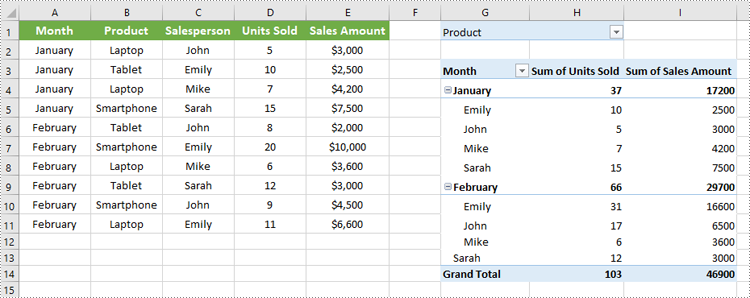
Apply Row Field Filter in Pivot Table
Row field filters allow you to filter data displayed in the row fields of an Excel Pivot Table. These filters can be based on labels (specific text values) or values (numeric criteria).
Steps to Add a Row Field Filter
- Initialize the Workbook: Create a Workbook object to manage the Excel file.
- Load the Excel File: Use Workbook.LoadFromFile() to load your target file containing a Pivot Table.
- Access the Worksheet: Select the desired worksheet using Workbook.Worksheets[].
- Locate the Pivot Table: Access the specific Pivot Table using Worksheet.PivotTables[].
- Add a Row Field Filter: Add a label filter or value filter using
XlsPivotTable.RowFields[].AddLabelFilter() or
XlsPivotTable.RowFields[].AddValueFilter().
- Calculate Pivot Table Data: Use XlsPivotTable.CalculateData() to calculate the pivot table data.
- Save the Updated File: Save your changes using Workbook.SaveToFile().
Code Example
- Python
from spire.xls import *

# Create an object of the Workbook class
workbook = Workbook()

# Load an Excel file
workbook.LoadFromFile("Sample.xlsx")

# Get the first worksheet
sheet = workbook.Worksheets[0]

# Get the first pivot table
pt = sheet.PivotTables[0]

# Add a value filter to the first row field in the pivot table
pt.RowFields[0].AddValueFilter(PivotValueFilterType.GreaterThan, pt.DataFields[0], Int32(5000), None)

# Or add a label filter to the first row field in the pivot table
# pt.RowFields[0].AddLabelFilter(PivotLabelFilterType.Equal, "Mike", None)

# Calculate the pivot table data
pt.CalculateData()

# Save the resulting file
workbook.SaveToFile("AddRowFieldFilter.xlsx", FileFormat.Version2016)
workbook.Dispose()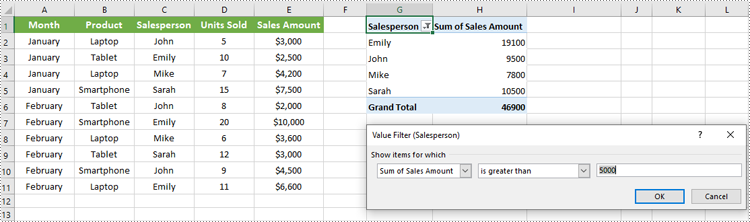
Apply Column Field Filter in Pivot Table
Column field filters in Excel Pivot Tables allow you to filter data displayed in the column fields. Similar to row field filters, column field filters can be based on labels (text values) or values (numeric criteria).
Steps to Add Column Field Filter
- Initialize the Workbook: Create a Workbook object to manage your Excel file.
- Load the Excel File: Use Workbook.LoadFromFile() to open your file containing a Pivot Table.
- Access the Worksheet: Select the target worksheet using Workbook.Worksheets[].
- Locate the Pivot Table: Use Worksheet.PivotTables[] to access the desired Pivot Table.
- Add a Column Field Filter: Add a label filter or value filter using
XlsPivotTable.ColumnFields[].AddLabelFilter() or
XlsPivotTable.ColumnFields[].AddValueFilter().
- Calculate Pivot Table Data: Use XlsPivotTable.CalculateData() to calculate the Pivot Table data.
- Save the Updated File: Save your changes using Workbook.SaveToFile().
Code Example
- Python
from spire.xls import *

# Create an object of the Workbook class
workbook = Workbook()

# Load the Excel file
workbook.LoadFromFile("Sample.xlsx")

# Access the first worksheet
sheet = workbook.Worksheets[0]

# Access the first Pivot Table
pt = sheet.PivotTables[0]

# Add a label filter to the first column field
pt.ColumnFields[0].AddLabelFilter(PivotLabelFilterType.Equal, String("Laptop"), None)

# # Or add a value filter to the first column field
# pt.ColumnFields[0].AddValueFilter(PivotValueFilterType.Between, pt.DataFields[0], Int32(5000), Int32(10000))

# Calculate the pivot table data
pt.CalculateData()

# Save the updated workbook
workbook.SaveToFile("AddColumnFieldFilter.xlsx", FileFormat.Version2016)
workbook.Dispose()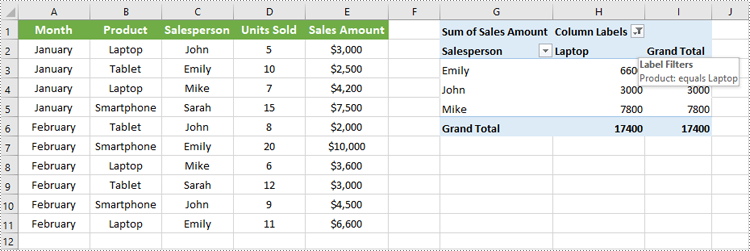
Conclusion
Filtering Pivot Tables in Excel is crucial for effective data analysis, allowing users to zoom in on relevant information without disrupting the table’s structure. Using Spire.XLS for Python, developers can easily automate adding, modifying, and managing filters on Pivot Tables programmatically. This tutorial covered the primary filter types—report filters, row field filters, and column field filters—with detailed code examples to help you get started quickly.
FAQs
Q: Can I add multiple filters to the same Pivot Table?
A: Yes, you can add multiple report filters, row filters, and column filters simultaneously to customize your data views with Spire.XLS.
Q: Do filters update automatically if the source data changes?
A: Yes, after refreshing the Pivot Table or recalculating with CalculateData(), filters will reflect the latest data.
Q: Can I filter based on custom conditions?
A: Spire.XLS supports many filter types including label filters (equals, begins with, contains) and value filters (greater than, less than, between).
Q: Is it possible to remove filters programmatically?
A: Yes, you can remove filters by clearing or resetting the respective filter collections or fields.
Get a Free License
To fully experience the capabilities of Spire.XLS for .NET without any evaluation limitations, you can request a free 30-day trial license.
In Microsoft Excel, each worksheet acts as a unique space for organizing distinct sets of data, projects, or analyses. Efficient management of these worksheets is crucial for quick navigation and effective data handling. By renaming worksheets, users can create intuitive labels that clearly indicate the content of each sheet, making it easier to locate specific information. Furthermore, customizing tab colors enhances visual organization, allowing users to differentiate between various sections or categories at a glance.
In this article, we will demonstrate how to change worksheet names and set tab colors in Excel using Python and the Spire.XLS for Python library.
Install Spire.XLS for Python
This scenario requires Spire.XLS for Python and plum-dispatch v1.7.4. They can be easily installed in your Windows through the following pip command.
pip install Spire.XLS
If you are unsure how to install, please refer to this tutorial: How to Install Spire.XLS for Python on Windows
Change Worksheet Names in Excel in Python
Spire.XLS for Python provides the Worksheet.Name property to rename a worksheet in an Excel file. The detailed steps are as follows.
- Create an object of the Workbook class.
- Load a sample Excel file using the Workbook.LoadFromFile() method.
- Get the desired worksheet using the Worbook.Worksheets[] property.
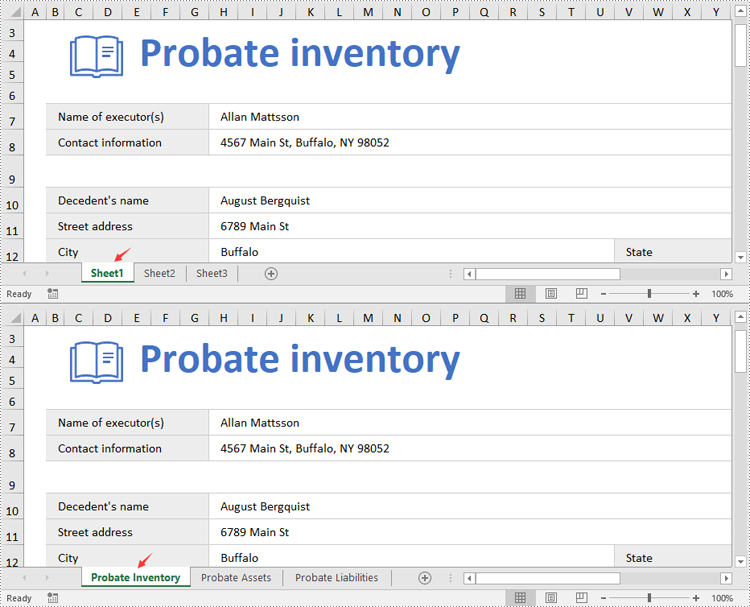
- Rename the worksheet using the Worksheet.Name property.
- Save the result file using the Workbook.SaveToFile() method.
- Python
from spire.xls import *
from spire.xls.common import *

# Specify the input and output file paths
inputFile = "Sample1.xlsx"
outputFile = "RenameWorksheets.xlsx"

# Create an object of the Workbook class
workbook = Workbook()
# Load a sample Excel file
workbook.LoadFromFile(inputFile)

# Rename the first worksheet
sheet = workbook.Worksheets[0]
sheet.Name = "Probate Inventory"

# Rename the second worksheet
sheet = workbook.Worksheets[1]
sheet.Name = "Probate Assets"

# Rename the third worksheet
sheet = workbook.Worksheets[2]
sheet.Name = "Probate Liabilities"

# Save the result file
workbook.SaveToFile(outputFile, ExcelVersion.Version2013)
workbook.Dispose()
Set Worksheet Tab Colors in Excel in Python
The Worksheet.TabColor property allows setting a tab color for a worksheet in an Excel file. The detailed steps are as follows.
- Create an object of the Workbook class.
- Load a sample Excel file using the Workbook.LoadFromFile() method.
- Get the desired worksheet using the Worbook.Worksheets[] property.
- Rename the worksheet using the Worksheet.TabColor property.
- Save the result file using the Workbook.SaveToFile() method.
- Python
from spire.xls import *
from spire.xls.common import *

# Specify the input and output file paths
inputFile = "Sample2.xlsx"
outputFile = "SetTabColor.xlsx"

# Create an object of the Workbook class
workbook = Workbook()
# Load a sample Excel file
workbook.LoadFromFile(inputFile)

# Set the tab color for the first worksheet
worksheet = workbook.Worksheets[0]
worksheet.TabColor = Color.get_Red()

# Set the tab color for the second worksheet
worksheet = workbook.Worksheets[1]
worksheet.TabColor = Color.get_Green()

# Set the tab color for the third worksheet
worksheet = workbook.Worksheets[2]
worksheet.TabColor = Color.get_LightBlue()

# Save the result file
workbook.SaveToFile(outputFile, ExcelVersion.Version2013)
workbook.Dispose()

Get a Free License
To fully experience the capabilities of Spire.XLS for Python without any evaluation limitations, you can request a free 30-day trial license.
Worksheet names can be used as unique identifiers for different collections of data in a workbook. When working with large Excel files that contain multiple worksheets, knowing the name of each worksheet can help you quickly identify where specific types of information are stored. In this article, you will learn how to get worksheet names in Excel in Python using Spire.XLS for Python.
Install Spire.XLS for Python
This scenario requires Spire.XLS for Python and plum-dispatch v1.7.4. They can be easily installed in your Windows through the following pip command.
pip install Spire.XLS
If you are unsure how to install, please refer to this tutorial: How to Install Spire.XLS for Python on Windows
Get All Worksheet Names in Excel in Python
The Worksheet.Name property returns the name of a Worksheet. To retrieve the names of all the worksheets in Excel (including hidden ones), you can iterate through each worksheet and get their names with this property. The following are the detailed steps:
- Create a Workbook instance.
- Load an Excel file using Workbook.LoadFromFile() method.
- Create a list to store the retrieved worksheet names.
- Iterate through each worksheet.
- Get the name of each worksheet through Worksheet.Name property and append it to the list.
- Write the contents of the list to a text file.
- Python
from spire.xls import *
from spire.xls.common import *

# Specifiy the input and output file paths
inputFile = "BudgetSum.xlsx"
outputFile = "GetWorksheetNames.txt"

# Create a Workbook instance
workbook = Workbook()

# Load an Excel file
workbook.LoadFromFile(inputFile)

# Create a list to store the worksheet names
names = []

# Iterate through each worksheet
for sheet in workbook.Worksheets:

    # Get each worksheet name and add it to the list
    names.append(sheet.Name)

# Write to a txt file
with open(outputFile, "w", encoding="utf-8") as file:
    file.write("\n".join(names))

Get Hidden Worksheet Names in Excel in Python
If you only need to retrieve the names of the hidden worksheets, you can first iterate through each worksheet to determine whether a worksheet is hidden, and if so, get its name through the Worksheet.Name property. The following are the detailed steps:
- Create a Workbook instance.
- Load an Excel file using Workbook.LoadFromFile() method.
- Create a list to store the retrieved worksheet names.
- Iterate through each worksheet and find the hidden worksheets.
- Get the names of the hidden worksheets through Worksheet.Name property and append them to the list.
- Write the contents of the list to a text file.
- Python
from spire.xls import *
from spire.xls.common import *

# Specifiy the input and output file paths
inputFile = "BudgetSum.xlsx"
outputFile = "GetHiddenWorksheetNames.txt"

# Create a Workbook instance
workbook = Workbook()

# Load an Excel file
workbook.LoadFromFile(inputFile)

# Create a list to store the worksheet names
names = []

# Iterate through each worksheet
for sheet in workbook.Worksheets:

    # Detect the hidden worksheet
    if sheet.Visibility == WorksheetVisibility.Hidden:

        # Get the hidden worksheet name and add it to the list
        names.append(sheet.Name)

# Write to a txt file
with open(outputFile, "w", encoding="utf-8") as file:
    file.write("\n".join(names))

Get a Free License
To fully experience the capabilities of Spire.XLS for Python without any evaluation limitations, you can request a free 30-day trial license.
In today's data-driven world, efficiently transferring data into Excel is essential. Python's versatile ecosystem automates the process, eliminating manual entry, reducing errors, and handling large datasets beyond Excel's limits. Whether pulling data from APIs, databases, or unstructured sources, Python creates dynamic workflows that ensure consistency and scalability. Its compatibility with various data formats transforms raw data into structured Excel files, bridging complex data pipelines with user-friendly outputs while boosting productivity and enabling professionals to focus on high-value analysis. This article will demonstrate how to use Spire.XLS for Python to import data into Excel workbooks within Python applications.
- How to Write Data into Excel Files with Spire.XLS for Python
- Import CSV Data into Excel Worksheets
- Transfer Data and Worksheets Between Excel Files
- Import JSON Data into Excel Worksheets
- Import XML Data into Excel Worksheets
- Import Database Records into Excel Worksheets
- Import HTML Table Data into Excel Worksheets
Install Spire.XLS for Python
This scenario requires Spire.XLS for Python and plum-dispatch v1.7.4. They can be easily installed in your Windows through the following pip command.
pip install Spire.XLS
If you are unsure how to install, please refer to: How to Install Spire.XLS for Python on Windows
How to Write Data into Excel Files with Spire.XLS for Python
Spire.XLS for Python is an Excel file processing library that supports reading, editing, and writing Excel files. With this library, you can effortlessly write data into Excel worksheets, apply formatting, and save the workbook as a file.
Before writing data into Excel worksheets, Python provides a variety of built-in and third-party libraries-such as json, xml.etree.ElementTree, and BeautifulSoup-that allow you to read and process data from different file formats, including TXT, CSV, JSON, XML, and HTML. These libraries help transform raw or semi-structured data into lists, dictionaries, or dataframes that are easy to work with in Python.
Once the data is extracted and structured, Spire.XLS for Python can be used to write it into Excel workbooks. The library offers precise control over worksheet creation, cell-level data entry, formatting, and file export in Excel-compatible formats.
Steps to Write Data into Excel Using Spire.XLS for Python:
- Initialize a Workbook
Create an instance of the Workbook class to generate a new Excel workbook with three default worksheets, or use the Workbook.LoadFromFile(filePath: str) method to load an existing Excel file. - Create or Clear Worksheets
Use the Workbook.Worksheets.get_Item() method to get worksheets, or the Workbook.Worksheets.Add(sheetName: str) method to add worksheets. - Prepare the Data
Use Python libraries such as json, csv, or xml.etree.ElementTree to extract and organize your data into row and column structures. - Write Headers and Data
Iterate through your data and use the Worksheet.Range.get_Item(row: int, col: int).Value property to assign values to specific cells. - Format the Worksheet (Optional)
Apply styles using the CellRange.ApplyStyle() method, autofit columns using the Worksheet.AutoFitColumn() method, and set borders or colors to improve the appearance and readability of the worksheet. - Save the Workbook
Save the final Excel file using the Workbook.SaveToFile(filePath: str, format: FileFormat) method in your preferred Excel version.
Import CSV Data into Excel Worksheets
Importing data from CSV files into Excel is a fundamental task in data preparation. With Spire.XLS for Python, you can easily load structured data from CSV files using the Workbook.LoadFromFile(filePath: str, separator: str) method of the Workbook class and convert it into a well-formatted Excel workbook. In fact, data from text files can be imported in the same way. This method supports custom cell styling, header addition, and ensures the data is clean and ready for analysis or reporting.
Steps to import CSV data into Excel workbooks:
- Create an instance of the Workbook class.
- Load the CSV table data using the Workbook.LoadFromFile(filePath: str, separator: str) method and specify the file path and the column separator (e.g., comma or tab).
- Access the first worksheet using the Workbook.Worksheets.get_Item(index: int) method.
- Optionally, read the table from the first worksheet and write it into another using the Worksheet.Range.get_Item(row: int, col: int).Value property of the Worksheet class.
- Format the worksheet as needed and save the result using the Workbook.SaveToFile(filePath: str, fileFormat) method.
- Python
from spire.xls import Workbook, FileFormat, BuiltInStyles
# Create a Workbook object
workbook = Workbook()
# Load the table from the CSV or text file
workbook.LoadFromFile("Sample.csv", ",")
# workbook.LoadFromFile("Sample.txt", "\t")
# Get the first worksheet
sheet = workbook.Worksheets.get_Item(0)
# Format the table
sheet.Rows.get_Item(0).BuiltInStyle = BuiltInStyles.Heading4
for i in range(1, sheet.Rows.Count):
sheet.Rows.get_Item(i).BuiltInStyle = BuiltInStyles.Accent4_20
for j in range(sheet.Columns.Count):
sheet.AutoFitColumn(j + 1)
# Save the workbook
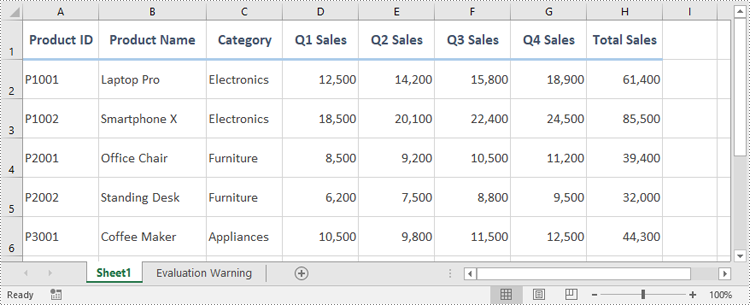
workbook.SaveToFile("output/TextCSVToExcel.xlsx", FileFormat.Version2016)
workbook.Dispose()

Transfer Data and Worksheets Between Excel Files
Working with multiple Excel files often requires copying data or entire worksheets from one workbook to another. With Spire.XLS for Python, you can perform these operations programmatically using the Workbook and Worksheet classes, allowing you to preserve formatting, formulas, and data structure when consolidating or merging information from different sources.
Steps to copy data and worksheets between Excel workbooks:
- Create a new instance of the Workbook class and load the source Excel file using the Workbook.LoadFromFile(filePath: str) method.
- Create another Workbook instance and clear the default worksheets using the Workbook.Worksheets.Clear() method.
- To copy data only:
- Iterate through worksheets in the source workbook and create new worksheets in the destination using the Workbook.Worksheets.Add(sheetName: str) method.
- Use the Worksheet.Range.get_Item(row, col).Value property to read from the source worksheet and write into the destination worksheet.
- To copy entire worksheets:
- Use the Worksheet.CopyFrom(sourceWorksheet) method to duplicate the content of each source worksheet into a new worksheet.
- Save the new workbook using the Workbook.SaveToFile(filePath: str, ileFormat: FileFormat) method.
- Python
from spire.xls import Workbook, FileFormat

# Create a Workbook object and load an Excel file
workbook = Workbook()
workbook.LoadFromFile("Sample.xlsx")

# Create another Workbook object and load an Excel file
newWorkbook = Workbook()
newWorkbook.Worksheets.Clear()

# Read data from one workbook and insert it into another
for i in range(workbook.Worksheets.get_Item(0).Rows.Count):
    for j in range(workbook.Worksheets.get_Item(0).Columns.Count):
        # Add a new worksheet
        sheet = newWorkbook.Worksheets.Add(workbook.Worksheets.get_Item(0).Name)
        # Write data
        sheet.Range.get_Item(i + 1, j + 1).Value = workbook.Worksheets.get_Item(0).Range.get_Item(i + 1, j + 1).Value

# Copy worksheets from the first workbook to the second workbook
for i in range(workbook.Worksheets.Count):
    # Add a new worksheet
    newSheet = newWorkbook.Worksheets.Add(workbook.Worksheets.get_Item(i).Name + "-Copy")
    # Copy all contents to the new worksheet
    newSheet.CopyFrom(workbook.Worksheets.get_Item(i))

# Save the workbook
newWorkbook.SaveToFile("output/ExcelToExcel.xlsx", FileFormat.Version2016)
workbook.Dispose()
newWorkbook.Dispose()

Import JSON Data into Excel Worksheets
JSON (JavaScript Object Notation) is a popular format for structured data, commonly used in APIs and modern web applications. With Python's built-in json module, you can easily parse JSON files and extract table-like data. This data can then be written into an Excel worksheet using Spire.XLS for Python, which allows you to format, edit, and organize the content for easier analysis, visualization, or sharing.
A code example demonstrates how to import JSON data into Excel files:
- Python
from spire.xls import Workbook, FileFormat, BuiltInStyles
import json

# Load JSON data
with open("Sample.json", "r", encoding="utf-8") as f:
    jsonData = json.load(f)
headers = list(jsonData[0].keys())
rows = [[str(item[key]) for key in headers] for item in jsonData]

# Create a Workbook instance
workbook = Workbook()
# Clear the default worksheets and add new one
workbook.Worksheets.Clear()
sheet = workbook.Worksheets.Add("JSON Data")

# Write headers and rows into the new worksheet
for col, header in enumerate(headers):
    sheet.Range[1, col + 1].Value = header
for row_idx, row_data in enumerate(rows):
    for col_idx, value in enumerate(row_data):
        sheet.Range[row_idx + 2, col_idx + 1].Value = value

# Apply styles and auto-fit columns
sheet.Rows[0].BuiltInStyle = BuiltInStyles.Heading2
for row in range(1, sheet.Rows.Count):
    sheet.Rows[row].BuiltInStyle = BuiltInStyles.Accent2_40
for col in range(sheet.Columns.Count):
    sheet.AutoFitColumn(col + 1)

# Save Excel file
workbook.SaveToFile("output/JSONToExcel.xlsx", FileFormat.Version2016)
workbook.Dispose()

Import XML Data into Excel Worksheets
XML is a widely used format for representing hierarchical data in enterprise systems and data feeds. With Python's xml.etree.ElementTree module, you can navigate and extract the desired elements and attributes. Once the data is retrieved, Spire.XLS for Python allows you to write the data into Excel worksheets, mapping the hierarchical structure into rows and columns. This makes it easier to present, filter, and analyze complex XML content in a tabular format.
The following example shows how to extract XML data and write it into an Excel worksheet with Spire.XLS for Python:
- Python
from spire.xls import Workbook, FileFormat, BuiltInStyles
import xml.etree.ElementTree as ET

# Load XML data
tree = ET.parse("Sample.xml")
root = tree.getroot()
first_order = root.find("order")
headers = [elem.tag.replace('_', ' ').title() for elem in first_order]

rows = [
    [order.find(tag.lower().replace(" ", "_")).text or "" for tag in headers]
    for order in root.findall("order")
]

# Use Spire.XLS for Python to create and write to workbook
workbook = Workbook()
workbook.Worksheets.Clear()
sheet = workbook.Worksheets.Add("XML Data")

# Write headers and rows
for col, header in enumerate(headers):
    sheet.Range[1, col + 1].Value = header

for row_idx, row_data in enumerate(rows):
    for col_idx, value in enumerate(row_data):
        sheet.Range[row_idx + 2, col_idx + 1].Value = value

# Apply styles and auto-fit columns
sheet.Rows[0].BuiltInStyle = BuiltInStyles.Heading4
for row in range(1, sheet.Rows.Count):
    sheet.Rows[row].BuiltInStyle = BuiltInStyles.Accent4_40
for col in range(sheet.Columns.Count):
    sheet.AutoFitColumn(col + 1)

# Save Excel file
workbook.SaveToFile("output/XMLToExcel.xlsx", FileFormat.Version2016)
workbook.Dispose()

Import Database Records into Excel Worksheets
Importing database records into Excel is a common requirement in reporting and business intelligence. You can use database connector libraries in Python, such as sqlite3, pyodbc, or pymysql, to establish connections with various relational databases and retrieve records via SQL queries.
Once data is fetched from the database, it can be written into Excel using the Workbook class and the Worksheet.Range.get_Item().Value property in Spire.XLS. This enables you to convert relational datasets into readable and portable Excel workbooks that are ideal for reports, dashboards, and archival.
An example demonstrates how to fetch rows from a SQLite database and populate an Excel worksheet:
- Python
import sqlite3
from spire.xls import Workbook, FileFormat, BuiltInStyles

# Connect to the SQLite database
conn = sqlite3.connect("Sample.db")
cursor = conn.cursor()

# Get all table names in the database
cursor.execute("SELECT name FROM sqlite_master WHERE type='table';")
tables = [row[0] for row in cursor.fetchall()]

# Create an Excel workbook
workbook = Workbook()
workbook.Worksheets.Clear()  # Clear the default worksheets

# Loop through each table and export to a worksheet
for table_name in tables:
    # Fetch all data from the table
    cursor.execute(f"SELECT * FROM {table_name}")
    rows = cursor.fetchall()
    # Get column names
    column_names = [desc[0] for desc in cursor.description]
    # Add a new worksheet with the table name
    sheet = workbook.Worksheets.Add(table_name)

    # Write header row
    for col_index, column_name in enumerate(column_names):
        cell = sheet.Range.get_Item(1, col_index + 1)
        cell.Value = str(column_name)

    # Write data rows
    for row_index, row in enumerate(rows, start=2):
        for col_index, value in enumerate(row):
            sheet.Range.get_Item(row_index, col_index + 1).Value = str(value)

    # Apply styles
    sheet.Rows.get_Item(0).BuiltInStyle = BuiltInStyles.Heading4
    for i in range(1, sheet.Rows.Count):
        sheet.Rows.get_Item(i).BuiltInStyle = BuiltInStyles.Accent4_20
    for j in range(sheet.Columns.Count):
        sheet.AutoFitColumn(j + 1)

# Close the database connection
conn.close()

# Save the Excel file
workbook.SaveToFile("output/SQDBToExcel.xlsx", FileFormat.Version2016)
workbook.Dispose()

Import HTML Table Data into Excel Worksheets
Many web pages display data in HTML table format. By using the BeautifulSoup library in Python, you can scrape table data from web content and convert it into structured data. This data can then be written into Excel worksheets using the Spire.XLS for Python library.
With optional styling and formatting capabilities, you can preserve the tabular structure and create professional-looking reports from online sources such as stock data, weather updates, or product listings.
A code example demonstrates how to extract table data from HTML and write it into Excel worksheets:
- Python
from bs4 import BeautifulSoup
from spire.xls import Workbook, FileFormat, BuiltInStyles

# Read HTML file
with open("Sample.html", "r", encoding="utf-8") as f:
    soup = BeautifulSoup(f, "html.parser")

# Find the table
table = soup.find("table")
rows = table.find_all("tr")

# Extract data from table as a 2D list
data = []
for row in rows:
    cells = row.find_all(["th", "td"])
    data.append([cell.get_text(strip=True) for cell in cells])

# Create a new Excel workbook
workbook = Workbook()
# Get the first worksheet
sheet = workbook.Worksheets.get_Item(0)

# Iterate through the data
for row_index, row in enumerate(data, start=1):
    for col_index, cell_value in enumerate(row, start=1):
        # Write the table data to the cells in the worksheet
        sheet.Range.get_Item(row_index, col_index).Value = str(cell_value)

# Format the table
sheet.Rows.get_Item(0).BuiltInStyle = BuiltInStyles.Heading4
for i in range(1, sheet.Rows.Count):
    sheet.Rows.get_Item(i).BuiltInStyle = BuiltInStyles.Accent4_20
for j in range(sheet.Columns.Count):
    sheet.AutoFitColumn(j + 1)

# Save the Excel file
workbook.SaveToFile("output/HTMLToExcel.xlsx", FileFormat.Version2016)
workbook.Dispose()

Get a Free License
To fully experience the capabilities of Spire.XLS for Python without any evaluation limitations, you can request a free 30-day trial license.
Applying styles is one of the simplest ways to enhance the professionalism and readability of Excel spreadsheets. Excel provides a wide range of built-in styles that allow users to quickly format cells, ranges, or worksheets. Additionally, users can create custom styles to specify fonts, colors, borders, number formats, and more, tailored to their individual preferences. Whether you're designing professional reports, sales presentations, or project management plans, knowing how to use styles effectively helps make data more visually appealing and easier to understand.
In this guide, you will learn how to apply styles to cells or worksheets in Excel in Python using Spire.XLS for Python.
- Apply a Built-in Style to Cells in Excel in Python
- Apply a Custom Style to Cells in Excel in Python
- Apply a Custom Style to a Worksheet in Excel in Python
Install Spire.XLS for Python
This scenario requires Spire.XLS for Python and plum-dispatch v1.7.4. They can be easily installed in your Windows through the following pip command.
pip install Spire.XLS
If you are unsure how to install, please refer to this tutorial: How to Install Spire.XLS for Python on Windows
Apply a Built-in Style to Cells in Excel in Python
Spire.XLS for Python offers the CellRange.BuiltInStyle property, which enables developers to apply built-in styles, such as Title, Heading 1, and Heading 2 to individual cells or ranges in Excel. The detailed steps are as follows.
- Create an object of the Workbook class.
- Load an Excel file using the Workbook.LoadFromFile() method.
- Get a specific worksheet by its index using the Workbook.Worksheets[index] property.
- Get the desired cell or range of cells using the Worksheet.Range[] property.
- Apply a built-in style to the cell or range of cells using the CellRange.BuiltInStyle property.
- Save the resulting file using the Workbook.SaveToFile() method.
- Python
from spire.xls import *
from spire.xls.common import *

# Create an object of the Workbook class
workbook = Workbook()
# Load the Excel file
workbook.LoadFromFile("Sample.xlsx")

# Get the first sheet
sheet = workbook.Worksheets[0]

# Get the desired cell range
range = sheet.Range["A1:H1"]
# Apply a built-in style to the cell range
range.BuiltInStyle = BuiltInStyles.Heading2

# Save the resulting file
workbook.SaveToFile("ApplyBuiltinStyle.xlsx", ExcelVersion.Version2016)
workbook.Dispose()
Apply a Custom Style to Cells in Excel in Python
Developers can use the Workbook.Styles.Add() method to create a custom style, which can then be applied to individual cells or ranges using the CellRange.Style property. The detailed steps are as follows.
- Create an object of the Workbook class.
- Load an Excel file using the Workbook.LoadFromFile() method.
- Get a specific worksheet by its index using the Workbook.Worksheets[index] property.
- Get the desired cell or range of cells using the Worksheet.Range[] property.
- Add a custom style to the workbook using the Workbook.Styles.Add() method.
- Define the formatting, such as the font size, font color, text alignment, cell borders and cell background color, using the properties of the CellStyle class.
- Apply the custom style to the cell or range of cells using the CellRange.Style property.
- Save the resulting file using the Workbook.SaveToFile() method.
- Python
from spire.xls import *
from spire.xls.common import *

# Create an object of the Workbook class
workbook = Workbook()
# Load the Excel file
workbook.LoadFromFile("Sample.xlsx")

# Get the first sheet
sheet = workbook.Worksheets[0]

# Get the desired cell range
range = sheet.Range["A1:H1"]

# Add a custom style to the workbook
style = workbook.Styles.Add("CustomCellStyle")
# Set the font size
style.Font.Size = 13
# Set the font color
style.Font.Color = Color.get_White()
# Bold the text
style.Font.IsBold = True
# Set the vertical text alignment
style.VerticalAlignment = VerticalAlignType.Bottom
# Set the horizontal text alignment
style.HorizontalAlignment = HorizontalAlignType.Left
# Set the bottom border color
style.Borders[BordersLineType.EdgeBottom].Color = Color.get_GreenYellow()
# Set the bottom border type
style.Borders[BordersLineType.EdgeBottom].LineStyle = LineStyleType.Medium
# Set the background color
style.Color = Color.get_CornflowerBlue()

# Apply the custom style to the cell range
range.Style = style

# Save the resulting file
workbook.SaveToFile("ApplyCustomStyle.xlsx", ExcelVersion.Version2016)
workbook.Dispose()
Apply a Custom Style to a Worksheet in Excel in Python
In certain cases, it may be necessary to apply a custom style to an entire worksheet rather than to specific cells or ranges. This can be accomplished using the Worksheet.ApplyStyle() method. The detailed steps are as follows.
- Create an object of the Workbook class.
- Load an Excel file using the Workbook.LoadFromFile() method.
- Get a specific worksheet by its index using the Workbook.Worksheets[index] property.
- Add a custom style to the workbook using the Workbook.Styles.Add() method.
- Define the formatting, such as the font size, font color, and cell background color, using the properties of the CellStyle class.
- Apply the custom style to the worksheet using the Worksheet.ApplyStyle() method.
- Save the resulting file using the Workbook.SaveToFile() method.
- Python
from spire.xls import *
from spire.xls.common import *

# Create an object of the Workbook class
workbook = Workbook()
# Load the Excel file
workbook.LoadFromFile("Sample.xlsx")

# Get the first sheet
sheet = workbook.Worksheets[0]

# Add a custom style to the workbook
style = workbook.Styles.Add("CustomSheetStyle")
# Set the font size
style.Font.Size = 12
# Set the font color
style.Font.Color = Color.FromRgb(91, 155, 213)
# Set the cell background color
style.Color = Color.FromRgb(242, 242, 242)

# Apply the custom style to the worksheet
sheet.ApplyStyle(style)

# Save the resulting file
workbook.SaveToFile("ApplyCustomStyleToSheet.xlsx", ExcelVersion.Version2016)
workbook.Dispose()
Apply for a Temporary License
If you'd like to remove the evaluation message from the generated documents, or to get rid of the function limitations, please request a 30-day trial license for yourself.
A line chart is a type of chart that displays information as a series of data points connected by straight line segments. It's particularly useful for showing changes over time. For example, if you're tracking monthly sales figures, a line chart can help you identify trends, peaks, and troughs. In this article, you will learn how to create a line chart in Excel in Python using Spire.XLS for Python.
Install Spire.XLS for Python
This scenario requires Spire.XLS for Python and plum-dispatch v1.7.4. They can be easily installed in your Windows through the following pip command.
pip install Spire.XLS
If you are unsure how to install, please refer to this tutorial: How to Install Spire.XLS for Python on Windows
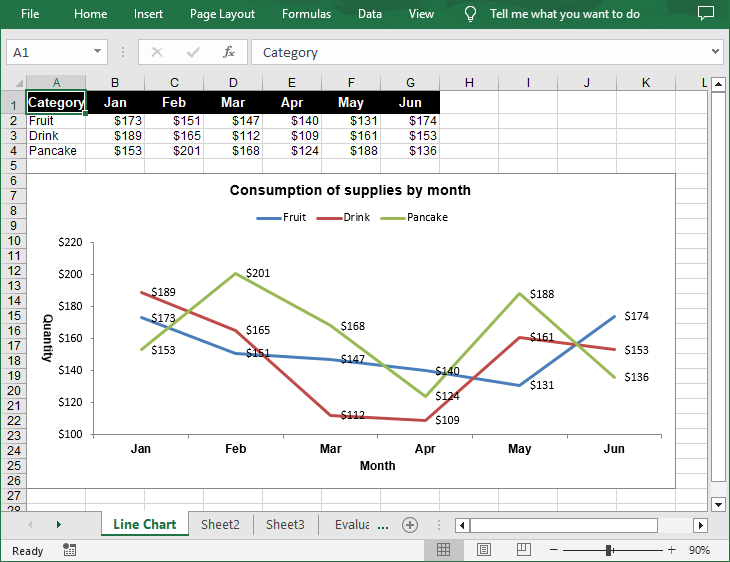
Create a Simple Line Chart in Excel in Python
Spire.XLS for Python provides the Worksheet.Charts.Add(ExcelChartType.Line) method to add a simple line chart to an Excel worksheet. The following are the detailed steps:
- Create a Workbook instance.
- Get a specified worksheet using Workbook.Worksheets[] property.
- Add the chart data to specified cells and set the cell styles.
- Add a simple line chart to the worksheet using Worksheet.Charts.Add(ExcelChartType.Line) method.
- Set data range for the chart using Chart.DataRange property.
- Set the position, title, axis and other attributes of the chart.
- Save the result file using Workbook.SaveToFile() method.
- Python
from spire.xls import *
from spire.xls.common import *

# Create a Workbook instance
workbook = Workbook()

# Get the first sheet and set its name
sheet = workbook.Worksheets[0]
sheet.Name = "Line Chart"

# Add chart data to specified cells
sheet.Range["A1"].Value = "Category"
sheet.Range["A2"].Value = "Fruit"
sheet.Range["A3"].Value = "Drink"
sheet.Range["A4"].Value = "Pancake"

sheet.Range["B1"].Value = "Jan"
sheet.Range["B2"].NumberValue = 173
sheet.Range["B3"].NumberValue = 189
sheet.Range["B4"].NumberValue = 153

sheet.Range["C1"].Value = "Feb"
sheet.Range["C2"].NumberValue = 151
sheet.Range["C3"].NumberValue = 165
sheet.Range["C4"].NumberValue = 201

sheet.Range["D1"].Value = "Mar"
sheet.Range["D2"].NumberValue = 147
sheet.Range["D3"].NumberValue = 112
sheet.Range["D4"].NumberValue = 168

sheet.Range["E1"].Value = "Apr"
sheet.Range["E2"].NumberValue = 140
sheet.Range["E3"].NumberValue = 109
sheet.Range["E4"].NumberValue = 124

sheet.Range["F1"].Value = "May"
sheet.Range["F2"].NumberValue = 131
sheet.Range["F3"].NumberValue = 161
sheet.Range["F4"].NumberValue = 188

sheet.Range["G1"].Value = "Jun"
sheet.Range["G2"].NumberValue = 174
sheet.Range["G3"].NumberValue = 153
sheet.Range["G4"].NumberValue = 136

# Set cell styles
sheet.Range["A1:G1"].RowHeight = 20
sheet.Range["A1:G1"].Style.Color = Color.get_Black()
sheet.Range["A1:G1"].Style.Font.Color = Color.get_White()
sheet.Range["A1:G1"].Style.Font.IsBold = True
sheet.Range["A1:G1"].Style.Font.Size = 11
sheet.Range["A1:G1"].Style.VerticalAlignment = VerticalAlignType.Center
sheet.Range["A1:G1"].Style.HorizontalAlignment = HorizontalAlignType.Center
sheet.Range["B2:G4"].Style.NumberFormat = "\"$\"#,##0"

# Add a line chart to the worksheet
chart = sheet.Charts.Add(ExcelChartType.Line)

# Set data range for the chart
chart.DataRange = sheet.Range["A1:G4"]

# Set position of chart
chart.LeftColumn = 1
chart.TopRow = 6
chart.RightColumn = 12
chart.BottomRow = 27

# Set and format chart title
chart.ChartTitle = "Consumption of supplies by month"
chart.ChartTitleArea.IsBold = True
chart.ChartTitleArea.Size = 12

# Set the category axis of the chart
chart.PrimaryCategoryAxis.Title = "Month"
chart.PrimaryCategoryAxis.Font.IsBold = True
chart.PrimaryCategoryAxis.TitleArea.IsBold = True

# Set the value axis of the chart
chart.PrimaryValueAxis.Title = "Quantity"
chart.PrimaryValueAxis.HasMajorGridLines = False
chart.PrimaryValueAxis.TitleArea.TextRotationAngle = 90
chart.PrimaryValueAxis.MinValue = 100
chart.PrimaryValueAxis.TitleArea.IsBold = True

# Set series colors and data labels
for cs in chart.Series:
    cs.Format.Options.IsVaryColor = True
    cs.DataPoints.DefaultDataPoint.DataLabels.HasValue = True

# Set legend position
chart.Legend.Position = LegendPositionType.Top

# Save the document
workbook.SaveToFile("LineChart.xlsx", ExcelVersion.Version2016)
workbook.Dispose()
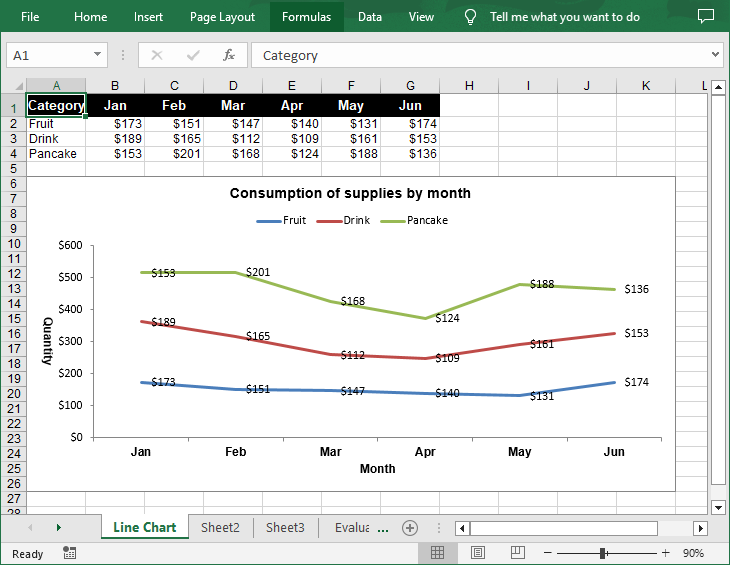
Create a Stacked Line Chart in Excel in Python
A stacked line chart stacks the values of each category on top of each other. This makes it easier to visualize how each data series contributes to the overall trend. The following are the steps to create a stacked line chart using Python:
- Create a Workbook instance.
- Get a specified worksheet using Workbook.Worksheets[] property.
- Add the chart data to specified cells and set the cell styles.
- Add a stacked line chart to the worksheet using Worksheet.Charts.Add(ExcelChartType.LineStacked) method.
- Set data range for the chart using Chart.DataRange property.
- Set the position, title, axis and other attributes of the chart.
- Save the result file using Workbook.SaveToFile() method.
- Python
from spire.xls import *
from spire.xls.common import *

# Create a Workbook instance
workbook = Workbook()

# Get the first sheet and set its name
sheet = workbook.Worksheets[0]
sheet.Name = "Line Chart"

# Add chart data to specified cells
sheet.Range["A1"].Value = "Category"
sheet.Range["A2"].Value = "Fruit"
sheet.Range["A3"].Value = "Drink"
sheet.Range["A4"].Value = "Pancake"

sheet.Range["B1"].Value = "Jan"
sheet.Range["B2"].NumberValue = 173
sheet.Range["B3"].NumberValue = 189
sheet.Range["B4"].NumberValue = 153

sheet.Range["C1"].Value = "Feb"
sheet.Range["C2"].NumberValue = 151
sheet.Range["C3"].NumberValue = 165
sheet.Range["C4"].NumberValue = 201

sheet.Range["D1"].Value = "Mar"
sheet.Range["D2"].NumberValue = 147
sheet.Range["D3"].NumberValue = 112
sheet.Range["D4"].NumberValue = 168

sheet.Range["E1"].Value = "Apr"
sheet.Range["E2"].NumberValue = 140
sheet.Range["E3"].NumberValue = 109
sheet.Range["E4"].NumberValue = 124

sheet.Range["F1"].Value = "May"
sheet.Range["F2"].NumberValue = 131
sheet.Range["F3"].NumberValue = 161
sheet.Range["F4"].NumberValue = 188

sheet.Range["G1"].Value = "Jun"
sheet.Range["G2"].NumberValue = 174
sheet.Range["G3"].NumberValue = 153
sheet.Range["G4"].NumberValue = 136

# Set cell styles
sheet.Range["A1:G1"].RowHeight = 20
sheet.Range["A1:G1"].Style.Color = Color.get_Black()
sheet.Range["A1:G1"].Style.Font.Color = Color.get_White()
sheet.Range["A1:G1"].Style.Font.IsBold = True
sheet.Range["A1:G1"].Style.Font.Size = 11
sheet.Range["A1:G1"].Style.VerticalAlignment = VerticalAlignType.Center
sheet.Range["A1:G1"].Style.HorizontalAlignment = HorizontalAlignType.Center
sheet.Range["B2:G4"].Style.NumberFormat = "\"$\"#,##0"

# Add a stacked line chart to the worksheet
chart = sheet.Charts.Add(ExcelChartType.LineStacked)

# Set data range for the chart
chart.DataRange = sheet.Range["A1:G4"]

# Set position of chart
chart.LeftColumn = 1
chart.TopRow = 6
chart.RightColumn = 12
chart.BottomRow = 27

# Set and format chart title
chart.ChartTitle = "Consumption of supplies by month"
chart.ChartTitleArea.IsBold = True
chart.ChartTitleArea.Size = 12

# Set the category axis of the chart
chart.PrimaryCategoryAxis.Title = "Month"
chart.PrimaryCategoryAxis.Font.IsBold = True
chart.PrimaryCategoryAxis.TitleArea.IsBold = True

# Set the value axis of the chart
chart.PrimaryValueAxis.Title = "Quantity"
chart.PrimaryValueAxis.HasMajorGridLines = False
chart.PrimaryValueAxis.TitleArea.TextRotationAngle = 90
chart.PrimaryValueAxis.TitleArea.IsBold = True

# Set series colors and data labels
for cs in chart.Series:
    cs.Format.Options.IsVaryColor = True
    cs.DataPoints.DefaultDataPoint.DataLabels.HasValue = True

# Set legend position
chart.Legend.Position = LegendPositionType.Top

# Save the document
workbook.SaveToFile("StackedLineChart.xlsx", ExcelVersion.Version2016)
workbook.Dispose()
Apply for a Temporary License
If you'd like to remove the evaluation message from the generated documents, or to get rid of the function limitations, please request a 30-day trial license for yourself.
Editing an Excel document involves a variety of actions, such as inputting and formatting text, applying formulas, generating visualizations, and organizing data for clarity and insight. Being able to edit Excel documents programmatically is a crucial skill that empowers developers to enhance their data management capabilities.
In this article, you will learn how to edit an existing Excel document in Python using Spire.XLS for Python.
- Read and Write Excel Files in Python
- Apply Formatting to Excel Cells in Python
- Find and Replace Text in Excel in Python
- Add Formulas and Charts to Excel in Python
Install Spire.XLS for Python
This scenario requires Spire.XLS for Python and plum-dispatch v1.7.4. They can be easily installed in your Windows through the following pip command.
pip install Spire.XLS
If you are unsure how to install, please refer to this tutorial: How to Install Spire.XLS for Python on Windows
Read and Write Excel Files in Python
A key task when handling Excel files in Python is the efficient reading and writing of data, which is essential for numerous applications such as data analysis and report generation. Spire.XLS for Python simplifies this process by offering the CellRange.Value property. This feature allows developers to easily retrieve values from individual cells and reassign them as needed.
Here are the steps to read and write an Excel file using Python:
- Create a Workbook object.
- Load an Excel file from a given file path.
- Get a specific worksheet using the Workbook.Worksheets[index] property.
- Get a specific cell using the Worksheet.Range property
- Get or set the cell value using the CellRange.Value property.
- Save the workbook to a different Excel file.
- Python
from spire.xls import *
from spire.xls.common import *
# Create a Workbook object
workbook = Workbook()
# Load an Excel file
workbook.LoadFromFile("C:\\Users\\Administrator\\Desktop\\Input.xlsx")
# Get a specific worksheet
worksheet = workbook.Worksheets[0]
# Get a specific cell
cell = worksheet.Range["A1"]
# Read the cell value
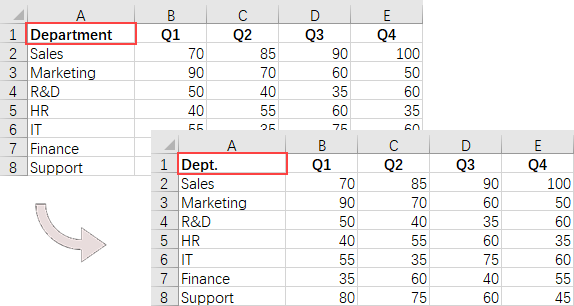
cellValue = cell.Value
# Determine if the cell value is "Department"
if (cellValue == "Department"):
# Update the cell value
cell.Value = "Dept."
# Save the workbook to a different
workbook.SaveToFile("ModifyExcel.xlsx", ExcelVersion.Version2016)
# Dispose resources
workbook.Dispose()
Apply Formatting to Excel Cells in Python
Formatting Excel documents is essential for producing professional-looking reports that effectively communicate information. Spire.XLS for Python offers a comprehensive suite of APIs within the CellRange class, empowering developers to manage various formatting options seamlessly. This includes adjusting font styles, selecting cell colors, aligning text, and modifying row heights and column widths.
Here are the steps to apply styles and formats to Excel cells using Python:
- Create a Workbook object.
- Load an Excel file from a given file path.
- Get a specific worksheet using the Workbook.Worksheets[index] property.
- Get all located range using the Worksheet.AllocatedRange property.
- Get a specific row using the CellRange.Rows[index] property, and set the cell color, text color, text alignment, and row height using the properties under the CellRange object.
- Get a specific column using the CellRange.Columns[index] property, and set the column width using the ColumnWidth property under the CellRange object.
- Save the workbook to a different Excel file.
- Python
from spire.xls import *
from spire.xls.common import *

# Create a Workbook object
workbook = Workbook()

# Load an Excel file
workbook.LoadFromFile("C:\\Users\\Administrator\\Desktop\\Input.xlsx")

# Get a specific worksheet
worksheet = workbook.Worksheets[0]

# Get all located range from the worksheet
allocatedRange = worksheet.AllocatedRange

#Iterate through the rows
for rowNum in range(0, allocatedRange.RowCount):
    if rowNum == 0:

        # Apply cell color to the header row
        allocatedRange.Rows[rowNum].Style.Color = Color.get_Black()

        # Change the font color of the header row
        allocatedRange.Rows[rowNum].Style.Font.Color = Color.get_White()
    else:
        # Apply alternate colors to other rows
        if rowNum % 2 == 1:
            allocatedRange.Rows[rowNum].Style.Color = Color.get_LightGray()
        else:
            allocatedRange.Rows[rowNum].Style.Color = Color.get_White()

    # Align text to center
    allocatedRange.Rows[rowNum].HorizontalAlignment = HorizontalAlignType.Center
    allocatedRange.Rows[rowNum].VerticalAlignment = VerticalAlignType.Center

    # Set the row height
    allocatedRange.Rows[rowNum].RowHeight = 20

# Iterate through the columns
for columnNum in range(0, allocatedRange.ColumnCount):
    if (columnNum > 0):

        # Set the column width
        allocatedRange.Columns[columnNum].ColumnWidth = 10

# Save the workbook to a different
workbook.SaveToFile("FormatExcel.xlsx", ExcelVersion.Version2016)

# Dispose resources
workbook.Dispose()

Find and Replace Text in Excel in Python
The find and replace functionality in Excel enables users to swiftly locate specific text within their spreadsheets and substitute it with new content, which is particularly useful for data corrections and updates. With Spire.XLS for Python, you can efficiently locate a cell containing a specific string using the Worksheet.FindString() method. Once identified, you can easily replace its value using the CellRange.Value property.
Here are the steps to find and replace text in Excel using Python:
- Create a Workbook object.
- Load an Excel file from a given file path.
- Get a specific worksheet using the Workbook.Worksheets[index] property.
- Find the cell that contains a specified string using the Worksheet.FindString() method.
- Update the cell value using the CellRange.Value property.
- Save the workbook to a different Excel file.
- Python
from spire.xls import *
from spire.xls.common import *

# Create a Workbook object
workbook = Workbook()

# Load an Excel file
workbook.LoadFromFile("C:\\Users\\Administrator\\Desktop\\Input.xlsx")

# Get a specific worksheet
worksheet = workbook.Worksheets[0]

# Define a list of department names for replacement
departments = ["Sales", "Marketing", "R&D", "HR", "IT", "Finance", "Support"]

# Define a list of placeholders that will be replaced in the Excel sheet
placeholders = ["#dept_one", "#dept_two", "#dept_three", "#dept_four", "#dept_five", "#dept_six", "#dept_seven"]

# Iterate through the placeholder strings
for i in range (0, len(placeholders)):

    # Find the cell containing the current placeholder string
    cell = worksheet.FindString(placeholders[i], False, False)

    # Replace the value in the found cell with the corresponding department name
    cell.Value = departments[i]


# Save the workbook to a different
workbook.SaveToFile("ReplaceText.xlsx", ExcelVersion.Version2016)

# Dispose resources
workbook.Dispose()
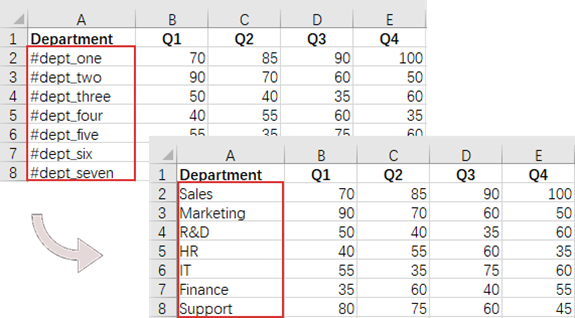
Add Formulas and Charts to Excel in Python
In addition to basic file operations, Spire.XLS for Python provides a variety of advanced techniques for working with Excel files. For example, you can insert formulas into cells using the CellRange.Formula property, which allows for real-time calculations and data analysis directly within your spreadsheet. Furthermore, it allows you to create visually appealing data presentations by adding charts to your worksheets using the Worksheet.Charts.Add() method.
Here are the steps to add formulas and charts to Excel using Python:
- Create a Workbook object.
- Load an Excel file from a given file path.
- Get a specific worksheet using the Workbook.Worksheets[index] property.
- Get a specific cell using the Worksheet.Range property.
- Add a formula to the cell using the CellRange.Formula property.
- Add a column chart to the worksheet using the Worksheet.Charts.Add() method.
- Set the chart data range, position, title and other attributes using the properties under the Chart object.
- Save the workbook to a different Excel file.
- Python
from spire.xls import *
from spire.xls.common import *

# Create a Workbook object
workbook = Workbook()

# Load an Excel file
workbook.LoadFromFile("C:\\Users\\Administrator\\Desktop\\Input.xlsx")

# Get a specific worksheet
worksheet = workbook.Worksheets[0]

# Get all located range
allocatedRange = worksheet.AllocatedRange

#Iterate through the rows
for rowNum in range(0, allocatedRange.RowCount):
    if (rowNum == 0):

        # Write text to cell G1
        worksheet.Range[rowNum + 1, 6].Text = "Total"

        # Apply style to the cell
        worksheet.Range[rowNum + 1, 6].Style.Font.IsBold = True
        worksheet.Range[rowNum + 1, 6].Style.HorizontalAlignment = HorizontalAlignType.Right
    else:

        # Add formulas to the cells from G2 to G8
        worksheet.Range[rowNum + 1, 6].Formula = f"=SUM(B{rowNum + 1}:E{rowNum + 1})"

# Add a clustered column chart
chart = worksheet.Charts.Add(ExcelChartType.ColumnClustered)

# Set data range for the chart
chart.DataRange = worksheet.Range["A1:E8"]
chart.SeriesDataFromRange = False

# Set position of the chart
chart.LeftColumn = 1
chart.TopRow = 10
chart.RightColumn = 8
chart.BottomRow = 23

# Set and format chart title
chart.ChartTitle = "Sales by Department per Quarter"
chart.ChartTitleArea.Size = 13
chart.ChartTitleArea.IsBold = True

# Save the workbook to a different
workbook.SaveToFile("AddFormulaAndChart.xlsx", ExcelVersion.Version2016)

# Dispose resources
workbook.Dispose()
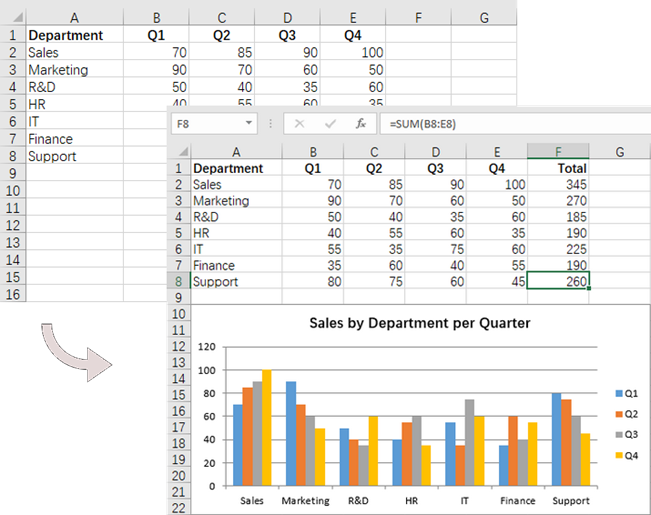
Apply for a Temporary License
If you'd like to remove the evaluation message from the generated documents, or to get rid of the function limitations, please request a 30-day trial license for yourself.
