A pivot table (PivotTable) is a core tool in Excel for quickly summarizing and analyzing large amounts of data. By dragging and dropping fields, you can easily perform data statistics and comparisons. Spire.XLS for JavaScript is based on WebAssembly and can create, filter, and update pivot tables directly in the browser. It manages input and output files through a virtual file system (VFS), so no backend services are required.
This article covers three core features:
For installation and project configuration, please refer to How to Integrate Spire.XLS for JavaScript in a React Project. The examples below assume that Spire.XLS is installed and the WebAssembly module has been initialized.
Create a Pivot Table
Creating a pivot table usually involves four steps: preparing the source data, adding a pivot table, laying out the fields, and calculating the data. The following example writes a product sales record into the first worksheet, creates a cache based on the data range using the PivotCaches.Add method, adds a pivot table to the worksheet using the PivotTables.Add method, and finally drags fields into the row area and the data area to complete the layout.
function App() {
  const createPivotTable = async () => {
    // Get the Spire.XLS WASM module
    const xlsModule = window.wasmModule?.spirexls;

    // Check if the module is ready
    if (!xlsModule) {
      alert('Spire.Xls is not ready yet');
      return;
    }

    // Load the font into the VFS
    await window.spire.FetchFileToVFS('ARIAL.TTF', '/Library/Fonts/', `${process.env.PUBLIC_URL}/font/`);

    // Create a new workbook
    const workbook = new xlsModule.Workbook();

    // Get the first worksheet
    const sheet = workbook.Worksheets.get(0);

    // Write source data to cells
    sheet.Range.get('A1').Value = 'Product';
    sheet.Range.get('B1').Value = 'Month';
    sheet.Range.get('C1').Value = 'Count';

    sheet.Range.get('A2').Value = 'SpireDoc';
    sheet.Range.get('A3').Value = 'SpireDoc';
    sheet.Range.get('A4').Value = 'SpireXls';
    sheet.Range.get('A5').Value = 'SpireDoc';
    sheet.Range.get('A6').Value = 'SpireXls';
    sheet.Range.get('A7').Value = 'SpireXls';

    sheet.Range.get('B2').Value = 'January';
    sheet.Range.get('B3').Value = 'February';
    sheet.Range.get('B4').Value = 'January';
    sheet.Range.get('B5').Value = 'January';
    sheet.Range.get('B6').Value = 'February';
    sheet.Range.get('B7').Value = 'February';

    sheet.Range.get('C2').Value = '10';
    sheet.Range.get('C3').Value = '15';
    sheet.Range.get('C4').Value = '9';
    sheet.Range.get('C5').Value = '7';
    sheet.Range.get('C6').Value = '8';
    sheet.Range.get('C7').Value = '10';

    // Create a pivot table cache based on the data range
    const dataRange = sheet.Range.get('A1:C7');
    const cache = workbook.PivotCaches.Add({ range: dataRange });

    // Add a pivot table
    const pt = sheet.PivotTables.Add('Pivot Table', sheet.Range.get({ row: 10, column: 5 }), cache);

    // Drag fields into the row area
    const pf1 = pt.PivotFields.get_Item('Product');
    pf1.Axis = xlsModule.AxisTypes.Row;
    const pf2 = pt.PivotFields.get_Item('Month');
    pf2.Axis = xlsModule.AxisTypes.Row;

    // Drag fields into the data area
    pt.DataFields.Add(pt.PivotFields.get_Item('Count'), 'Sum of Count', xlsModule.SubtotalTypes.Sum);

    // Set the pivot table style
    pt.BuiltInStyle = xlsModule.PivotBuiltInStyles.PivotStyleMedium12;

    // Calculate the pivot table data
    pt.CalculateData();
    sheet.AutoFitColumn(5);
    sheet.AutoFitColumn(6);

    // Save the workbook
    const outputFileName = 'CreatePivotTable_output.xlsx';
    workbook.SaveToFile({ fileName: outputFileName, version: xlsModule.ExcelVersion.Version2010 });

    // Release resources
    workbook.Dispose();

    // Read the generated file from the VFS and trigger the download
    const fileArray = window.dotnetRuntime.Module.FS.readFile(outputFileName);
    const blob = new Blob([fileArray], { type: 'application/vnd.openxmlformats-officedocument.spreadsheetml.sheet' });
    const url = URL.createObjectURL(blob);
    const a = document.createElement('a');
    a.href = url;
    a.download = outputFileName;
    a.click();
    URL.revokeObjectURL(url);
  };

  return (
    <div style={{ textAlign: 'center', height: '300px' }}>
      <h1>Create Pivot Table</h1>
      <button onClick={createPivotTable}>Start</button>
    </div>
  );
}

export default App;
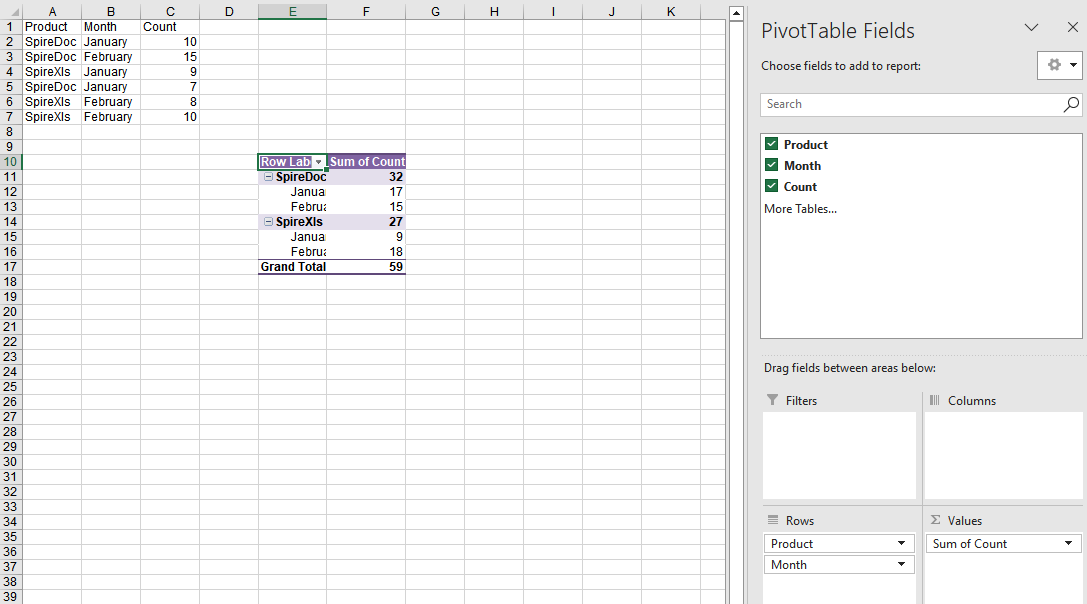
After calculating with the CalculateData method, the pivot table summarizes the total count of each product by product and month, displayed with the set PivotStyleMedium12 style.
Filter a Pivot Table
When a pivot table contains a lot of data, you can add filters to the row fields to keep only the data rows that meet the conditions.
function App() {
  const filterPivotTable = async () => {
    // Get the Spire.XLS WASM module
    const xlsModule = window.wasmModule?.spirexls;

    // Check if the module is ready
    if (!xlsModule) {
      alert('Spire.Xls is not ready yet');
      return;
    }

    // Load the font and the Excel file into the VFS
    await window.spire.FetchFileToVFS('ARIAL.TTF', '/Library/Fonts/', `${process.env.PUBLIC_URL}/font/`);
    const inputFileName = 'PivotTableExample.xlsx';
    await window.spire.FetchFileToVFS(inputFileName, '', `${process.env.PUBLIC_URL}data/`);

    // Load the workbook
    const workbook = new xlsModule.Workbook();
    workbook.LoadFromFile({ fileName: inputFileName, version: xlsModule.ExcelVersion.Version2010 });

    // Get the first pivot table in the second worksheet (PivotTable)
    const pt = workbook.Worksheets.get(1).PivotTables.get(0);

    // Get the first row field of the pivot table
    const rowField = pt.RowFields.get(0);

    // Add a value filter to the row field: values of the first data field less than 5300000
    rowField.AddValueFilter(xlsModule.PivotValueFilterType.LessThan, pt.DataFields.get(0), window.spire.Double.Create(5300000), new window.spire.SpireObject(0));

    // Recalculate the pivot table data
    pt.CalculateData();

    // Save the workbook
    const outputFileName = 'FilterPivotTable_output.xlsx';
    workbook.SaveToFile({ fileName: outputFileName, version: xlsModule.ExcelVersion.Version2010 });

    // Release resources
    workbook.Dispose();

    // Read the generated file from the VFS and trigger the download
    const fileArray = window.dotnetRuntime.Module.FS.readFile(outputFileName);
    const blob = new Blob([fileArray], { type: 'application/vnd.openxmlformats-officedocument.spreadsheetml.sheet' });
    const url = URL.createObjectURL(blob);
    const a = document.createElement('a');
    a.href = url;
    a.download = outputFileName;
    a.click();
    URL.revokeObjectURL(url);
  };

  return (
    <div style={{ textAlign: 'center', height: '300px' }}>
      <h1>Filter Pivot Table</h1>
      <button onClick={filterPivotTable}>Start</button>
    </div>
  );
}

export default App;
Original pivot table data 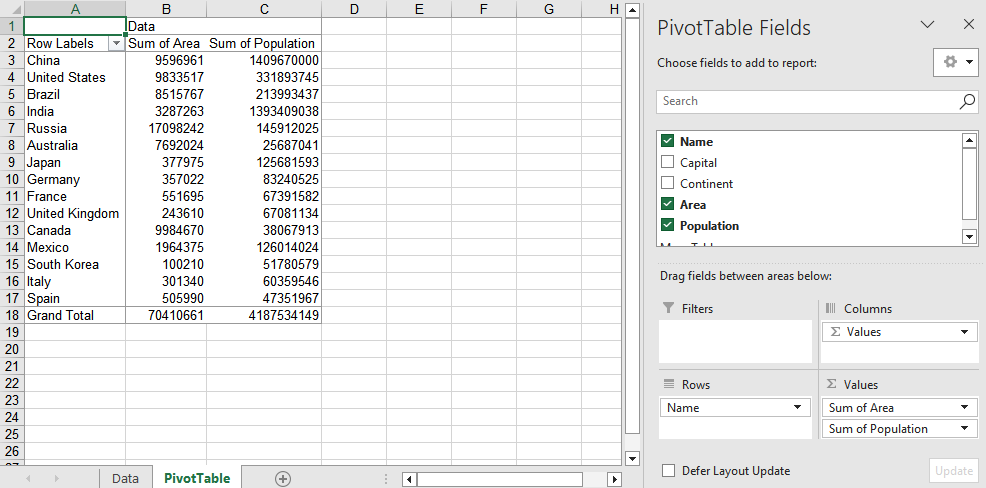
After filtering, the row area of the pivot table keeps only the data that meets the filter conditions, making it easy to focus on analyzing data in a specific range. 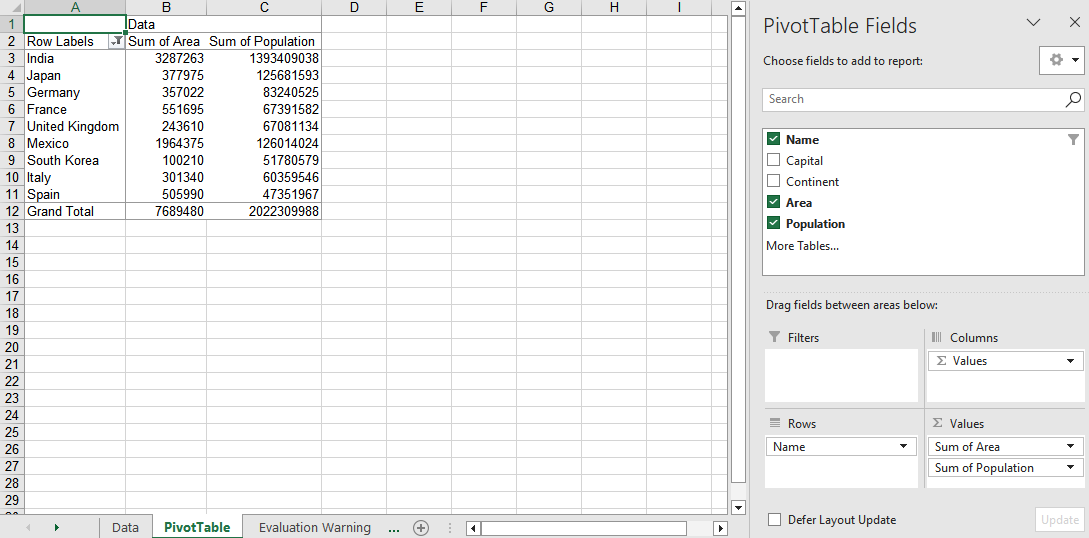
Update the Data Source and Refresh the Pivot Table
When the underlying data of a pivot table changes, you need to update the data source and refresh the pivot table cache so that the pivot table reflects the latest summary results.
function App() {
  const updateDataSource = async () => {
    // Get the Spire.XLS WASM module
    const xlsModule = window.wasmModule?.spirexls;

    // Check if the module is ready
    if (!xlsModule) {
      alert('Spire.Xls is not ready yet');
      return;
    }

    // Load the font and the Excel file into the VFS
    await window.spire.FetchFileToVFS('ARIAL.TTF', '/Library/Fonts/', `${process.env.PUBLIC_URL}/font/`);
    const inputFileName = 'PivotTableExample.xlsx';
    await window.spire.FetchFileToVFS(inputFileName, '', `${process.env.PUBLIC_URL}data/`);

    // Load the workbook
    const workbook = new xlsModule.Workbook();
    workbook.LoadFromFile({ fileName: inputFileName, version: xlsModule.ExcelVersion.Version2010 });

    // Get the data source worksheet and modify the cell values in it
    const data = workbook.Worksheets.get('Data');
    data.Range.get('A2').Text = 'NewValue';
    data.Range.get('D2').NumberValue = 28000;

    // Get the worksheet that contains the pivot table
    const sheet = workbook.Worksheets.get({ sheetName: 'PivotTable' });

    // Get the first pivot table on the worksheet
    const pt = sheet.PivotTables.get(0);

    // Refresh the pivot table cache
    pt.Cache.IsRefreshOnLoad = true;

    // Calculate and update the pivot table data
    pt.CalculateData();

    // Save the workbook
    const outputFileName = 'UpdateDataSource_output.xlsx';
    workbook.SaveToFile({ fileName: outputFileName, version: xlsModule.ExcelVersion.Version2010 });

    // Release resources
    workbook.Dispose();

    // Read the generated file from the VFS and trigger the download
    const fileArray = window.dotnetRuntime.Module.FS.readFile(outputFileName);
    const blob = new Blob([fileArray], { type: 'application/vnd.openxmlformats-officedocument.spreadsheetml.sheet' });
    const url = URL.createObjectURL(blob);
    const a = document.createElement('a');
    a.href = url;
    a.download = outputFileName;
    a.click();
    URL.revokeObjectURL(url);
  };

  return (
    <div style={{ textAlign: 'center', height: '300px' }}>
      <h1>Update Pivot Table Data Source</h1>
      <button onClick={updateDataSource}>Start</button>
    </div>
  );
}

export default App;
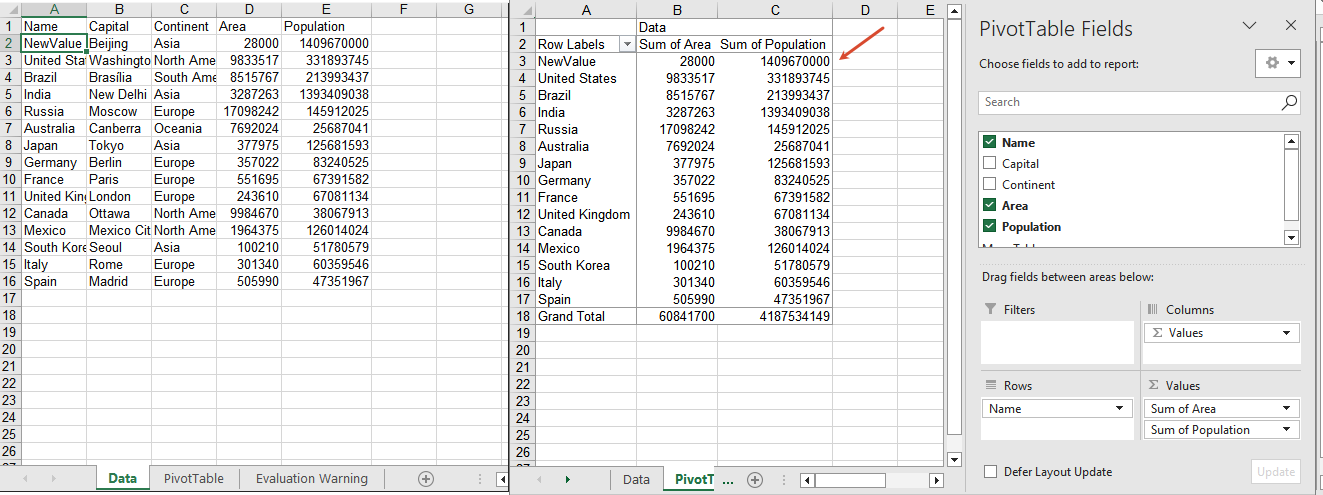
After the data source is updated and refreshed, the corresponding summary results in the pivot table are updated synchronously.
Frequently Asked Questions
No summary data is displayed after creating a pivot table
Cause: The CalculateData method is not called after adding fields to the pivot table, or the data fields are not correctly added to the data area.
Solution: Call pt.CalculateData() to recalculate the pivot table after completing the field layout, and make sure the numeric fields are added to the data area through the DataFields.Add method.
The pivot table data does not change after adding a filter
Cause: The CalculateData method is not called to recalculate after adding a label or value filter, or the filter is added to the wrong field.
Solution: Call pt.CalculateData() to recalculate the pivot table, and confirm that you use a property such as pt.RowFields.get(0) to get the correct field before adding the filter.
The pivot table data does not change after updating the data source
Cause: The pivot table cache is not refreshed after modifying the data source, so the pivot table still retains the old data.
Solution: After modifying the data source, set pt.Cache.IsRefreshOnLoad to true and call pt.CalculateData(), so that the pivot table is recalculated based on the latest data source.
Get a Free License
If you want to remove the evaluation message from the result document or get rid of the feature limitations, please contact sales to get a 30-day temporary license.
