Highlight Duplicate, Average and Ranked Values in Excel in React
Spotting the order numbers that were entered twice, the ratings that sit below the average, or the handful of largest and smallest orders in a table of several hundred rows is slow work by eye, and easy to get wrong. Conditional formatting hands that judgement to Excel: once a rule is written, the matching cells carry the color themselves, and the marks follow the data when it changes. This article covers the three most common kinds of rule — whether a value repeats, how it compares with the average, and where it ranks. Spire.XLS for JavaScript runs all of this in the browser on WebAssembly, managing input and output files through a virtual file system (VFS) with no backend service required.
This article covers three features:
- Highlight duplicate and unique values
- Highlight values above or below average
- Highlight top or bottom ranked values
For installation and project setup, see Integrating Spire.XLS for JavaScript in a React Project. The examples below assume Spire.XLS is installed and the WebAssembly module has been initialized.
Highlight duplicate and unique values
A conditional formatting rule hangs off a conditional format set: sheet.ConditionalFormats.Add() returns one set, you point it at the cells it applies to, and then add a single condition whose color you set. Duplicate and unique values are two sides of the same comparison — the first matches cells whose value appears more than once in the range, the second matches cells that appear exactly once — so they are usually written as a pair that brings both the repeated order numbers and the one-off ones into view. The steps are:
- Load the font and the test data file into the VFS.
- Load the workbook and get the worksheet.
- Add a conditional format set with
sheet.ConditionalFormats.Add()and point it at the order number column withAddRange. - Add a condition with
AddCondition, set itsFormatTypetoDuplicateValues, and set the fill color. - Add a second set on the same range in the same way, switch the type to
UniqueValues, set another fill color, and save the workbook.
The full code sample below shows how to highlight duplicate and unique values in React:
function App() {
  const highlightDuplicateValues = async () => {
    // Get the Spire.XLS WASM module
    const xlsModule = window.wasmModule?.spirexls;

    // Check whether the module is ready
    if (!xlsModule) {
      alert('Spire.Xls is not ready yet');
      return;
    }

    // Load the font and the test data file into the VFS
    await window.spire.FetchFileToVFS('ARIAL.TTF', '/Library/Fonts/', `${process.env.PUBLIC_URL}/font/`);
    const inputFileName = 'ConditionalFormatData.xlsx';
    await window.spire.FetchFileToVFS(inputFileName, '', `${process.env.PUBLIC_URL}data/`);

    // Load the workbook and take the first worksheet
    const workbook = new xlsModule.Workbook();
    workbook.LoadFromFile({ fileName: inputFileName });
    const sheet = workbook.Worksheets.get(0);

    // Add one conditional format set, applied to the order number column
    const duplicateFormats = sheet.ConditionalFormats.Add();
    duplicateFormats.AddRange(sheet.Range.get("C2:C10"));

    // Add a duplicate-value condition, filling order numbers that appear more than once in IndianRed
    const duplicateCondition = duplicateFormats.AddCondition();
    duplicateCondition.FormatType = xlsModule.ConditionalFormatType.DuplicateValues;
    duplicateCondition.BackColor = xlsModule.Color.get_IndianRed();

    // Add another conditional format set, applied to the same range
    const uniqueFormats = sheet.ConditionalFormats.Add();
    uniqueFormats.AddRange(sheet.Range.get("C2:C10"));

    // Add a unique-value condition, filling order numbers that appear once in Yellow
    const uniqueCondition = uniqueFormats.AddCondition();
    uniqueCondition.FormatType = xlsModule.ConditionalFormatType.UniqueValues;
    uniqueCondition.BackColor = xlsModule.Color.get_Yellow();

    // Save the workbook
    const outputFileName = "HighlightDuplicateValues.xlsx";
    workbook.SaveToFile({ fileName: outputFileName });

    // Dispose of the workbook object to free resources
    workbook.Dispose();

    // Read the result file from the VFS and trigger the download
    const fileArray = window.dotnetRuntime.Module.FS.readFile(outputFileName);
    const blob = new Blob([fileArray], { type: 'application/vnd.openxmlformats-officedocument.spreadsheetml.sheet' });
    const url = URL.createObjectURL(blob);
    const a = document.createElement('a');
    a.href = url;
    a.download = outputFileName;
    a.click();
    URL.revokeObjectURL(url);
  };

  return (
    <div style={{ textAlign: 'center', height: '300px' }}>
      <h1>Highlight Duplicate and Unique Values</h1>
      <button onClick={highlightDuplicateValues}>Start</button>
    </div>
  );
}

export default App;
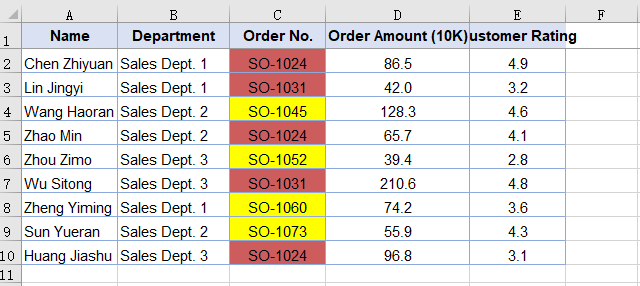
After running, the effect of highlighting duplicate and unique values:
Highlight values above or below average
The average is the yardstick most people reach for when judging a set of numbers. Conditional formatting has a condition built for exactly that comparison: call AddAverageCondition for the above-average or the below-average case, and Excel works out the average of the range itself, then compares each cell against it — one color above the line, another below. Excel computes the average when the file is opened, so editing the data reshuffles the marks along with it. The steps are:
- Load the font and the test data file into the VFS.
- Load the workbook and get the worksheet.
- Add a conditional format set with
sheet.ConditionalFormats.Add()and point it at the customer rating column withAddRange. - Call
AddAverageConditionwithAverageType.Belowand set the fill color. - Add a second set on the same range in the same way, pass
AverageType.Aboveinstead, set another fill color, and save the workbook.
The full code sample below shows how to highlight values above or below average in React:
function App() {
  const highlightAverageValues = async () => {
    // Get the Spire.XLS WASM module
    const xlsModule = window.wasmModule?.spirexls;

    // Check whether the module is ready
    if (!xlsModule) {
      alert('Spire.Xls is not ready yet');
      return;
    }

    // Load the font and the test data file into the VFS
    await window.spire.FetchFileToVFS('ARIAL.TTF', '/Library/Fonts/', `${process.env.PUBLIC_URL}/font/`);
    const inputFileName = 'ConditionalFormatData.xlsx';
    await window.spire.FetchFileToVFS(inputFileName, '', `${process.env.PUBLIC_URL}data/`);

    // Load the workbook and take the first worksheet
    const workbook = new xlsModule.Workbook();
    workbook.LoadFromFile({ fileName: inputFileName });
    const sheet = workbook.Worksheets.get(0);

    // Add one conditional format set, applied to the customer rating column
    const belowFormats = sheet.ConditionalFormats.Add();
    belowFormats.AddRange(sheet.Range.get("E2:E10"));

    // Add a below-average condition, filling with SkyBlue
    const belowCondition = belowFormats.AddAverageCondition(xlsModule.AverageType.Below);
    belowCondition.BackColor = xlsModule.Color.get_SkyBlue();

    // Add another conditional format set, applied to the same range
    const aboveFormats = sheet.ConditionalFormats.Add();
    aboveFormats.AddRange(sheet.Range.get("E2:E10"));

    // Add an above-average condition, filling with Orange
    const aboveCondition = aboveFormats.AddAverageCondition(xlsModule.AverageType.Above);
    aboveCondition.BackColor = xlsModule.Color.get_Orange();

    // Save the workbook
    const outputFileName = "HighlightAverageValues.xlsx";
    workbook.SaveToFile({ fileName: outputFileName });

    // Dispose of the workbook object to free resources
    workbook.Dispose();

    // Read the result file from the VFS and trigger the download
    const fileArray = window.dotnetRuntime.Module.FS.readFile(outputFileName);
    const blob = new Blob([fileArray], { type: 'application/vnd.openxmlformats-officedocument.spreadsheetml.sheet' });
    const url = URL.createObjectURL(blob);
    const a = document.createElement('a');
    a.href = url;
    a.download = outputFileName;
    a.click();
    URL.revokeObjectURL(url);
  };

  return (
    <div style={{ textAlign: 'center', height: '300px' }}>
      <h1>Highlight Above and Below Average Values</h1>
      <button onClick={highlightAverageValues}>Start</button>
    </div>
  );
}

export default App;
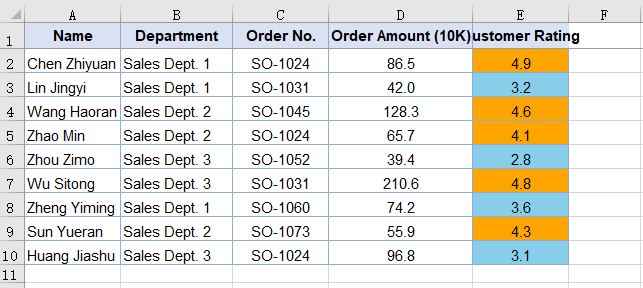
After running, the effect of highlighting values above or below average:
Highlight top or bottom ranked values
Leaderboard questions — which two orders are the largest, which three teams have the lowest completion rate — are hard to answer row by row, but a rank condition only needs the number of places. AddTopBottomCondition ranks the values inside the range you set and colors the cells that come out highest or lowest; it takes two arguments: one decides whether to take the highest or the lowest, the other is how many. The ranking stays inside that range and ignores everything else on the sheet. The steps are:
- Load the font and the test data file into the VFS.
- Load the workbook and get the worksheet.
- Add a conditional format set with
sheet.ConditionalFormats.Add()and point it at the order amount column withAddRange. - Call
AddTopBottomConditionwithTopBottomType.Topand a count of 2, then set the fill color. - Add a second set on the same range in the same way, pass
TopBottomType.Bottominstead, set another fill color, and save the workbook.
The full code sample below shows how to highlight top or bottom ranked values in React:
function App() {
  const highlightRankedValues = async () => {
    // Get the Spire.XLS WASM module
    const xlsModule = window.wasmModule?.spirexls;

    // Check whether the module is ready
    if (!xlsModule) {
      alert('Spire.Xls is not ready yet');
      return;
    }

    // Load the font and the test data file into the VFS
    await window.spire.FetchFileToVFS('ARIAL.TTF', '/Library/Fonts/', `${process.env.PUBLIC_URL}/font/`);
    const inputFileName = 'ConditionalFormatData.xlsx';
    await window.spire.FetchFileToVFS(inputFileName, '', `${process.env.PUBLIC_URL}data/`);

    // Load the workbook and take the first worksheet
    const workbook = new xlsModule.Workbook();
    workbook.LoadFromFile({ fileName: inputFileName });
    const sheet = workbook.Worksheets.get(0);

    // Add one conditional format set, applied to the order amount column
    const topFormats = sheet.ConditionalFormats.Add();
    topFormats.AddRange(sheet.Range.get("D2:D10"));

    // Add a top-2 condition, filling the two largest orders with Red
    const topCondition = topFormats.AddTopBottomCondition(xlsModule.TopBottomType.Top, 2);
    topCondition.FormatType = xlsModule.ConditionalFormatType.TopBottom;
    topCondition.BackColor = xlsModule.Color.get_Red();

    // Add another conditional format set, applied to the same range
    const bottomFormats = sheet.ConditionalFormats.Add();
    bottomFormats.AddRange(sheet.Range.get("D2:D10"));

    // Add a bottom-2 condition, filling the two smallest orders with ForestGreen
    const bottomCondition = bottomFormats.AddTopBottomCondition(xlsModule.TopBottomType.Bottom, 2);
    bottomCondition.FormatType = xlsModule.ConditionalFormatType.TopBottom;
    bottomCondition.BackColor = xlsModule.Color.get_ForestGreen();

    // Save the workbook
    const outputFileName = "HighlightRankedValues.xlsx";
    workbook.SaveToFile({ fileName: outputFileName });

    // Dispose of the workbook object to free resources
    workbook.Dispose();

    // Read the result file from the VFS and trigger the download
    const fileArray = window.dotnetRuntime.Module.FS.readFile(outputFileName);
    const blob = new Blob([fileArray], { type: 'application/vnd.openxmlformats-officedocument.spreadsheetml.sheet' });
    const url = URL.createObjectURL(blob);
    const a = document.createElement('a');
    a.href = url;
    a.download = outputFileName;
    a.click();
    URL.revokeObjectURL(url);
  };

  return (
    <div style={{ textAlign: 'center', height: '300px' }}>
      <h1>Highlight Top and Bottom Ranked Values</h1>
      <button onClick={highlightRankedValues}>Start</button>
    </div>
  );
}

export default App;
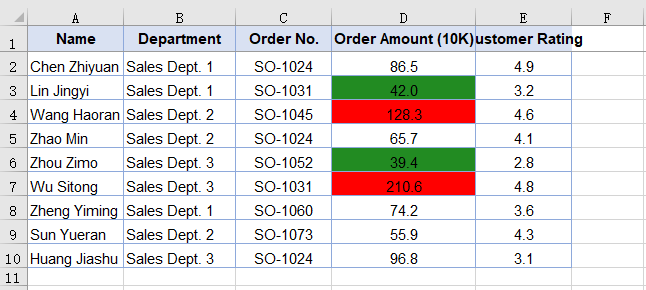
After running, the effect of highlighting top or bottom ranked values:
FAQ
Why is the color I set not showing up?
Cause: The color belongs on the condition object, which is what AddCondition, AddAverageCondition or AddTopBottomCondition returns. Assigning BackColor to the outer conditional format set instead is accepted and raises no error, but the rule that reaches the file carries no fill and the cells stay as they were.
Solution: Assign the color to the condition object — the return value of those methods:
// The condition object is what carries the color
const formats = sheet.ConditionalFormats.Add();
formats.AddRange(sheet.Range.get("C2:C10"));
const condition = formats.AddCondition();
condition.FormatType = xlsModule.ConditionalFormatType.DuplicateValues;
condition.BackColor = xlsModule.Color.get_IndianRed();
Why can't I read a conditional format's fill color back from the cell?
Cause: The color of a conditional format does not belong to the cell's own formatting. It is stored with the rule in the file's conditional formatting settings, and the cell keeps the style it already had, so the color read from the cell is the same before and after the rule is added.
Solution: Read the color from the condition object — the return value of AddCondition, AddAverageCondition or AddTopBottomCondition:
// The conditional format color lives on the condition object, not in the cell style
const formats = sheet.ConditionalFormats.Add();
formats.AddRange(sheet.Range.get("C2:C10"));
const condition = formats.AddCondition();
condition.FormatType = xlsModule.ConditionalFormatType.DuplicateValues;
condition.BackColor = xlsModule.Color.get_IndianRed();

// This reads back the color that was just set
console.log(condition.BackColor);
Get a Free License
Spire.XLS for JavaScript offers a 30-day full-featured free trial license with no functional limitations. Apply here to evaluate before purchasing.
Apply Color Scales & Icon Sets in Excel in React with JavaScript
In a sales report, a grade sheet, or a metrics dashboard, how values compare matters more than the values themselves. Inserting a chart for every column makes the worksheet crowded, while data bars, color scales, and icon sets show magnitude right inside the cells—through bar length, color intensity, and icon shape—without consuming extra rows or columns. All three belong to Excel conditional formatting, found under Home → Conditional Formatting in the Excel UI.Spire.XLS for JavaScript performs this work directly in the browser through WebAssembly, managing input and output files with a virtual file system (VFS) and requiring no backend service.
This article covers three key features:
For installation and project setup, see Integrating Spire.XLS for JavaScript in a React Project. The examples below assume Spire.XLS is already installed and the WebAssembly module has been initialized.
Apply Data Bars to a Cell Range
Data bars draw a horizontal colored band inside each cell, and the length of the band is proportional to how large the value is compared with the rest of the selected range. With Spire.XLS for JavaScript, ConditionalFormats.Add creates a conditional format collection, AddRange binds it to a range, and AddCondition returns the condition object; setting FormatType to ConditionalFormatType.DataBar produces data bars, whose fill color is controlled by DataBar.BarColor. The steps are as follows:
- Load the font and the test data file into the VFS.
- Load the workbook and get the worksheet.
- Call
ConditionalFormats.Addto create a conditional format, and bind the data range withAddRange. - Call
AddConditionto add a condition, setFormatTypetoDataBar, and set the bar color. - Save the workbook.
The complete code example below applies data bars to a sales figures table in React:
function App() {
  const applyDataBars = async () => {
    // Get the Spire.XLS WASM module
    const xlsModule = window.wasmModule?.spirexls;

    // Check whether the module is ready
    if (!xlsModule) {
      alert('Spire.Xls is not ready yet');
      return;
    }

    // Load the font and the test data file into the VFS
    await window.spire.FetchFileToVFS('ARIAL.TTF', '/Library/Fonts/', `${process.env.PUBLIC_URL}/font/`);
    const inputFileName = 'SalesData.xlsx';
    await window.spire.FetchFileToVFS(inputFileName, '', `${process.env.PUBLIC_URL}data/`);

    // Load the workbook and get the first worksheet
    const workbook = new xlsModule.Workbook();
    workbook.LoadFromFile({ fileName: inputFileName });
    const sheet = workbook.Worksheets.get(0);

    // Select the data range that receives the data bars
    const dataRange = sheet.Range.get("B2:E9");

    // Create a conditional format and bind it to that range
    const xcfs = sheet.ConditionalFormats.Add();
    xcfs.AddRange(dataRange);

    // Add a data bar condition and set the bar color
    const format = xcfs.AddCondition();
    format.FormatType = xlsModule.ConditionalFormatType.DataBar;
    format.DataBar.BarColor = xlsModule.Color.get_CadetBlue();

    // Save the workbook
    const outputFileName = "ApplyDataBars.xlsx";
    workbook.SaveToFile({ fileName: outputFileName, version: xlsModule.ExcelVersion.Version2010 });

    // Dispose of the workbook object to free resources
    workbook.Dispose();

    // Read the result file from the VFS and trigger the download
    const fileArray = window.dotnetRuntime.Module.FS.readFile(outputFileName);
    const blob = new Blob([fileArray], { type: 'application/vnd.openxmlformats-officedocument.spreadsheetml.sheet' });
    const url = URL.createObjectURL(blob);
    const a = document.createElement('a');
    a.href = url;
    a.download = outputFileName;
    a.click();
    URL.revokeObjectURL(url);
  };

  return (
    <div style={{ textAlign: 'center', height: '300px' }}>
      <h1>Apply Data Bars</h1>
      <button onClick={applyDataBars}>Start</button>
    </div>
  );
}

export default App;
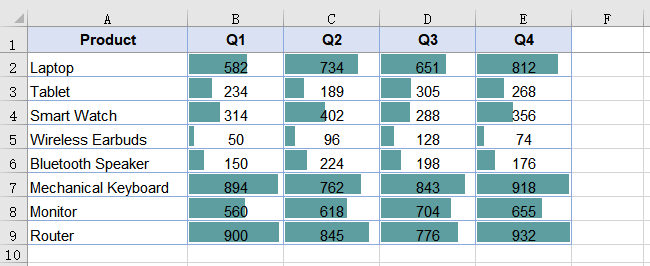
After running, the effect of applying data bars to a cell range:
Apply Color Scales to a Cell Range
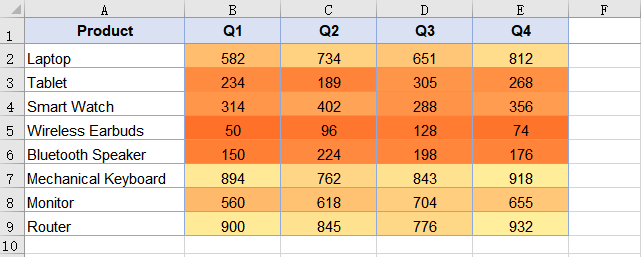
A color scale uses shading to express magnitude: the larger a cell's value is within the range, the closer its color sits to the high end of the scale. Color scales are added through the same ConditionalFormats API as data bars—the only difference is setting FormatType to ConditionalFormatType.ColorScale. No color arguments are required; when none are specified, the result is a two-color scale that takes orange at the range minimum and pale yellow at the maximum, with intermediate values shaded proportionally between the two. The steps are as follows:
- Load the font and the test data file into the VFS.
- Load the workbook and get the worksheet.
- Call
ConditionalFormats.Addto create a conditional format, and bind the data range withAddRange. - Call
AddConditionto add a condition, and setFormatTypetoColorScale. - Save the workbook.
The complete code example below applies color scales to a sales figures table in React:
function App() {
  const applyColorScales = async () => {
    // Get the Spire.XLS WASM module
    const xlsModule = window.wasmModule?.spirexls;

    // Check whether the module is ready
    if (!xlsModule) {
      alert('Spire.Xls is not ready yet');
      return;
    }

    // Load the font and the test data file into the VFS
    await window.spire.FetchFileToVFS('ARIAL.TTF', '/Library/Fonts/', `${process.env.PUBLIC_URL}/font/`);
    const inputFileName = 'SalesData.xlsx';
    await window.spire.FetchFileToVFS(inputFileName, '', `${process.env.PUBLIC_URL}data/`);

    // Load the workbook and get the first worksheet
    const workbook = new xlsModule.Workbook();
    workbook.LoadFromFile({ fileName: inputFileName });
    const sheet = workbook.Worksheets.get(0);

    // Select the data range that receives the color scales
    const dataRange = sheet.Range.get("B2:E9");

    // Create a conditional format and bind it to that range
    const xcfs = sheet.ConditionalFormats.Add();
    xcfs.AddRange(dataRange);

    // Add a color scale condition; colors transition with the values
    const format = xcfs.AddCondition();
    format.FormatType = xlsModule.ConditionalFormatType.ColorScale;

    // Save the workbook
    const outputFileName = "ApplyColorScales.xlsx";
    workbook.SaveToFile({ fileName: outputFileName, version: xlsModule.ExcelVersion.Version2010 });

    // Dispose of the workbook object to free resources
    workbook.Dispose();

    // Read the result file from the VFS and trigger the download
    const fileArray = window.dotnetRuntime.Module.FS.readFile(outputFileName);
    const blob = new Blob([fileArray], { type: 'application/vnd.openxmlformats-officedocument.spreadsheetml.sheet' });
    const url = URL.createObjectURL(blob);
    const a = document.createElement('a');
    a.href = url;
    a.download = outputFileName;
    a.click();
    URL.revokeObjectURL(url);
  };

  return (
    <div style={{ textAlign: 'center', height: '300px' }}>
      <h1>Apply Color Scales</h1>
      <button onClick={applyColorScales}>Start</button>
    </div>
  );
}

export default App;
After running, the effect of applying color scales to a cell range:
Apply Icon Sets to a Cell Range
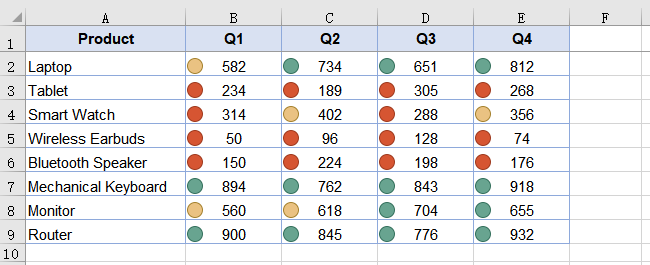
An icon set places a different icon in each cell according to the band its value falls into—for example, red, yellow, and green traffic lights for low, medium, and high. It uses the same API: set FormatType to ConditionalFormatType.IconSet and pick an icon style with IconSet.IconSetType; the example uses IconSetType.ThreeTrafficLights1. The steps are as follows:
- Load the font and the test data file into the VFS.
- Load the workbook and get the worksheet.
- Call
ConditionalFormats.Addto create a conditional format, and bind the data range withAddRange. - Call
AddConditionto add a condition, setFormatTypetoIconSet, and specify the icon set type. - Save the workbook.
The complete code example below applies icon sets to a sales figures table in React:
function App() {
  const applyIconSets = async () => {
    // Get the Spire.XLS WASM module
    const xlsModule = window.wasmModule?.spirexls;

    // Check whether the module is ready
    if (!xlsModule) {
      alert('Spire.Xls is not ready yet');
      return;
    }

    // Load the font and the test data file into the VFS
    await window.spire.FetchFileToVFS('ARIAL.TTF', '/Library/Fonts/', `${process.env.PUBLIC_URL}/font/`);
    const inputFileName = 'SalesData.xlsx';
    await window.spire.FetchFileToVFS(inputFileName, '', `${process.env.PUBLIC_URL}data/`);

    // Load the workbook and get the first worksheet
    const workbook = new xlsModule.Workbook();
    workbook.LoadFromFile({ fileName: inputFileName });
    const sheet = workbook.Worksheets.get(0);

    // Select the data range that receives the icon sets
    const dataRange = sheet.Range.get("B2:E9");

    // Create a conditional format and bind it to that range
    const xcfs = sheet.ConditionalFormats.Add();
    xcfs.AddRange(dataRange);

    // Add an icon set condition and set the icon style to three traffic lights
    const format = xcfs.AddCondition();
    format.FormatType = xlsModule.ConditionalFormatType.IconSet;
    format.IconSet.IconSetType = xlsModule.IconSetType.ThreeTrafficLights1;

    // Save the workbook
    const outputFileName = "ApplyIconSets.xlsx";
    workbook.SaveToFile({ fileName: outputFileName, version: xlsModule.ExcelVersion.Version2010 });

    // Dispose of the workbook object to free resources
    workbook.Dispose();

    // Read the result file from the VFS and trigger the download
    const fileArray = window.dotnetRuntime.Module.FS.readFile(outputFileName);
    const blob = new Blob([fileArray], { type: 'application/vnd.openxmlformats-officedocument.spreadsheetml.sheet' });
    const url = URL.createObjectURL(blob);
    const a = document.createElement('a');
    a.href = url;
    a.download = outputFileName;
    a.click();
    URL.revokeObjectURL(url);
  };

  return (
    <div style={{ textAlign: 'center', height: '300px' }}>
      <h1>Apply Icon Sets</h1>
      <button onClick={applyIconSets}>Start</button>
    </div>
  );
}

export default App;
An icon set divides the range into bands, so the same icon covers a different span of values in different ranges.
After running, the effect of applying icon sets to a cell range:
FAQ
Why do the text cells in the target range get no data bars?
Cause: A data bar expresses how large a value is relative to the rest of the range, so only numeric cells are shaded and text cells inside the range are skipped. Even when the range covers the product-name column or the header row, those cells show no bars—the result still covers the numeric area alone.
Solution: This is the expected behavior and needs no workaround; just keep the range limited to the numeric area. If the numeric area itself shows no bars either, check that the range passed to AddRange matches where the data actually is.
Can the color and border of a data bar be customized?
Cause: A data bar's appearance is controlled by the DataBar property of the condition object. The fill color comes from DataBar.BarColor; setting only FormatType without BarColor yields the default blue bars. Data bars have no border by default, so assigning BarBorder.Color on its own has no effect.
Solution: Set the border type through DataBar.BarBorder.Type first, then set the border color—the two go together:
// Set the border type first so that the border color takes effect
format.DataBar.BarBorder.Type = xlsModule.DataBarBorderType.DataBarBorderSolid;
format.DataBar.BarBorder.Color = xlsModule.Color.get_Red();

// Fill color of the bar
format.DataBar.BarColor = xlsModule.Color.get_GreenYellow();
Get a Free License
Spire.XLS for JavaScript offers a 30-day full-featured free trial license with no functional limitations. Apply here to evaluate before purchasing.
Apply Conditional Formatting to Excel with JavaScript in React
Conditional formatting is an important means to visually display data in Excel. It automatically applies colors, bars, and other visual effects to cells based on their values or dates, so that high and low values and key dates in a report are clear at a glance. Spire.XLS for JavaScript applies conditional formatting to cell ranges directly in the browser based on WebAssembly, managing input and output files through a virtual file system (VFS) without the need for backend services.
This article covers three core features:
- Apply Data Bars to a Cell Range
- Conditionally Format Dates
- Create a Formula-Based Conditional Format
For installation and project configuration, refer to How to Integrate Spire.XLS for JavaScript in a React Project. The examples below assume that Spire.XLS has been installed and the WebAssembly module has been initialized.
Apply Data Bars to a Cell Range
Data bars intuitively reflect the relative size of values through the length of the horizontal bars filled in cells — the larger the value, the longer the bar. Spire.XLS for JavaScript creates a conditional format collection with the ConditionalFormats.Add method, adds a data bar condition with AddCondition, and customizes the bar color with DataBar.BarColor.
function App() {
  const sheetToSVG = async () => {
    // Get the Spire.XLS WASM module
    const xlsModule = window.wasmModule?.spirexls;

    // Check if the module is ready
    if (!xlsModule) {
      alert('Spire.Xls is not ready yet');
      return;
    }

    // Load the font file into the VFS
    await window.spire.FetchFileToVFS('ARIAL.TTF', '/Library/Fonts/', `${process.env.PUBLIC_URL}/font/`);

    // Create a workbook
    const workbook = new xlsModule.Workbook();

    // Get the first worksheet
    const sheet = workbook.Worksheets.get(0);

    // Insert data into the cell range A1:C4
    sheet.Range.get("A1").NumberValue = 582;
    sheet.Range.get("A2").NumberValue = 234;
    sheet.Range.get("A3").NumberValue = 314;
    sheet.Range.get("A4").NumberValue = 50;
    sheet.Range.get("B1").NumberValue = 150;
    sheet.Range.get("B2").NumberValue = 894;
    sheet.Range.get("B3").NumberValue = 560;
    sheet.Range.get("B4").NumberValue = 900;
    sheet.Range.get("C1").NumberValue = 134;
    sheet.Range.get("C2").NumberValue = 700;
    sheet.Range.get("C3").NumberValue = 920;
    sheet.Range.get("C4").NumberValue = 450;
    sheet.AllocatedRange.RowHeight = 15;
    sheet.AllocatedRange.ColumnWidth = 17;

    // Add a conditional format and apply it to the data range
    const xcfs = sheet.ConditionalFormats.Add();
    xcfs.AddRange(sheet.AllocatedRange);

    // Add a data bar conditional format and set the bar color
    const format = xcfs.AddCondition();
    format.FormatType = xlsModule.ConditionalFormatType.DataBar;
    format.DataBar.BarColor = xlsModule.Color.get_CadetBlue();

    const outputFileName = 'ApplyDataBarsToCellRange_out.xlsx';
    workbook.SaveToFile({ fileName: outputFileName, version: xlsModule.ExcelVersion.Version2010 });

    // Dispose of the workbook object to free resources
    workbook.Dispose();

    // Read the converted file from the VFS and trigger the download
    const fileArray = window.dotnetRuntime.Module.FS.readFile(outputFileName);
    const blob = new Blob([fileArray], { type: "application/vnd.openxmlformats-officedocument.spreadsheetml.sheet" });
    const url = URL.createObjectURL(blob);
    const a = document.createElement('a');
    a.href = url;
    a.download = outputFileName;
    a.click();
    URL.revokeObjectURL(url);
  };

  return (
    <div style={{ textAlign: 'center', height: '300px' }}>
      <h1>Apply Data Bars to Cell Range</h1>
      <button onClick={sheetToSVG}>
        Start
      </button>
    </div>
  );
}

export default App;
Apply Data Bars to a Cell Range Effect 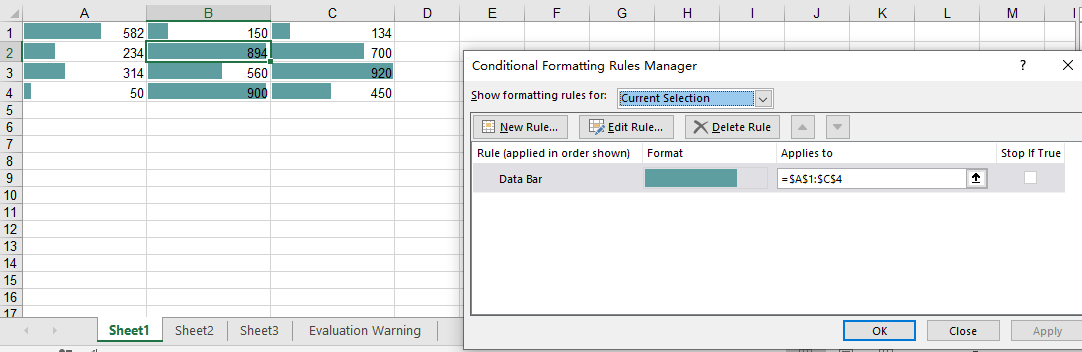
Conditionally Format Dates
In scenarios such as project management and sales reports, we often need to highlight dates within a recent period, for example records from the last 7 days. Spire.XLS for JavaScript adds a time-period-based date conditional format with the AddTimePeriodCondition method, and specifies the time range with the TimePeriodType enumeration.
function App() {
  const sheetToSVG = async () => {
    // Get the Spire.XLS WASM module
    const xlsModule = window.wasmModule?.spirexls;

    // Check if the module is ready
    if (!xlsModule) {
      alert('Spire.Xls is not ready yet');
      return;
    }

    // Load the font and Excel file into the VFS
    await window.spire.FetchFileToVFS('ARIAL.TTF', '/Library/Fonts/', `${process.env.PUBLIC_URL}/font/`);
    const inputFileName = 'ConditionallyFormatDate.xlsx';
    await window.spire.FetchFileToVFS(inputFileName, '', `${process.env.PUBLIC_URL}data/`);

    // Load the workbook
    const workbook = new xlsModule.Workbook();
    workbook.LoadFromFile({ fileName: inputFileName });

    // Get the first worksheet
    const sheet = workbook.Worksheets.get(0);

    // Add a conditional format and apply it to the data range
    const xcfs = sheet.ConditionalFormats.Add();
    xcfs.AddRange(sheet.AllocatedRange);

    // Highlight cells whose date falls within the last 7 days
    const conditionalFormat = xcfs.AddTimePeriodCondition(xlsModule.TimePeriodType.Last7Days);
    conditionalFormat.BackColor = xlsModule.Color.get_Orange();

    const outputFileName = 'ConditionallyFormatDate_out.xlsx';
    workbook.SaveToFile({ fileName: outputFileName, version: xlsModule.ExcelVersion.Version2010 });

    // Dispose of the workbook object to free resources
    workbook.Dispose();

    // Read the converted file from the VFS and trigger the download
    const fileArray = window.dotnetRuntime.Module.FS.readFile(outputFileName);
    const blob = new Blob([fileArray], { type: "application/vnd.openxmlformats-officedocument.spreadsheetml.sheet" });
    const url = URL.createObjectURL(blob);
    const a = document.createElement('a');
    a.href = url;
    a.download = outputFileName;
    a.click();
    URL.revokeObjectURL(url);
  };

  return (
    <div style={{ textAlign: 'center', height: '300px' }}>
      <h1>Conditionally Format Date</h1>
      <button onClick={sheetToSVG}>
        Start
      </button>
    </div>
  );
}

export default App;
Before Applying Date Conditional Formatting 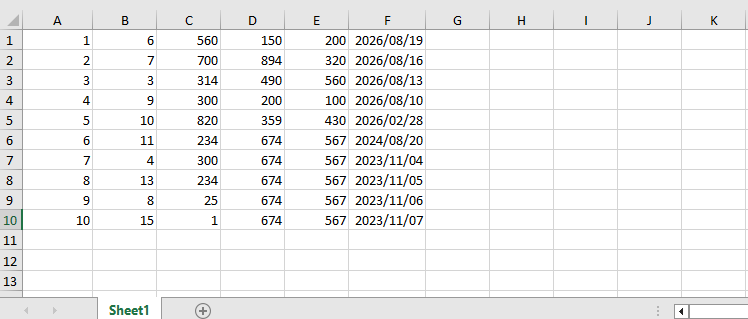 After Applying Date Conditional Formatting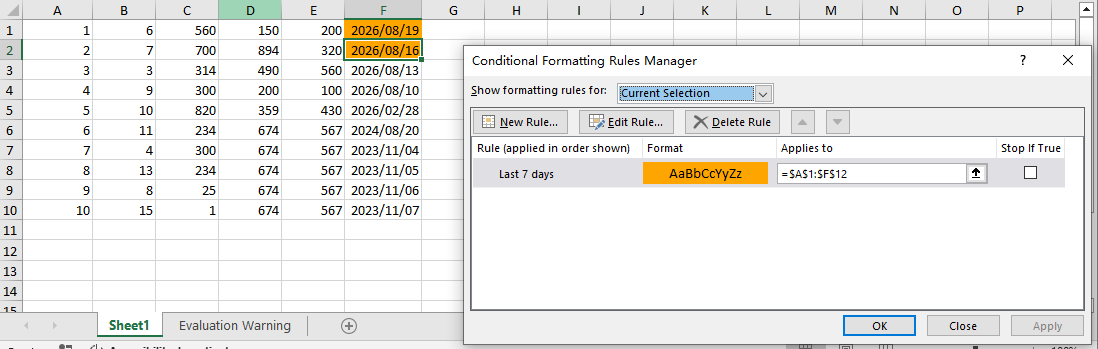
Create a Formula-Based Conditional Format
When the built-in conditional formats cannot meet your requirements, you can use a formula to define a custom judgment rule. Spire.XLS for JavaScript supports setting ConditionalFormatType to Formula and specifying the judgment formula with FirstFormula; cells that satisfy the formula will apply the configured background color.
function App() {
  const sheetToSVG = async () => {
    // Get the Spire.XLS WASM module
    const xlsModule = window.wasmModule?.spirexls;

    // Check if the module is ready
    if (!xlsModule) {
      alert('Spire.Xls is not ready yet');
      return;
    }

    // Load the font and Excel file into the VFS
    await window.spire.FetchFileToVFS('ARIAL.TTF', '/Library/Fonts/', `${process.env.PUBLIC_URL}/font/`);
    const inputFileName = 'ConditionallyFormatDate.xlsx';
    await window.spire.FetchFileToVFS(inputFileName, '', `${process.env.PUBLIC_URL}data/`);

    // Load the workbook
    const workbook = new xlsModule.Workbook();
    workbook.LoadFromFile({ fileName: inputFileName });

    // Get the first worksheet and its first column
    const sheet = workbook.Worksheets.get(0);
    const range = sheet.Columns.get(0);

    // Add a conditional format and apply it to the first column
    const xcfs = sheet.ConditionalFormats.Add();
    xcfs.AddRange(range);

    // Set the conditional format formula: apply the format when a cell in column A is less than the cell in column B of the same row
    const conditional = xcfs.AddCondition();
    conditional.FormatType = xlsModule.ConditionalFormatType.Formula;
    conditional.FirstFormula = "=($A1<$B1)";
    conditional.BackKnownColor = xlsModule.ExcelColors.Yellow;

    const outputFileName = 'CreateFormulaConditionalFormat_out.xlsx';
    workbook.SaveToFile({ fileName: outputFileName, version: xlsModule.ExcelVersion.Version2010 });

    // Dispose of the workbook object to free resources
    workbook.Dispose();

    // Read the converted file from the VFS and trigger the download
    const fileArray = window.dotnetRuntime.Module.FS.readFile(outputFileName);
    const blob = new Blob([fileArray], { type: "application/vnd.openxmlformats-officedocument.spreadsheetml.sheet" });
    const url = URL.createObjectURL(blob);
    const a = document.createElement('a');
    a.href = url;
    a.download = outputFileName;
    a.click();
    URL.revokeObjectURL(url);
  };

  return (
    <div style={{ textAlign: 'center', height: '300px' }}>
      <h1>Create Formula Conditional Format</h1>
      <button onClick={sheetToSVG}>
        Start
      </button>
    </div>
  );
}

export default App;
Apply Formula Conditional Formatting 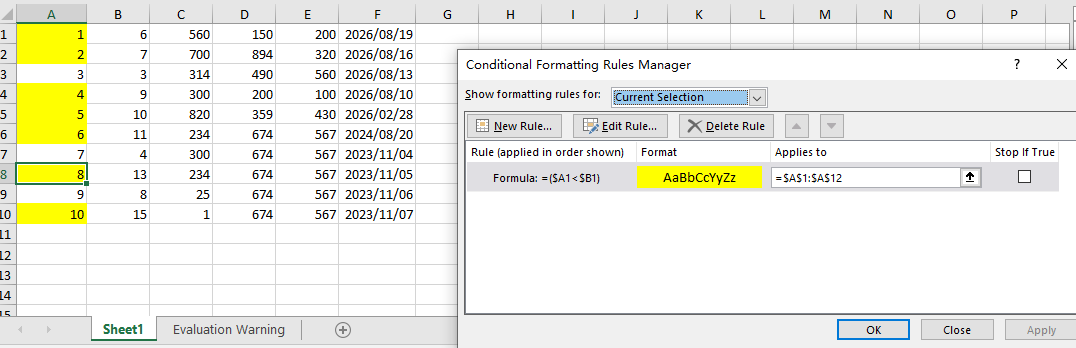
FAQ
Conditional formatting is not displayed when the file is opened in older versions of Excel
Cause: Conditional formats such as data bars, time periods, and formulas belong to the Excel 2007+ (XLSX) format capabilities. Saving with an older format may cause the conditional formatting to be lost or not displayed.
Solution: Explicitly specify the file version as Excel 2010 when saving, for example:
workbook.SaveToFile({
  fileName: 'output.xlsx',
  version: xlsModule.ExcelVersion.Version2010
});
The date conditional format has no effect
Cause: The date data in the target cells is actually stored as text or plain numbers rather than real date values, so the time-period-based judgment cannot match.
Solution: Make sure the dates in the worksheet are stored as dates, for example by writing date-type values directly when generating the data, instead of strings.
The formula conditional format references the wrong range
Cause: The relative references in the FirstFormula formula do not correspond to the cell range, so the judgment result does not match expectations.
Solution: Confirm that the row and column references in the formula are consistent with the selected range. For example, when applying =($A1<$B1) to the entire column A, the formula uses the first cell of the selected range as the reference starting point.
Get a Free License
If you want to remove the evaluation message from the result documents, or get rid of the function limitations, please contact sales to get a temporary license valid for 30 days.