Insert Pictures and Text Boxes in a Chart in React with JavaScript
A chart makes the data clear; it says nothing about whose brand it belongs to, or what the one-line conclusion is. The usual fix in a report is a logo in one corner of the chart plus a note such as "Online: 1,208K USD in total" in the empty space — putting the conclusion where the reader's eye already is instead of starting another paragraph of prose. In Excel these elements belong to the chart's own shape layer, positioned against the chart rather than against the cells, and that is where code that adds them most often goes wrong. The plot area's default white background is a separate matter again: it can be swapped for a light texture so that the chart and the rest of the report look like one piece. Spire.XLS for JavaScript does all of this in the browser on top of WebAssembly, managing input and output files through a virtual file system (VFS), with no backend service required.
This article covers three key features:
For installation and project setup, see Integrating Spire.XLS for JavaScript in a React Project. The examples below assume Spire.XLS is installed and the WebAssembly module has been initialised.
Insert a picture into a chart
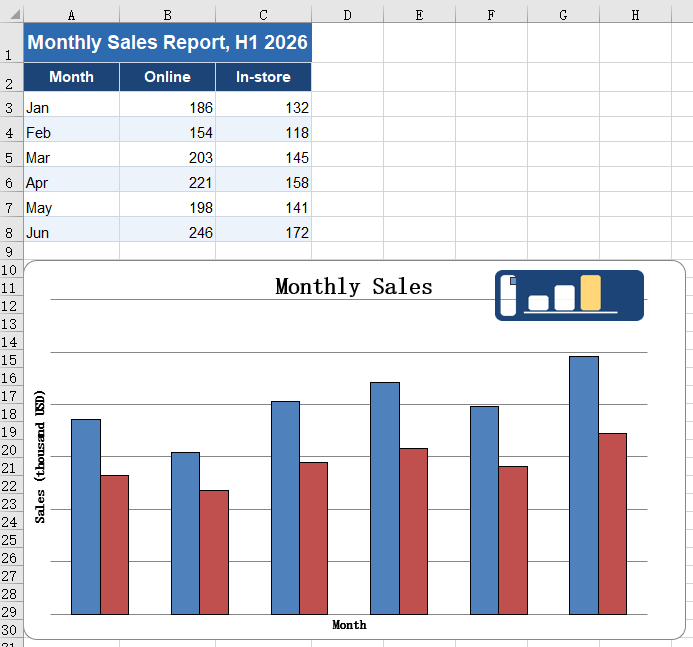
Charts in a report often need to carry a brand mark or a product shot. Once a picture is inside the chart it becomes part of it: move or resize the chart and the picture comes along, and copying the chart into another document or exporting it as an image keeps the picture too. A picture floating above the cells, by contrast, is out of alignment the moment the chart moves. The steps are:
- Load the font, the test data file and the picture into the VFS.
- Load the workbook with
workbook.LoadFromFileand take the first chart on the first worksheet. - Add the picture to the chart with
chart.Shapes.AddPicture; the value it returns is that shape. - Set the shape's
Left,Top,WidthandHeight. A shape inside a chart is measured against the chart itself: each of the four is in units of 1/4000 of the chart's width (Left,Width) or height (Top,Height). - Save the workbook with
workbook.SaveToFile.
The complete code example below shows how to insert a picture into a chart in React:
function App() {
  const addPictureInChart = async () => {
    // get the Spire.XLS WASM module
    const xlsModule = window.wasmModule?.spirexls;

    // check that the module is ready
    if (!xlsModule) {
      alert('Spire.Xls is not ready yet');
      return;
    }

    // load the font, the test data file and the picture into the VFS
    await window.spire.FetchFileToVFS('ARIAL.TTF', '/Library/Fonts/', `${process.env.PUBLIC_URL}/font/`);
    const inputFileName = 'ChartReport.xlsx';
    await window.spire.FetchFileToVFS(inputFileName, '', `${process.env.PUBLIC_URL}data/`);
    await window.spire.FetchFileToVFS('logo.png', '', `${process.env.PUBLIC_URL}static/image/`);

    // load the workbook
    const workbook = new xlsModule.Workbook();
    workbook.LoadFromFile({ fileName: inputFileName });

    // take the first worksheet and the chart on it
    const sheet = workbook.Worksheets.get(0);
    const chart = sheet.Charts.get(0);

    // insert the picture into the chart; the object returned is that picture
    const picture = chart.Shapes.AddPicture('logo.png');

    // place it in the top-right corner and scale it down. Left unset, the picture is laid out at
    // its natural pixel size and usually covers most of the chart
    picture.Left = 2850;   // 2850/4000 from the left edge of the chart
    picture.Top = 110;     // 110/4000 from the top edge of the chart
    picture.Width = 900;   // width 900/4000
    picture.Height = 532;  // height 532/4000, matching the 320x120 of the source picture

    // save the workbook
    const outputFileName = 'AddPictureInChart.xlsx';
    workbook.SaveToFile({ fileName: outputFileName });

    // dispose of the workbook to free resources
    workbook.Dispose();

    // read the result file from the VFS and start the download
    const fileArray = window.dotnetRuntime.Module.FS.readFile(outputFileName);
    const blob = new Blob([fileArray], { type: 'application/vnd.openxmlformats-officedocument.spreadsheetml.sheet' });
    const url = URL.createObjectURL(blob);
    const a = document.createElement('a');
    a.href = url;
    a.download = outputFileName;
    a.click();
    URL.revokeObjectURL(url);
  };

  return (
    <div style={{ textAlign: 'center', height: '300px' }}>
      <h1>Insert a Picture and a Text Box in a Chart</h1>
      <button id="add-picture-in-chart" onClick={addPictureInChart}>Add a picture to the chart</button>
    </div>
  );
}

export default App;
After running, inserting a picture into a chart:
Insert a text box into a chart
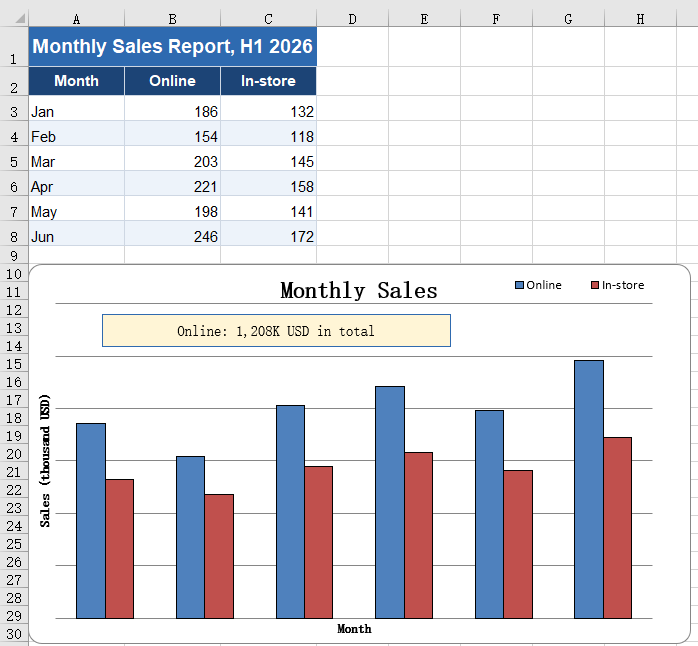
A chart shows a trend but cannot state a conclusion. A total for one series, a year-on-year remark or a callout on an outlier can all be written straight onto the chart with a text box, sparing the reader a second trip to the body text for the number. A text box is a shape inside the chart like the picture, measured on the same scale; the difference is that its size has to be sized to the length of the text. Leave it too narrow and the text wraps, and the wrapped line is clipped by the box height — it looks as though half the words went missing. The steps are:
- Load the font and the test data file into the VFS.
- Load the workbook with
workbook.LoadFromFileand take the first chart on the first worksheet. - Create the text box inside the chart with
chart.Shapes.AddTextBox. - Set
Left,Top,WidthandHeightaccording to the length of the text so that the content fits on one line. - Write the text into the
Textproperty. - Centre the text with
HAlignmentandVAlignment, taking the values fromxlsModule.CommentHAlignTypeandxlsModule.CommentVAlignType. - Set the fill, the border colour and the border width with
Fill.ForeColor,Line.ForeColorandLine.Weight, so that the box stands out on the chart. - Save the workbook with
workbook.SaveToFile.
The complete code example below shows how to insert a text box into a chart in React:
function App() {
  const addTextBoxInChart = async () => {
    // get the Spire.XLS WASM module
    const xlsModule = window.wasmModule?.spirexls;

    // check that the module is ready
    if (!xlsModule) {
      alert('Spire.Xls is not ready yet');
      return;
    }

    // load the font and the test data file into the VFS
    await window.spire.FetchFileToVFS('ARIAL.TTF', '/Library/Fonts/', `${process.env.PUBLIC_URL}/font/`);
    const inputFileName = 'ChartReport.xlsx';
    await window.spire.FetchFileToVFS(inputFileName, '', `${process.env.PUBLIC_URL}data/`);

    // load the workbook
    const workbook = new xlsModule.Workbook();
    workbook.LoadFromFile({ fileName: inputFileName });

    // take the first worksheet and the chart on it
    const sheet = workbook.Worksheets.get(0);
    const chart = sheet.Charts.get(0);

    // Add a text box to the chart
    const textBox = chart.Shapes.AddTextBox();

    // set the position and size of the text box, again in 1/4000 of the chart
    textBox.Left = 450;
    textBox.Top = 530;
    textBox.Width = 2100;
    textBox.Height = 340;

    // write the text
    textBox.Text = 'Online: 1,208K USD in total';

    // centre the text and give the box a pale yellow fill and a blue border so that it stands
    // out on the chart
    textBox.HAlignment = xlsModule.CommentHAlignType.Center;
    textBox.VAlignment = xlsModule.CommentVAlignType.Center;
    textBox.Fill.ForeColor = xlsModule.Color.FromArgb(255, 255, 245, 214);
    textBox.Line.ForeColor = xlsModule.Color.FromArgb(255, 46, 106, 176);
    textBox.Line.Weight = 1;

    // save the workbook
    const outputFileName = 'AddTextBoxInChart.xlsx';
    workbook.SaveToFile({ fileName: outputFileName });

    // dispose of the workbook to free resources
    workbook.Dispose();

    // read the result file from the VFS and start the download
    const fileArray = window.dotnetRuntime.Module.FS.readFile(outputFileName);
    const blob = new Blob([fileArray], { type: 'application/vnd.openxmlformats-officedocument.spreadsheetml.sheet' });
    const url = URL.createObjectURL(blob);
    const a = document.createElement('a');
    a.href = url;
    a.download = outputFileName;
    a.click();
    URL.revokeObjectURL(url);
  };

  return (
    <div style={{ textAlign: 'center', height: '300px' }}>
      <h1>Insert a Picture and a Text Box in a Chart</h1>
      <button id="add-textbox-in-chart" onClick={addTextBoxInChart}>Add a text box to the chart</button>
    </div>
  );
}

export default App;
After running, inserting a text box into a chart:
Fill the plot area with a picture
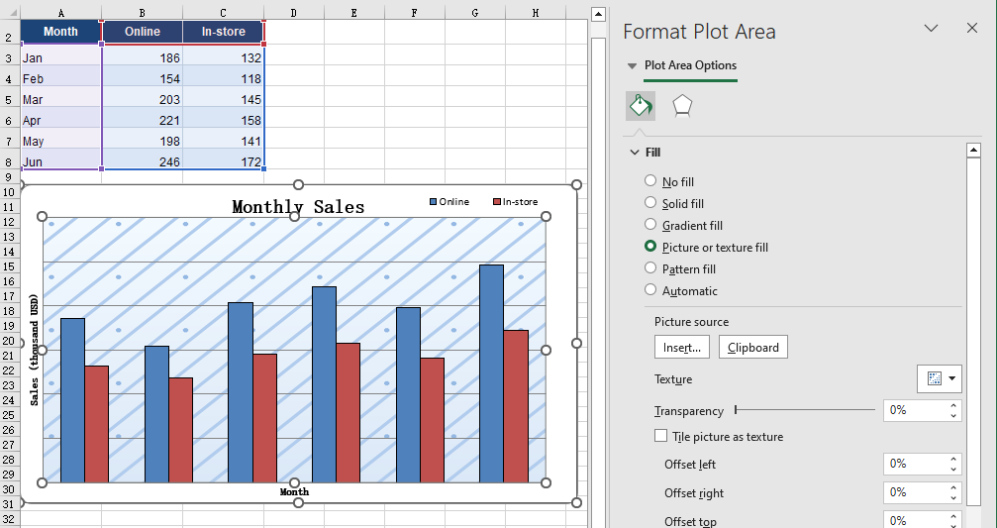
The white background of the plot area is the chart's default, and a report that has been around for a while starts to look the same everywhere. Replacing it with a light texture keeps the columns, the gridlines and the axis labels perfectly legible while giving the background some depth, and pulls the chart into the same visual language as the rest of the report. The fill and the picture shapes placed on the chart do not interfere with each other; the two can be used together. The steps are:
- Load the font, the test data file and the background picture into the VFS.
- Load the workbook with
workbook.LoadFromFileand take the first chart on the first worksheet. - Build an
xlsModule.Streamin memory from the background picture. - Hand it to
chart.PlotArea.Fill.CustomPicture; the second parameter,name, names an existing texture in the workbook, and'None'is passed when there is none. - Save the workbook with
workbook.SaveToFile.
The complete code example below shows how to fill the plot area with a picture in React:
function App() {
  const fillPlotAreaWithPicture = async () => {
    // get the Spire.XLS WASM module
    const xlsModule = window.wasmModule?.spirexls;

    // check that the module is ready
    if (!xlsModule) {
      alert('Spire.Xls is not ready yet');
      return;
    }

    // load the font, the test data file and the background picture into the VFS
    await window.spire.FetchFileToVFS('ARIAL.TTF', '/Library/Fonts/', `${process.env.PUBLIC_URL}/font/`);
    const inputFileName = 'ChartReport.xlsx';
    await window.spire.FetchFileToVFS(inputFileName, '', `${process.env.PUBLIC_URL}data/`);
    await window.spire.FetchFileToVFS('background.png', '', `${process.env.PUBLIC_URL}static/image/`);

    // load the workbook
    const workbook = new xlsModule.Workbook();
    workbook.LoadFromFile({ fileName: inputFileName });

    // take the first worksheet and the chart on it
    const sheet = workbook.Worksheets.get(0);
    const chart = sheet.Charts.get(0);

    // read the background picture into a memory stream and use it to fill the plot area
    const background = new xlsModule.Stream('background.png');
    chart.PlotArea.Fill.CustomPicture({ im: background, name: 'None' });

    // save the workbook
    const outputFileName = 'FillPlotAreaWithPicture.xlsx';
    workbook.SaveToFile({ fileName: outputFileName });

    // dispose of the workbook to free resources
    workbook.Dispose();

    // read the result file from the VFS and start the download
    const fileArray = window.dotnetRuntime.Module.FS.readFile(outputFileName);
    const blob = new Blob([fileArray], { type: 'application/vnd.openxmlformats-officedocument.spreadsheetml.sheet' });
    const url = URL.createObjectURL(blob);
    const a = document.createElement('a');
    a.href = url;
    a.download = outputFileName;
    a.click();
    URL.revokeObjectURL(url);
  };

  return (
    <div style={{ textAlign: 'center', height: '300px' }}>
      <h1>Insert a Picture and a Text Box in a Chart</h1>
      <button id="fill-plot-area" onClick={fillPlotAreaWithPicture}>Fill the plot area with a picture</button>
    </div>
  );
}

export default App;
After running, filling the plot area with a picture:
FAQ
Can I add an arrow or a callout line to a chart?
Solution: An arrow or a callout line that points at something has no API of its own, but a text box can stand in for one: stretch it into a thin strip, drop the fill and keep only the border, and place it where the callout should point.
When filling with a picture, is it the plot area or the whole chart that gets filled?
Cause: PlotArea.Fill and ChartArea.Fill are two different objects. The first covers only the region enclosed by the axes, leaving the chart title, the legend and the axis labels outside the picture. The second covers the entire chart, so the title and the legend end up on top of the picture as well.
Solution: Pick whichever one you need. After the fill, read Fill.FillType; it returns ShapeFillType.Picture on success:
// fill only the plot area: the title, the legend and the axis labels stay as they were
const background = new xlsModule.Stream('background.png');
chart.PlotArea.Fill.CustomPicture({ im: background, name: 'None' });

// fill the whole chart: the picture runs under the title and the legend
chart.ChartArea.Fill.CustomPicture({ im: new xlsModule.Stream('background.png'), name: 'None' });
Get a Free License
Spire.XLS for JavaScript offers a 30-day full-featured free trial license with no functional limitations. Apply here to evaluate before purchasing.
Set the Theme of an Excel Workbook in React with JavaScript
A finished report is often reused for a different brand or a different department, and the colours have to follow. The awkward part is that a workbook holds two kinds of colour. One is a hard-coded RGB value that belongs to the single cell it sits in. The other points at a theme slot: the title bar, the header row, the banded rows and the borders all look different, yet all of them read from the same set of slots. The first kind has to be changed cell by cell, and one missed cell gives the old palette away. The second kind repaints the entire sheet from a single slot. Spire.XLS for JavaScript does this in the browser on top of WebAssembly, managing input and output files through a virtual file system (VFS), with no backend service required.
This article covers three key features:
For installation and project setup, see Integrating Spire.XLS for JavaScript in a React Project. The examples below assume Spire.XLS is installed and the WebAssembly module has been initialised.
Replace an accent colour in the theme
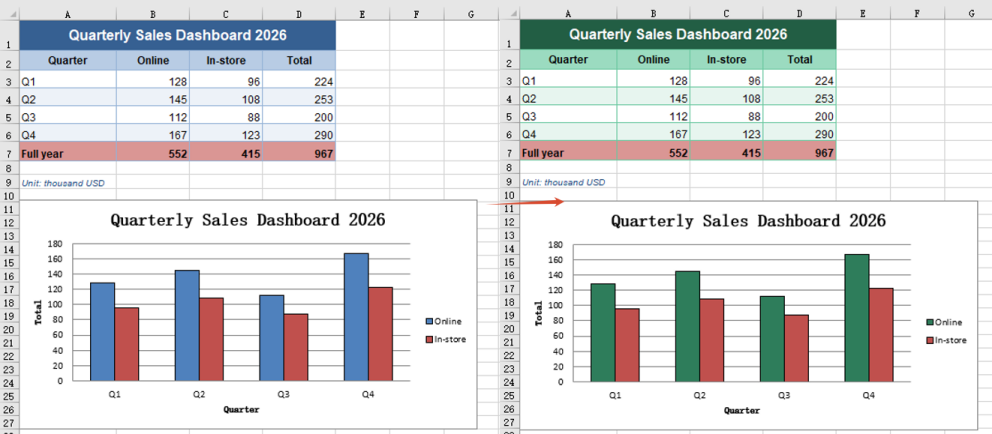
Most reports lean on a single colour: the header row is filled with it, the title bar takes a darker shade, the banded rows a lighter one, and the borders a paler one still. Those shades were not mixed by hand one at a time — they are the same slot read at different tint levels. Reskinning therefore needs no colour picking at all: replace that one slot with the new brand colour and every shade is recomputed, so the whole sheet, chart included, lands on the new palette. The steps are:
- Load the font and the test data file into the VFS.
- Load the workbook with
workbook.LoadFromFile. - Replace the
xlsModule.ThemeColorType.Accent1slot withworkbook.SetThemeColor, giving the new colour throughxlsModule.Color.FromArgb. - Save the workbook with
workbook.SaveToFile; the title bar, header row, banded rows and borders change together.
The complete code example below shows how to replace an accent colour in the theme in React:
function App() {
  const setThemeColor = async () => {
    // Get the Spire.XLS WASM module
    const xlsModule = window.wasmModule?.spirexls;

    // Check that the module is ready
    if (!xlsModule) {
      alert('Spire.Xls is not ready yet');
      return;
    }

    // Load the font and the test data into the VFS
    await window.spire.FetchFileToVFS('ARIAL.TTF', '/Library/Fonts/', `${process.env.PUBLIC_URL}/font/`);
    const inputFileName = 'ThemeSource.xlsx';
    await window.spire.FetchFileToVFS(inputFileName, '', `${process.env.PUBLIC_URL}data/`);

    // Load the workbook
    const workbook = new xlsModule.Workbook();
    workbook.LoadFromFile({ fileName: inputFileName });

    // Replace accent 1 of the theme: the title bar, the header row, the banded rows and the
    // borders all follow it
    workbook.SetThemeColor(
      xlsModule.ThemeColorType.Accent1,
      xlsModule.Color.FromArgb(255, 46, 125, 91),
    );

    // Save the workbook
    const outputFileName = "SetThemeColor.xlsx";
    workbook.SaveToFile({ fileName: outputFileName });

    // Dispose of the workbook object to release resources
    workbook.Dispose();

    // Read the result file from the VFS and trigger the download
    const fileArray = window.dotnetRuntime.Module.FS.readFile(outputFileName);
    const blob = new Blob([fileArray], { type: 'application/vnd.openxmlformats-officedocument.spreadsheetml.sheet' });
    const url = URL.createObjectURL(blob);
    const a = document.createElement('a');
    a.href = url;
    a.download = outputFileName;
    a.click();
    URL.revokeObjectURL(url);
  };

  return (
    <div style={{ textAlign: 'center', height: '300px' }}>
      <h1>Set Workbook Theme</h1>
      <button id="set-theme-color" onClick={setThemeColor}>Replace a Theme Colour</button>
    </div>
  );
}

export default App;
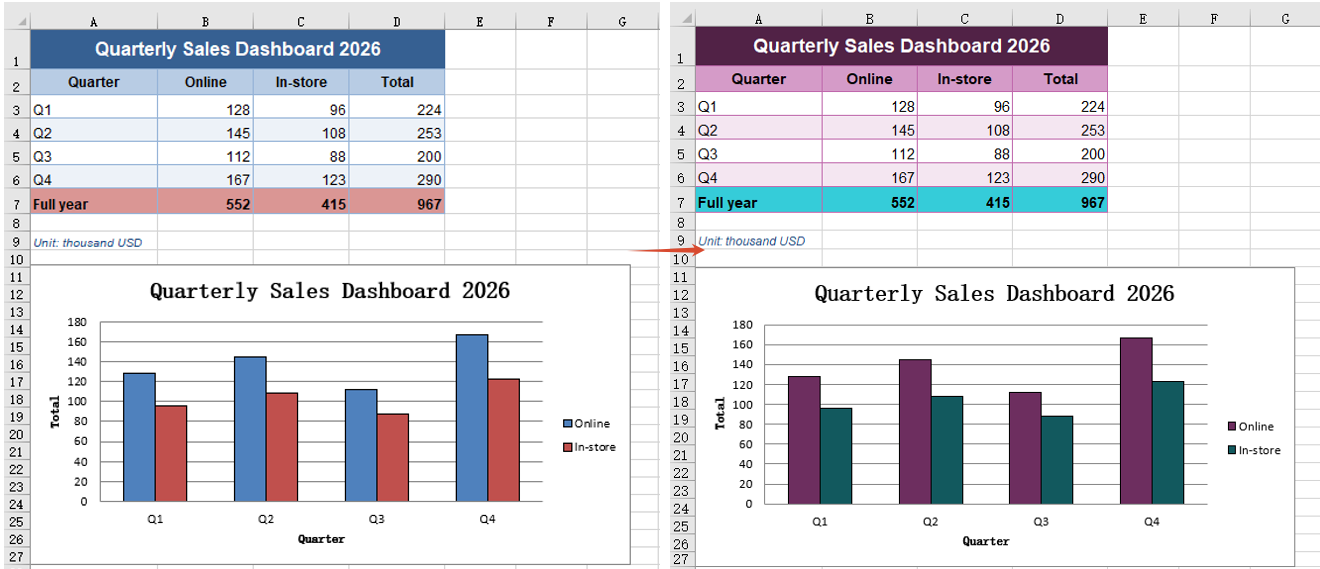
After running, replacing an accent colour in the theme:
Apply a custom colour scheme
Replacing one accent colour unifies the body of the table, but the other series in the chart, the total row and any warning colour stay on the old palette — they read from other slots in the theme. To move a document onto a different scheme outright, change all six accent slots together, so every element that references the theme lands on the new colours at once instead of one changing and a string of others lagging behind. Reading the current values first leaves a baseline to check the result against. The steps are:
- Load the font and the test data file into the VFS.
- Load the workbook with
workbook.LoadFromFile, then read theR,GandBof the current accent 1 withworkbook.GetThemeColorto keep as a baseline. - Put the six slot-and-colour pairs into an array, the colours again built with
xlsModule.Color.FromArgb. - Walk the array and call
workbook.SetThemeColoron each entry, so all six accent colours change in one pass. - Save the workbook with
workbook.SaveToFile.
The complete code example below shows how to apply a custom colour scheme in React:
function App() {
  const applyThemeScheme = async () => {
    // Get the Spire.XLS WASM module
    const xlsModule = window.wasmModule?.spirexls;

    // Check that the module is ready
    if (!xlsModule) {
      alert('Spire.Xls is not ready yet');
      return;
    }

    // Load the font and the test data into the VFS
    await window.spire.FetchFileToVFS('ARIAL.TTF', '/Library/Fonts/', `${process.env.PUBLIC_URL}/font/`);
    const inputFileName = 'ThemeSource.xlsx';
    await window.spire.FetchFileToVFS(inputFileName, '', `${process.env.PUBLIC_URL}data/`);

    // Load the workbook
    const workbook = new xlsModule.Workbook();
    workbook.LoadFromFile({ fileName: inputFileName });

    // Read the current accent colour back first, so it can be compared with the new one
    const before = workbook.GetThemeColor(xlsModule.ThemeColorType.Accent1);
    console.log(`Accent 1 before the change: R=${before.R} G=${before.G} B=${before.B}`);

    // All six accent colours change in one go, so the whole scheme moves together
    const scheme = [
      [xlsModule.ThemeColorType.Accent1, xlsModule.Color.FromArgb(255, 109, 46, 95)],
      [xlsModule.ThemeColorType.Accent2, xlsModule.Color.FromArgb(255, 18, 89, 94)],
      [xlsModule.ThemeColorType.Accent3, xlsModule.Color.FromArgb(255, 138, 106, 22)],
      [xlsModule.ThemeColorType.Accent4, xlsModule.Color.FromArgb(255, 47, 93, 58)],
      [xlsModule.ThemeColorType.Accent5, xlsModule.Color.FromArgb(255, 67, 48, 122)],
      [xlsModule.ThemeColorType.Accent6, xlsModule.Color.FromArgb(255, 138, 59, 46)],
    ];
    for (const [themeColorType, color] of scheme) {
      workbook.SetThemeColor(themeColorType, color);
    }

    // Save the workbook
    const outputFileName = "ApplyThemeScheme.xlsx";
    workbook.SaveToFile({ fileName: outputFileName });

    // Dispose of the workbook object to release resources
    workbook.Dispose();

    // Read the result file from the VFS and trigger the download
    const fileArray = window.dotnetRuntime.Module.FS.readFile(outputFileName);
    const blob = new Blob([fileArray], { type: 'application/vnd.openxmlformats-officedocument.spreadsheetml.sheet' });
    const url = URL.createObjectURL(blob);
    const a = document.createElement('a');
    a.href = url;
    a.download = outputFileName;
    a.click();
    URL.revokeObjectURL(url);
  };

  return (
    <div style={{ textAlign: 'center', height: '300px' }}>
      <h1>Set Workbook Theme</h1>
      <button id="apply-theme-scheme" onClick={applyThemeScheme}>Apply a Custom Colour Scheme</button>
    </div>
  );
}

export default App;
After running, applying a custom colour scheme:
Reuse another workbook's theme
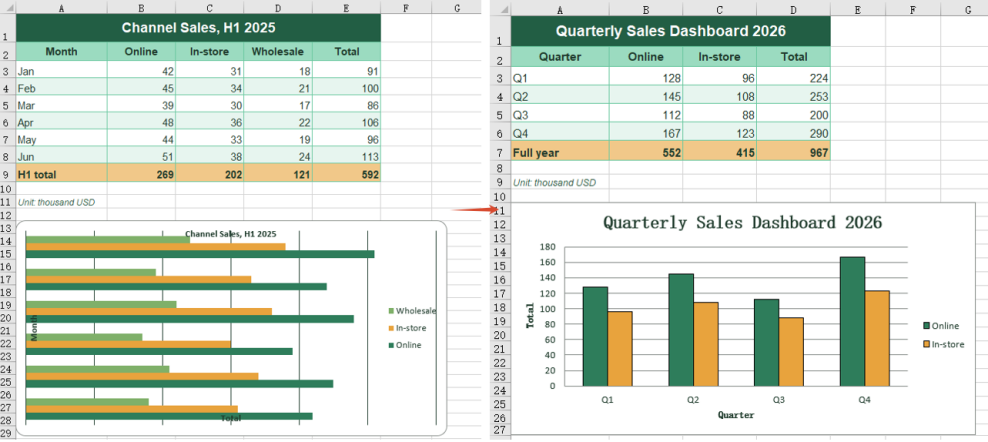
Once a colour scheme is signed off it usually already lives in a workbook — the designer's sample, last quarter's report, or the company template. Copying the hex values slot by slot is tedious and easy to get a digit wrong. The theme is itself part of the workbook, so the whole theme can be taken across, carrying both dark and light background pairs and the hyperlink colours with it, and every theme-referenced colour in the target workbook is repainted. The workbook the theme comes from need not match the target's layout at all — how many rows and columns it holds, which data sits in them and which kind of chart it draws make no difference. What crosses over is the theme; the target's own data and chart are left untouched. The steps are:
- Load the font and both workbook files into the VFS.
- Load the target workbook with
workbook.LoadFromFile, then the theme provider withthemeWorkbook.LoadFromFile. - Copy the provider's theme across in one piece with
workbook.CopyTheme(themeWorkbook). - Save the target workbook with
workbook.SaveToFile, then callDisposeon bothworkbookobjects.
The complete code example below shows how to reuse another workbook's theme in React:
function App() {
const copyWorkbookTheme = async () => {
// Get the Spire.XLS WASM module
const xlsModule = window.wasmModule?.spirexls;
// Check that the module is ready
if (!xlsModule) {
alert('Spire.Xls is not ready yet');
return;
}
// Load the font and both workbooks into the VFS
await window.spire.FetchFileToVFS('ARIAL.TTF', '/Library/Fonts/', `${process.env.PUBLIC_URL}/font/`);
const inputFileName = 'ThemeSource.xlsx';
const themeFileName = 'ThemeAlt.xlsx';
await window.spire.FetchFileToVFS(inputFileName, '', `${process.env.PUBLIC_URL}data/`);
await window.spire.FetchFileToVFS(themeFileName, '', `${process.env.PUBLIC_URL}data/`);
// Load the workbook that is to be reskinned
const workbook = new xlsModule.Workbook();
workbook.LoadFromFile({ fileName: inputFileName });
// Load the workbook the theme comes from
const themeWorkbook = new xlsModule.Workbook();
themeWorkbook.LoadFromFile({ fileName: themeFileName });
// Copy the theme of the source workbook over in one piece
workbook.CopyTheme(themeWorkbook);
// Save the workbook
const outputFileName = "CopyWorkbookTheme.xlsx";
workbook.SaveToFile({ fileName: outputFileName });
// Dispose of both workbook objects to release resources
workbook.Dispose();
themeWorkbook.Dispose();
// Read the result file from the VFS and trigger the download
const fileArray = window.dotnetRuntime.Module.FS.readFile(outputFileName);
const blob = new Blob([fileArray], { type: 'application/vnd.openxmlformats-officedocument.spreadsheetml.sheet' });
const url = URL.createObjectURL(blob);
const a = document.createElement('a');
a.href = url;
a.download = outputFileName;
a.click();
URL.revokeObjectURL(url);
};
return (
<div style={{ textAlign: 'center', height: '300px' }}>
<h1>Set Workbook Theme</h1>
<button id="copy-workbook-theme" onClick={copyWorkbookTheme}>Reuse Another Workbook's Theme</button>
</div>
);
}
export default App;
After running, reusing another workbook's theme:
FAQ
Which colours change with the theme, and which do not
Cause: Colours fall into two kinds. A colour taken from Theme Colors in Excel changes together with the theme; a colour taken from Standard Colors is a fixed value and stays as it is.
Solution: To have a colour change with the theme, select the cell in Excel and pick it from Theme Colors. Colours written in code are all fixed values and do not change with the theme:
const cell = sheet.Range.get('A1');

// A fixed colour: it does not change with the theme
cell.Style.Interior.Color = xlsModule.Color.FromArgb(255, 192, 0, 0);
Can the chart alone be restyled, leaving the table untouched?
Cause: The theme belongs to the whole workbook and makes no distinction between the table and the chart. When the theme changes, every object that takes its colour from the theme changes with it, and the chart is one of them. A chart series holds no colour of its own — it takes the colour from the theme at draw time — so the chart always follows, and one side cannot change on its own.
Solution: To restyle only the chart, leave the theme alone and set the colour on the series directly. That writes a fixed colour into the chart, which the theme does not affect:
const chart = sheet.Charts.get(0);
const serie = chart.Series.get(0);

serie.Format.Fill.FillType = xlsModule.ShapeFillType.SolidColor;
serie.Format.Fill.ForeColor = xlsModule.Color.FromArgb(255, 46, 125, 91);
Get a Free License
Spire.XLS for JavaScript offers a 30-day full-featured free trial license with no functional limitations. Apply here to evaluate before purchasing.
Create Excel Charts from Discontinuous or No Data in React
Worksheet data is rarely a tidy rectangle. Detail rows are interrupted by subtotal lines, group headings and notes, and the chart is meant to draw the detail alone; other numbers never reach a cell at all, because they come back from an API, are computed in code, or are simply a set of targets for this one report. Both cases defeat the usual routine of selecting a block and inserting a chart. Spire.XLS for JavaScript does this in the browser on top of WebAssembly, managing input and output files through a virtual file system (VFS), with no backend service required.
This article covers two key features:
For installation and project setup, see Integrating Spire.XLS for JavaScript in a React Project. The examples below assume Spire.XLS is installed and the WebAssembly module has been initialised.
Create a chart from a discontinuous data source
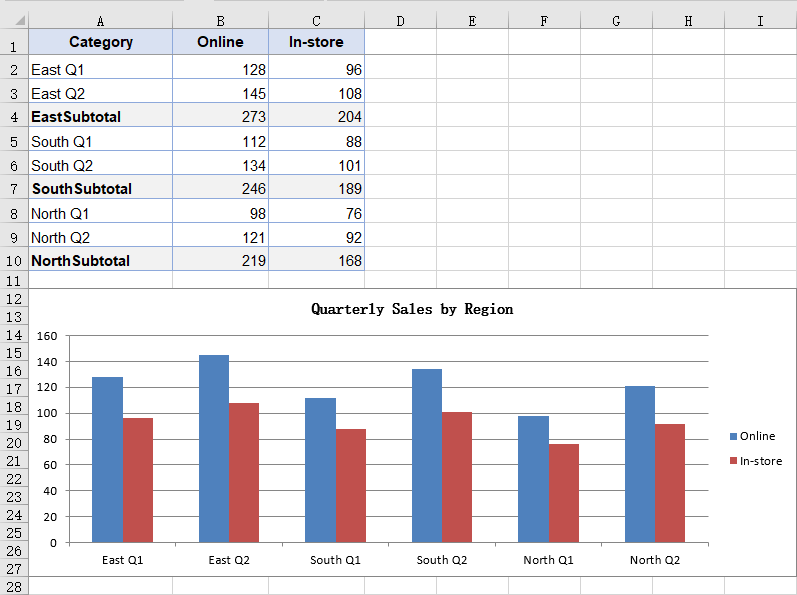
Subtotal rows, group headings and notes all cut a table of details into several blocks. Selecting the whole column and inserting a chart makes no distinction between them and the detail rows, so they are drawn as columns too: in the sample data a subtotal follows every two quarters, and reading the whole column turns six columns into nine and roughly doubles the height of every region. A series can be given its data as several non-adjacent blocks joined into a single reference, so the chart takes only the rows inside those blocks and skips over the rest. The table then needs no rearranging for the sake of the chart, and the subtotal rows can stay where they are. The steps are:
- Load the font and the test data file into the VFS.
- Load the workbook with
workbook.LoadFromFileand get the first worksheet withworkbook.Worksheets.get(0). - Add a column chart with
sheet.Charts.Addand setchart.SeriesDataFromRangetofalse, declaring that the series data is supplied block by block in code rather than taken fromchart.DataRange. - Add a series with
chart.Series.Addand setserie.Nameto theValueof the header cell. - Take each region's quarter rows with
Range.getand join them withAddCombinedRange, producing one reference for the category labels and one for the values. - Repeat the same joins for the second series so both share the same category labels, then save the workbook.
The complete code example below shows how to create a chart from a discontinuous data source in React:
function App() {
  const chartFromDiscontinuousData = async () => {
    // Get the Spire.XLS WASM module
    const xlsModule = window.wasmModule?.spirexls;

    // Check that the module is ready
    if (!xlsModule) {
      alert('Spire.Xls is not ready yet');
      return;
    }

    // Load the font and the sample workbook into the VFS
    await window.spire.FetchFileToVFS('ARIAL.TTF', '/Library/Fonts/', `${process.env.PUBLIC_URL}/font/`);
    const inputFileName = 'ChartSourceData.xlsx';
    await window.spire.FetchFileToVFS(inputFileName, '', `${process.env.PUBLIC_URL}data/`);

    // Load the workbook and get the first worksheet
    const workbook = new xlsModule.Workbook();
    workbook.LoadFromFile({ fileName: inputFileName });
    const sheet = workbook.Worksheets.get(0);

    // Add a column chart; the series data is given block by block in code, not as one range
    const chart = sheet.Charts.Add({ chartType: xlsModule.ExcelChartType.ColumnClustered });
    chart.ChartTitle = "Quarterly Sales by Region";
    chart.ChartTitleArea.Size = 12;
    chart.SeriesDataFromRange = false;

    // Place the chart on the worksheet
    chart.TopRow = 12;
    chart.BottomRow = 28;
    chart.LeftColumn = 1;
    chart.RightColumn = 10;

    // Join the three regions' quarter rows into one reference, skipping the subtotal rows
    const categoryLabels = sheet.Range.get("A2:A3")
      .AddCombinedRange(sheet.Range.get("A5:A6"))
      .AddCombinedRange(sheet.Range.get("A8:A9"));

    // Online series: the name comes from the header, the values are joined the same way
    const onlineSerie = chart.Series.Add();
    onlineSerie.Name = sheet.Range.get("B1").Value;
    onlineSerie.CategoryLabels = categoryLabels;
    onlineSerie.Values = sheet.Range.get("B2:B3")
      .AddCombinedRange(sheet.Range.get("B5:B6"))
      .AddCombinedRange(sheet.Range.get("B8:B9"));

    // In-store series: it shares the same category labels
    const storeSerie = chart.Series.Add();
    storeSerie.Name = sheet.Range.get("C1").Value;
    storeSerie.CategoryLabels = categoryLabels;
    storeSerie.Values = sheet.Range.get("C2:C3")
      .AddCombinedRange(sheet.Range.get("C5:C6"))
      .AddCombinedRange(sheet.Range.get("C8:C9"));

    // Save the workbook
    const outputFileName = "DiscontinuousData.xlsx";
    workbook.SaveToFile({ fileName: outputFileName });

    // Dispose of the workbook object to free resources
    workbook.Dispose();

    // Read the result file from the VFS and trigger the download
    const fileArray = window.dotnetRuntime.Module.FS.readFile(outputFileName);
    const blob = new Blob([fileArray], { type: 'application/vnd.openxmlformats-officedocument.spreadsheetml.sheet' });
    const url = URL.createObjectURL(blob);
    const a = document.createElement('a');
    a.href = url;
    a.download = outputFileName;
    a.click();
    URL.revokeObjectURL(url);
  };

  return (
    <div style={{ textAlign: 'center', height: '300px' }}>
      <h1>Discontinuous Data Chart</h1>
      <button id="discontinuous-data" onClick={chartFromDiscontinuousData}>Create a chart from a discontinuous source</button>
    </div>
  );
}

export default App;
After running, the chart created from a discontinuous data source:
Create a chart without a data source
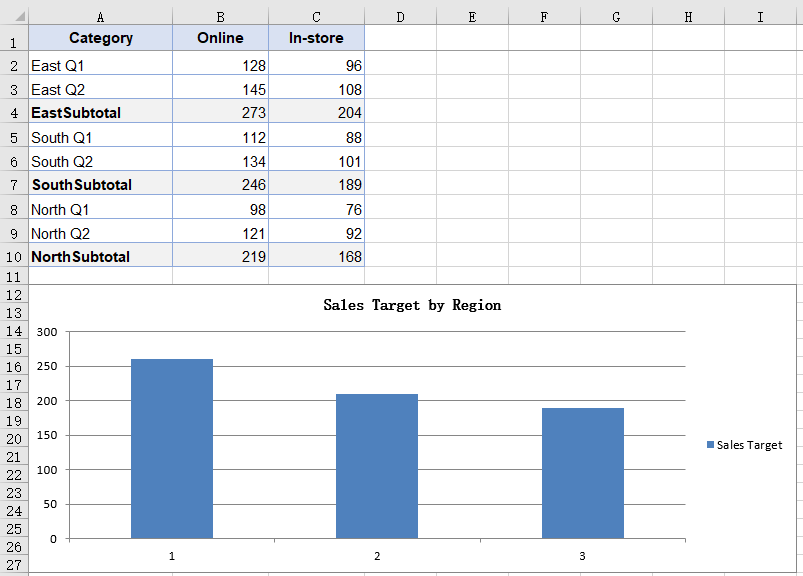
A chart normally takes its data from cells, but not always: a target may live in a configuration file, a summary figure may come back from an API, or the numbers may just be a set of constants for a demonstration. None of them has landed in the worksheet, so there is no range for the chart to point at. A series can carry its values inside itself instead, which lets the chart stand without any worksheet data behind it; the numbers follow the code and are regenerated with it, so no copy has to be maintained in the sheet for the sake of the chart. Because the values come from nowhere on the sheet, the chart carries no text categories either, and the horizontal axis is numbered 1, 2, 3. The steps are:
- Load the font and the test data file into the VFS.
- Load the workbook with
workbook.LoadFromFileand get the first worksheet withworkbook.Worksheets.get(0); the new chart still has to hang on an existing worksheet. - Add a column chart with
sheet.Charts.Add, and set the chart title and position. - Add a series with
chart.Series.Addand setserie.Nameto the series name. - Box each number with
xlsModule.Int32.Create, put them in order intoserie.EnteredDirectlyValues, and save the workbook.
The complete code example below shows how to create a chart without a data source in React:
function App() {
  const chartWithoutSourceData = async () => {
    // Get the Spire.XLS WASM module
    const xlsModule = window.wasmModule?.spirexls;

    // Check that the module is ready
    if (!xlsModule) {
      alert('Spire.Xls is not ready yet');
      return;
    }

    // Load the font and the sample workbook into the VFS
    await window.spire.FetchFileToVFS('ARIAL.TTF', '/Library/Fonts/', `${process.env.PUBLIC_URL}/font/`);
    const inputFileName = 'ChartSourceData.xlsx';
    await window.spire.FetchFileToVFS(inputFileName, '', `${process.env.PUBLIC_URL}data/`);

    // Load the workbook and get the first worksheet
    const workbook = new xlsModule.Workbook();
    workbook.LoadFromFile({ fileName: inputFileName });
    const sheet = workbook.Worksheets.get(0);

    // Add a column chart; this time the numbers come from no cell at all
    const chart = sheet.Charts.Add({ chartType: xlsModule.ExcelChartType.ColumnClustered });
    chart.ChartTitle = "Sales Target by Region";
    chart.ChartTitleArea.Size = 12;

    // Place the chart on the worksheet
    chart.TopRow = 12;
    chart.BottomRow = 28;
    chart.LeftColumn = 1;
    chart.RightColumn = 10;

    // Add a series and write the numbers into EnteredDirectlyValues one by one
    // No category labels are given, so the chart numbers them 1, 2, 3
    const targetSerie = chart.Series.Add();
    targetSerie.Name = "Sales Target";
    targetSerie.EnteredDirectlyValues = [
      xlsModule.Int32.Create(260),
      xlsModule.Int32.Create(210),
      xlsModule.Int32.Create(190),
    ];

    // Save the workbook
    const outputFileName = "NoSourceData.xlsx";
    workbook.SaveToFile({ fileName: outputFileName });

    // Dispose of the workbook object to free resources
    workbook.Dispose();

    // Read the result file from the VFS and trigger the download
    const fileArray = window.dotnetRuntime.Module.FS.readFile(outputFileName);
    const blob = new Blob([fileArray], { type: 'application/vnd.openxmlformats-officedocument.spreadsheetml.sheet' });
    const url = URL.createObjectURL(blob);
    const a = document.createElement('a');
    a.href = url;
    a.download = outputFileName;
    a.click();
    URL.revokeObjectURL(url);
  };

  return (
    <div style={{ textAlign: 'center', height: '300px' }}>
      <h1>Chart Without a Data Source</h1>
      <button id="no-source-data" onClick={chartWithoutSourceData}>Create a chart without a data source</button>
    </div>
  );
}

export default App;
After running, the chart created without a data source:
FAQ
Does the series name have to point at a cell?
Cause: serie.Name takes a plain string. Whatever you assign becomes the series name and is what the legend shows; after saving it sits in the series itself rather than in a reference to a cell. Reading the Value of a header cell is just another way to get there, not a requirement. The values and the category labels still have to come from a range — only the name can stand free of one.
Solution: assign the text straight to serie.Name:
const serie = chart.Series.Add();
serie.Name = "Sales Target";
serie.CategoryLabels = sheet.Range.get("A2:A3").AddCombinedRange(sheet.Range.get("A5:A6")).AddCombinedRange(sheet.Range.get("A8:A9"));
serie.Values = sheet.Range.get("B2:B3").AddCombinedRange(sheet.Range.get("B5:B6")).AddCombinedRange(sheet.Range.get("B8:B9"));
Do both series need their own category labels?
Cause: CategoryLabels belongs to the series itself. When a second series is added it does not pick up the setting from the one before it, so it has to be assigned again.
Solution: join the blocks once, keep the result in a variable and point each series at it, instead of writing AddCombinedRange out twice:
const labels = sheet.Range.get("A2:A3")
  .AddCombinedRange(sheet.Range.get("A5:A6"))
  .AddCombinedRange(sheet.Range.get("A8:A9"));

onlineSerie.CategoryLabels = labels;
storeSerie.CategoryLabels = labels;
Get a Free License
Spire.XLS for JavaScript offers a 30-day full-featured free trial license with no functional limitations. Apply here to evaluate before purchasing.
Format Excel Chart Axes in React with JavaScript
When a chart is inserted, Excel determines a scale automatically: the lower and upper bounds of the value axis and its intervals are all derived from the data range. These defaults are adequate in most cases, but they fall short in two situations. First, when the data is concentrated in a narrow band that sits well away from zero, the automatic scale lifts the bottom of the axis to just below the data, so a modest fluctuation is drawn as a near full-height swing and the differences between the columns bear no proportion to the differences between the values. Second, because the tick labels follow the formatting of the source cells, values carrying decimals fill the value axis with fractional digits, which are both harder to read and wider on the page. Axis formatting addresses both: setting the scale and the units keeps the axis from shifting with the data, holds the column heights in proportion to the values, and places every chart on the same measure, choosing the tick marks and the label position controls where the readings fall, rewriting the number format makes the labels easier to compare, and adding titles to both axes tells the reader what each direction represents. Spire.XLS for JavaScript does all of this in the browser on top of WebAssembly, managing input and output files through a virtual file system (VFS), with no backend service required.
This article covers two key features:
For installation and project setup, see Integrating Spire.XLS for JavaScript in a React Project. The examples below assume Spire.XLS is installed and the WebAssembly module has been initialised.
Format the value axis scale
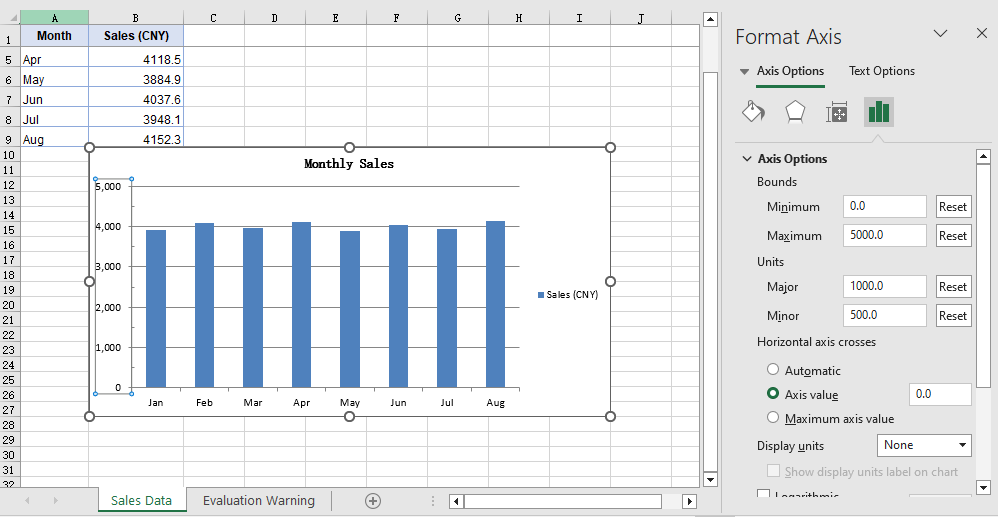
An automatic scale is derived by Excel from the data range, and it is chosen to make the chart look even rather than to make the readings easy to compare. When the data is concentrated in a narrow band that sits well away from zero, that derivation lifts the bottom of the axis to just below the data: with the axis no longer starting at 0, the columns only show their differences from one another, and a modest fluctuation is drawn as a near full-height swing, out of proportion to the values behind it. The tick labels, too, follow the display format of the source cells by default, so data carrying decimals produces a run of fractional values along the value axis, which is both harder to read and wider on the page. Setting the value axis scale by hand addresses both at once: once the scale and the intervals are given by the code, the bottom and top of the axis no longer shift with the data, the column heights stay in proportion to the values, and a set of charts can be measured against the same ruler; once the label format is independent of the source cells, the readings are more even as well. The steps are:
- Load the font and the test data file into the VFS.
- Load the workbook with
workbook.LoadFromFileand get the first worksheet withworkbook.Worksheets.get(0). - Add a column chart with
sheet.Charts.Add, pointchart.DataRangeat the sales column, and assign the month column toserie.CategoryLabels. - On
chart.PrimaryValueAxis, set the scale withMinValueandMaxValue, and the steps of the major and minor divisions withMajorUnitandMinorUnit. - Set the types of the major and minor tick marks with
MajorTickMarkandMinorTickMark, and the position of the tick labels withTickLabelPosition. - Set
NumberFormatto#,##0for the label number format, setIsSourceLinkedtofalseto unlink the format from the source cells, and save the workbook.
The complete code example below shows how to format the value axis scale in React:
function App() {
  const formatValueAxis = async () => {
    // Get the Spire.XLS WASM module
    const xlsModule = window.wasmModule?.spirexls;

    // Check that the module is ready
    if (!xlsModule) {
      alert('Spire.Xls is not ready yet');
      return;
    }

    // Load the font and the sample workbook into the VFS
    await window.spire.FetchFileToVFS('ARIAL.TTF', '/Library/Fonts/', `${process.env.PUBLIC_URL}/font/`);
    const inputFileName = 'ChartAxisData.xlsx';
    await window.spire.FetchFileToVFS(inputFileName, '', `${process.env.PUBLIC_URL}data/`);

    // Load the workbook and get the first worksheet
    const workbook = new xlsModule.Workbook();
    workbook.LoadFromFile({ fileName: inputFileName });
    const sheet = workbook.Worksheets.get(0);

    // Add a column chart whose data range is the sales column
    const chart = sheet.Charts.Add({ chartType: xlsModule.ExcelChartType.ColumnClustered });
    chart.ChartTitle = "Monthly Sales";
    chart.ChartTitleArea.IsBold = true;
    chart.ChartTitleArea.Size = 12;
    chart.DataRange = sheet.Range.get("B1:B9");
    chart.SeriesDataFromRange = false;
    chart.PlotArea.Visible = false;

    // Place the chart on the worksheet
    chart.TopRow = 10;
    chart.BottomRow = 28;
    chart.LeftColumn = 2;
    chart.RightColumn = 10;

    // Take the series and use the month column as its category labels
    const serie = chart.Series.get(0);
    serie.CategoryLabels = sheet.Range.get("A2:A9");

    // Set the value axis bounds: 0 at the bottom, 5000 at the top
    const valueAxis = chart.PrimaryValueAxis;
    valueAxis.MinValue = 0;
    valueAxis.MaxValue = 5000;

    // Set the major unit to 1000 and the minor unit to 500
    valueAxis.MajorUnit = 1000;
    valueAxis.MinorUnit = 500;

    // Major tick marks outside the axis, minor tick marks inside
    valueAxis.MajorTickMark = xlsModule.TickMarkType.TickMarkOutside;
    valueAxis.MinorTickMark = xlsModule.TickMarkType.TickMarkInside;

    // Tick labels sit next to the axis, which the category axis crosses at 0
    valueAxis.TickLabelPosition = xlsModule.TickLabelPositionType.TickLabelPositionNextToAxis;
    valueAxis.CrossesAt = 0;

    // Give the tick labels a thousands separator and drop the decimals
    valueAxis.NumberFormat = "#,##0";

    // Unlink the source format so the tick labels follow NumberFormat
    valueAxis.IsSourceLinked = false;

    // Save the workbook
    const outputFileName = "AxisFormat.xlsx";
    workbook.SaveToFile({ fileName: outputFileName });

    // Dispose of the workbook object to free resources
    workbook.Dispose();

    // Read the result file from the VFS and trigger the download
    const fileArray = window.dotnetRuntime.Module.FS.readFile(outputFileName);
    const blob = new Blob([fileArray], { type: 'application/vnd.openxmlformats-officedocument.spreadsheetml.sheet' });
    const url = URL.createObjectURL(blob);
    const a = document.createElement('a');
    a.href = url;
    a.download = outputFileName;
    a.click();
    URL.revokeObjectURL(url);
  };

  return (
    <div style={{ textAlign: 'center', height: '300px' }}>
      <h1>Value Axis Scale</h1>
      <button onClick={formatValueAxis}>Start</button>
    </div>
  );
}

export default App;
After running, the effect of formatting the value axis scale:
Add axis titles
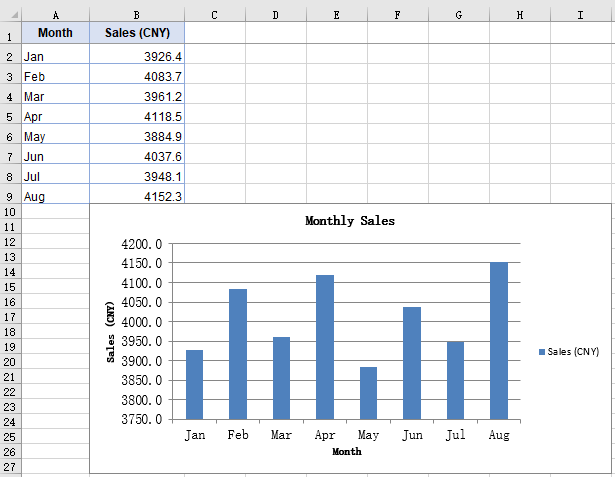
The axes carry only their own divisions and categories, so the chart itself does not state what each data point represents or what unit the numbers are in; opening the file again after some time, a reader often has to check the chart title first to confirm the subject. Axis titles supply precisely that context: the category axis title states what each data point represents, the value axis title states the unit of the numbers, and together with the chart title they complete the chart so that it can be read without its surrounding context. The size of an axis title can also be adjusted separately, which keeps it distinct from the chart title. The steps are:
- Load the font and the test data file into the VFS.
- Load the workbook with
workbook.LoadFromFileand get the first worksheet withworkbook.Worksheets.get(0). - Add a column chart with
sheet.Charts.Add, pointchart.DataRangeat the sales column, and assign the month column toserie.CategoryLabels. - Assign the title text to
chart.PrimaryCategoryAxis.Titleandchart.PrimaryValueAxis.Titlerespectively. - Set both titles to size 12 through the
Font.Sizeof the two axis objects, and save the workbook.
The complete code example below shows how to add titles to the axes in React:
function App() {
  const setAxisTitle = async () => {
    // Get the Spire.XLS WASM module
    const xlsModule = window.wasmModule?.spirexls;

    // Check that the module is ready
    if (!xlsModule) {
      alert('Spire.Xls is not ready yet');
      return;
    }

    // Load the font and the sample workbook into the VFS
    await window.spire.FetchFileToVFS('ARIAL.TTF', '/Library/Fonts/', `${process.env.PUBLIC_URL}/font/`);
    const inputFileName = 'ChartAxisData.xlsx';
    await window.spire.FetchFileToVFS(inputFileName, '', `${process.env.PUBLIC_URL}data/`);

    // Load the workbook and get the first worksheet
    const workbook = new xlsModule.Workbook();
    workbook.LoadFromFile({ fileName: inputFileName });
    const sheet = workbook.Worksheets.get(0);

    // Add a column chart whose data range is the sales column
    const chart = sheet.Charts.Add({ chartType: xlsModule.ExcelChartType.ColumnClustered });
    chart.ChartTitle = "Monthly Sales";
    chart.ChartTitleArea.IsBold = true;
    chart.ChartTitleArea.Size = 12;
    chart.DataRange = sheet.Range.get("B1:B9");
    chart.SeriesDataFromRange = false;
    chart.PlotArea.Visible = false;

    // Place the chart on the worksheet
    chart.TopRow = 10;
    chart.BottomRow = 28;
    chart.LeftColumn = 2;
    chart.RightColumn = 10;

    // Take the series and use the month column as its category labels
    const serie = chart.Series.get(0);
    serie.CategoryLabels = sheet.Range.get("A2:A9");

    // Give the category axis and the value axis their titles
    chart.PrimaryCategoryAxis.Title = "Month";
    chart.PrimaryValueAxis.Title = "Sales (CNY)";

    // Set both axis titles to size 12
    chart.PrimaryCategoryAxis.Font.Size = 12;
    chart.PrimaryValueAxis.Font.Size = 12;

    // Save the workbook
    const outputFileName = "AxisTitle.xlsx";
    workbook.SaveToFile({ fileName: outputFileName });

    // Dispose of the workbook object to free resources
    workbook.Dispose();

    // Read the result file from the VFS and trigger the download
    const fileArray = window.dotnetRuntime.Module.FS.readFile(outputFileName);
    const blob = new Blob([fileArray], { type: 'application/vnd.openxmlformats-officedocument.spreadsheetml.sheet' });
    const url = URL.createObjectURL(blob);
    const a = document.createElement('a');
    a.href = url;
    a.download = outputFileName;
    a.click();
    URL.revokeObjectURL(url);
  };

  return (
    <div style={{ textAlign: 'center', height: '300px' }}>
      <h1>Axis Titles</h1>
      <button onClick={setAxisTitle}>Start</button>
    </div>
  );
}

export default App;
After running, the effect of adding axis titles:
FAQ
MinorUnit is set but no minor tick marks show up
Cause: MinorUnit determines only the interval of the minor divisions — how many steps each major division is split into. Whether those steps are drawn as short strokes is decided by a separate property. MinorTickMark defaults to TickMarkNone, and in that state the interval is in effect but no strokes are drawn.
Fix: Set MinorTickMark at the same time, taking its value from TickMarkType:
const valueAxis = chart.PrimaryValueAxis;
valueAxis.MinorUnit = 500;
valueAxis.MinorTickMark = xlsModule.TickMarkType.TickMarkInside;
CrossesAt is set but the category axis does not move
Cause: CrossesAt determines where the category axis meets the value axis, and the move becomes visible only when it is set to a position on the scale other than the one the category axis already occupies. With the value axis starting at 0, the category axis already sits at the bottom of the axis line, so setting CrossesAt to 0 leaves it in place.
Fix: Set CrossesAt to another position on the value axis scale, 3000 for example, and the category axis moves up to that level:
const valueAxis = chart.PrimaryValueAxis;
valueAxis.MinValue = 0;
valueAxis.MaxValue = 5000;
valueAxis.CrossesAt = 3000;
Get a Free License
Spire.XLS for JavaScript offers a 30-day full-featured free trial license with no functional limitations. Apply here to evaluate before purchasing.
Set Excel Workbook Summary and Custom Properties in React
A workbook exported by a reporting system usually carries nothing but the system name as its author, with the title, subject and keywords left blank; teams meanwhile need to attach fields the export does not produce — an export batch, an owner, an approval state — for archiving and searching. None of this takes up a cell: it all lives in the workbook's document properties, which Excel shows under "File > Info > Properties". Spire.XLS for JavaScript writes them in the browser on top of WebAssembly, using a virtual file system (VFS) for input and output files, so no back-end service is needed.
This article covers three feature points:
- Set the summary properties of a workbook
- Add custom properties
- Update the value of a custom property
For installation and project setup, see Integrating Spire.XLS for JavaScript in a React Project. The examples below assume Spire.XLS is installed and the WebAssembly module has been initialised.
Set the summary properties of a workbook
The summary properties are the layer of description Excel shows in File Explorer and under "File > Info", and the first thing a search of the archive picks up. A workbook produced by a program usually has only the system name as its author and leaves the other entries blank; filling them in gives the file a readable context as it moves between people. The text entries take a plain assignment, while the two date entries have to be given a date object. The steps are:
- Load the workbook and take the summary property collection from
workbook.DocumentProperties. - Assign the text entries —
Title,Subject,Author,Keywords,CommentsandCategory— directly. - Assign
CompanyandManagerthe same way; Excel carries these two in its extended properties. - Set
CreatedTimeandLastSaveTimetoDateobjects. - Save the workbook.
Here is a complete code example showing how to set the summary properties of a workbook in React:
function App() {
  const setSummaryProperties = async () => {
    // Get the Spire.XLS WASM module
    const xlsModule = window.wasmModule?.spirexls;

    // Check that the module is ready
    if (!xlsModule) {
      alert('Spire.Xls is not ready yet');
      return;
    }

    // Load the font into the VFS
    await window.spire.FetchFileToVFS('ARIAL.TTF', '/Library/Fonts/', `${process.env.PUBLIC_URL}/font/`);

    // Load the Excel file into the VFS
    const inputFileName = 'WorkbookProperties.xlsx';
    await window.spire.FetchFileToVFS(inputFileName, '', `${process.env.PUBLIC_URL}data/`);

    // Load the workbook
    const workbook = new xlsModule.Workbook();
    workbook.LoadFromFile(inputFileName);

    // Set the text entries of the summary properties
    const summary = workbook.DocumentProperties;
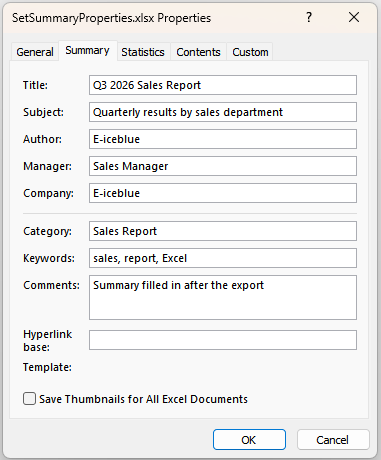
    summary.Title = 'Q3 2026 Sales Report';
    summary.Subject = 'Quarterly results by sales department';
    summary.Author = 'E-iceblue';
    summary.Keywords = 'sales, report, Excel';
    summary.Comments = 'Summary filled in after the export';
    summary.Category = 'Sales Report';

    // Set the entries carried by the extended properties
    summary.Company = 'E-iceblue';
    summary.Manager = 'Sales Manager';

    // Set the document dates; a Date object is required here
    summary.CreatedTime = new Date(2026, 8, 1);
    summary.LastSaveTime = new Date(2026, 8, 20);

    // Save the workbook
    const outputFileName = 'SetSummaryProperties.xlsx';
    workbook.SaveToFile(outputFileName);

    // Release resources
    workbook.Dispose();

    // Read the result file back out of the VFS and download it
    const fileArray = window.dotnetRuntime.Module.FS.readFile(outputFileName);
    const blob = new Blob([fileArray], { type: "application/vnd.openxmlformats-officedocument.spreadsheetml.sheet" });
    const url = URL.createObjectURL(blob);
    const a = document.createElement('a');
    a.href = url;
    a.download = outputFileName;
    a.click();
    URL.revokeObjectURL(url);
  };

  return (
    <div style={{ textAlign: 'center', height: '300px' }}>
      <h1>Set workbook summary properties</h1>
      <button onClick={setSummaryProperties}>Start</button>
    </div>
  );
}

export default App;
The effect of setting the summary properties of a workbook:
Add custom properties
Custom properties carry the business fields the summary properties have no room for, such as an export batch, a contact phone number, a revision number or an approval date. Unlike the summary properties they have no fixed set of entries: the caller decides the name and the type, and Excel accepts text, integer, decimal, boolean and date-and-time values. The steps are:
- Load the workbook and take the custom property collection from
workbook.CustomDocumentProperties. - Call
Addto append a property; the name and the value can be written as a named object such as{ strName, boolValue }, or passed directly as two arguments. - Pick the member that matches the type of the value:
intValuefor an integer,dblValuefor a decimal. - Pass a
Dateobject asdtValuefor a date-and-time value. - Save the workbook.
Here is a complete code example showing how to add custom properties to a workbook in React:
function App() {
  const addCustomProperties = async () => {
    // Get the Spire.XLS WASM module
    const xlsModule = window.wasmModule?.spirexls;

    // Check that the module is ready
    if (!xlsModule) {
      alert('Spire.Xls is not ready yet');
      return;
    }

    // Load the font into the VFS
    await window.spire.FetchFileToVFS('ARIAL.TTF', '/Library/Fonts/', `${process.env.PUBLIC_URL}/font/`);

    // Load the Excel file into the VFS
    const inputFileName = 'WorkbookProperties.xlsx';
    await window.spire.FetchFileToVFS(inputFileName, '', `${process.env.PUBLIC_URL}data/`);

    // Load the workbook
    const workbook = new xlsModule.Workbook();
    workbook.LoadFromFile(inputFileName);

    // Add a boolean property; _MarkAsFinal marks the document as final
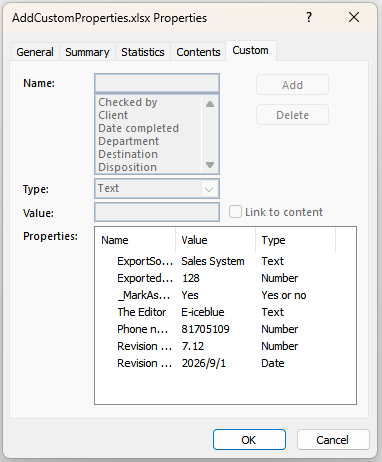
    workbook.CustomDocumentProperties.Add({ strName: '_MarkAsFinal', boolValue: true });

    // Add a text property; a name and a value can also be passed directly
    workbook.CustomDocumentProperties.Add('The Editor', 'E-iceblue');

    // Add an integer property
    workbook.CustomDocumentProperties.Add({ strName: 'Phone number', intValue: 81705109 });

    // Add a decimal property
    workbook.CustomDocumentProperties.Add({ strName: 'Revision number', dblValue: 7.12 });

    // Add a date and time property
    workbook.CustomDocumentProperties.Add({ strName: 'Revision date', dtValue: new Date(2026, 8, 1) });

    // Save the workbook
    const outputFileName = 'AddCustomProperties.xlsx';
    workbook.SaveToFile(outputFileName);

    // Release resources
    workbook.Dispose();

    // Read the result file back out of the VFS and download it
    const fileArray = window.dotnetRuntime.Module.FS.readFile(outputFileName);
    const blob = new Blob([fileArray], { type: "application/vnd.openxmlformats-officedocument.spreadsheetml.sheet" });
    const url = URL.createObjectURL(blob);
    const a = document.createElement('a');
    a.href = url;
    a.download = outputFileName;
    a.click();
    URL.revokeObjectURL(url);
  };

  return (
    <div style={{ textAlign: 'center', height: '300px' }}>
      <h1>Add custom properties</h1>
      <button onClick={addCustomProperties}>Start</button>
    </div>
  );
}

export default App;
The effect of adding custom properties:
Update the value of a custom property
The value of a business field changes with the way it is counted: an export record count, say, has to be rewritten to a new figure once the data is topped up. Custom properties offer no member that assigns a value directly, but Add is keyed on the name — calling it again for a name that already exists does not append a duplicate entry, it replaces the value of the existing one. The steps are:
- Load the workbook and take the custom property collection from
workbook.CustomDocumentProperties. - Call
Addagain, passing the same name as the existing entry together with the new value. - Save the workbook.
Here is a complete code example showing how to update a custom property of a workbook in React:
function App() {
  const updateCustomProperties = async () => {
    // Get the Spire.XLS WASM module
    const xlsModule = window.wasmModule?.spirexls;

    // Check that the module is ready
    if (!xlsModule) {
      alert('Spire.Xls is not ready yet');
      return;
    }

    // Load the font into the VFS
    await window.spire.FetchFileToVFS('ARIAL.TTF', '/Library/Fonts/', `${process.env.PUBLIC_URL}/font/`);

    // Load the Excel file into the VFS
    const inputFileName = 'WorkbookProperties.xlsx';
    await window.spire.FetchFileToVFS(inputFileName, '', `${process.env.PUBLIC_URL}data/`);

    // Load the workbook
    const workbook = new xlsModule.Workbook();
    workbook.LoadFromFile(inputFileName);

    // Rewrite the exported record count; adding an existing name overwrites it
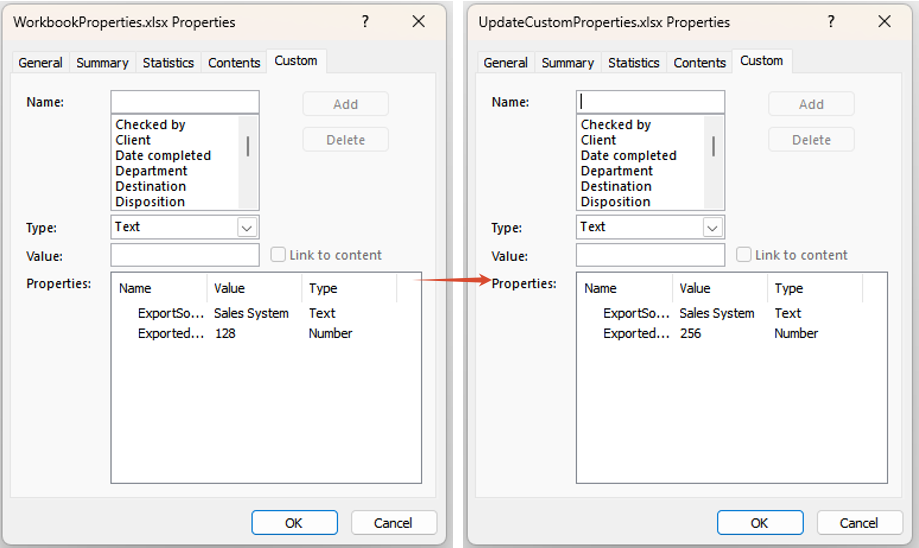
    workbook.CustomDocumentProperties.Add({ strName: 'ExportedRecords', intValue: 256 });

    // Save the workbook
    const outputFileName = 'UpdateCustomProperties.xlsx';
    workbook.SaveToFile(outputFileName);

    // Release resources
    workbook.Dispose();

    // Read the result file back out of the VFS and download it
    const fileArray = window.dotnetRuntime.Module.FS.readFile(outputFileName);
    const blob = new Blob([fileArray], { type: "application/vnd.openxmlformats-officedocument.spreadsheetml.sheet" });
    const url = URL.createObjectURL(blob);
    const a = document.createElement('a');
    a.href = url;
    a.download = outputFileName;
    a.click();
    URL.revokeObjectURL(url);
  };

  return (
    <div style={{ textAlign: 'center', height: '300px' }}>
      <h1>Update the value of a custom property</h1>
      <button onClick={updateCustomProperties}>Start</button>
    </div>
  );
}

export default App;
The effect of updating the value of a custom property:
FAQ
Why does assigning to CreatedTime throw "Assert failed: Value is not a Date"
Cause: CreatedTime and LastSaveTime take a JavaScript Date object and nothing else. A date string such as '2026-09-01', a timestamp number, or a hand-made object that only carries a toISOString() method all fail the type check and throw Assert failed: Value is not a Date.
Solution: build the Date with new Date(...) first, then assign it:
// 1 September 2026; months count from 0, so 8 means September
workbook.DocumentProperties.CreatedTime = new Date(2026, 8, 1);
Why does assigning to the Value of a custom property throw ArgumentNull_Generic
Cause: the Value property only reads. Assigning to it throws ArgumentNull_Generic Arg_ParamName_Name, value, and the original value does not change. Updating an existing property has to go through Add.
Solution: overwrite the original value with a same-name Add:
workbook.CustomDocumentProperties.Add({ strName: 'ExportedRecords', intValue: 256 });
Get a Free License
Spire.XLS for JavaScript offers a 30-day full-featured free trial license with no functional limitations. Apply here to evaluate before purchasing.
Add or Remove Cell Borders in Excel in React with JavaScript
The real dividers in a spreadsheet are not blank cells but borders: financial reports use lines of different weights to separate the header row from the totals, while data handed to a downstream system has to go out with the frames stripped off. Doing that by hand — selecting each block and opening Format Cells — is slow and hard to repeat. Spire.XLS for JavaScript does the same work in the browser on top of WebAssembly, using a virtual file system (VFS) for input and output files, so no back-end service is needed.
This article covers four feature points:
- Add a border to a selected cell or a cell range
- Add a border to the range that holds the data
- Add left, top, right, bottom and diagonal borders to a cell
- Remove the borders of a cell or a cell range
For installation and project setup, see Integrating Spire.XLS for JavaScript in a React Project. The examples below assume Spire.XLS is installed and the WebAssembly module has been initialised.
Add a border to a selected cell or a cell range
Given a table with no lines at all, the most direct approach is to put the frame back with BorderAround and BorderInside: the first one draws the outline, the second one the grid lines inside the range. Together they frame a whole block of data in one go, and they can also single out one cell — the header cell, say — so that it stands out from a sheet full of identical lines.
The steps are:
- Take the cell range you want to frame with
Range.get, by address - Call
BorderAroundto draw the outline, with the line style taken from theLineStyleTypeenumeration - Call
BorderInsideto add the separators between the cells inside the range - Take the header cell on its own and call
BorderAroundagain on it, this time with a medium line
The line style is passed in object notation, as { borderLine }.
function App() {
  const addBorderToCells = async () => {
    // Get the Spire.XLS WASM module
    const xlsModule = window.wasmModule?.spirexls;

    // Check that the module is ready
    if (!xlsModule) {
      alert('Spire.Xls is not ready yet');
      return;
    }

    // Load the font and the input file into the VFS
    await window.spire.FetchFileToVFS('ARIAL.TTF', '/Library/Fonts/', `${process.env.PUBLIC_URL}/font/`);
    const inputFileName = 'CellBorders.xlsx';
    await window.spire.FetchFileToVFS(inputFileName, '', `${process.env.PUBLIC_URL}data/`);

    // Load the workbook and take the first worksheet
    const workbook = new xlsModule.Workbook();
    workbook.LoadFromFile({ fileName: inputFileName });
    const sheet = workbook.Worksheets.get(0);

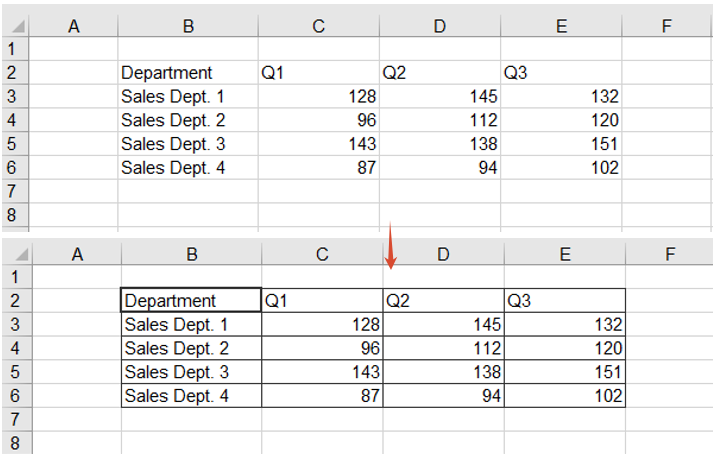
    // Take the B2:E6 range, frame it with thin lines and add thin inner lines
    const dataRange = sheet.Range.get('B2:E6');
    dataRange.BorderAround({ borderLine: xlsModule.LineStyleType.Thin });
    dataRange.BorderInside({ borderLine: xlsModule.LineStyleType.Thin });

    // Give the B2 header cell a medium border on all four sides
    sheet.Range.get('B2').BorderAround({ borderLine: xlsModule.LineStyleType.Medium });

    // Save the result file
    const outputFileName = 'AddBorderToCells.xlsx';
    workbook.SaveToFile({ fileName: outputFileName, version: xlsModule.ExcelVersion.Version2010 });

    // Dispose of the workbook object to free resources
    workbook.Dispose();

    // Read the result file back out of the VFS and download it
    const fileArray = window.dotnetRuntime.Module.FS.readFile(outputFileName);
    const blob = new Blob([fileArray], { type: 'application/vnd.openxmlformats-officedocument.spreadsheetml.sheet' });
    const url = URL.createObjectURL(blob);
    const a = document.createElement('a');
    a.href = url;
    a.download = outputFileName;
    a.click();
    URL.revokeObjectURL(url);
  };

  return (
    <div style={{ textAlign: 'center', height: '300px' }}>
      <h1>Add or Remove Cell Borders</h1>
      <button onClick={addBorderToCells}>Add a border to a cell or range</button>
    </div>
  );
}

export default App;
The effect of adding a border to the data range and to the header cell:
Add a border to the range that holds the data
The previous section hard-codes the address B2:E6, which has to be edited as soon as rows or columns are added to the table. The AllocatedRange property returns the allocated range of a worksheet — the rectangle that actually holds the data — so the address maintains itself, and the outline can be given a different style from the header frame to set the table apart from the text around it.
The steps are:
- Get the range that holds the data through
AllocatedRange, with no address to maintain - Call
BorderAroundwith a medium dashed line, so the outline contrasts with the solid frames used elsewhere - Call
BorderInsideto add thin lines inside the range, keeping the rows separated
function App() {
  const addBorderToDataRange = async () => {
    const xlsModule = window.wasmModule?.spirexls;
    if (!xlsModule) {
      alert('Spire.Xls is not ready yet');
      return;
    }

    await window.spire.FetchFileToVFS('ARIAL.TTF', '/Library/Fonts/', `${process.env.PUBLIC_URL}/font/`);
    const inputFileName = 'CellBorders.xlsx';
    await window.spire.FetchFileToVFS(inputFileName, '', `${process.env.PUBLIC_URL}data/`);

    const workbook = new xlsModule.Workbook();
    workbook.LoadFromFile({ fileName: inputFileName });
    const sheet = workbook.Worksheets.get(0);

    // AllocatedRange returns the range that holds the data, so no address is needed
    const dataRange = sheet.AllocatedRange;

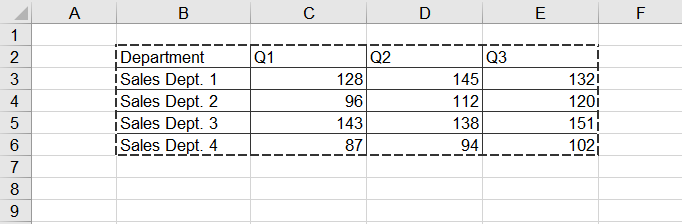
    // Give the outline a medium dashed border and the inside thin lines
    dataRange.BorderAround({ borderLine: xlsModule.LineStyleType.MediumDashed });
    dataRange.BorderInside({ borderLine: xlsModule.LineStyleType.Thin });

    const outputFileName = 'AddBorderToDataRange.xlsx';
    workbook.SaveToFile({ fileName: outputFileName, version: xlsModule.ExcelVersion.Version2010 });
    workbook.Dispose();

    const fileArray = window.dotnetRuntime.Module.FS.readFile(outputFileName);
    const blob = new Blob([fileArray], { type: 'application/vnd.openxmlformats-officedocument.spreadsheetml.sheet' });
    const url = URL.createObjectURL(blob);
    const a = document.createElement('a');
    a.href = url;
    a.download = outputFileName;
    a.click();
    URL.revokeObjectURL(url);
  };

  return (
    <div style={{ textAlign: 'center', height: '300px' }}>
      <h1>Add or Remove Cell Borders</h1>
      <button onClick={addBorderToDataRange}>Add a border to the data range</button>
    </div>
  );
}

export default App;
The effect of adding a dashed outline and thin inner lines to the data range:
Add left, top, right, bottom and diagonal borders to a cell
BorderAround gives all four edges the same style, which is not enough when the requirement is "a thick red line on the left and a double line along the bottom". Handling the edges one at a time solves it: Borders.get takes a single edge by its BordersLineType member, and its LineStyle and Color can then be set independently, so every edge can have its own line style and colour. The two diagonal directions are available the same way.
The steps are:
- Take the cell to style with
Range.get - Take the left, top, right and bottom edges through
Borders.get(BordersLineType.EdgeLeft)and its siblings - Set
LineStyleon each edge, using a thick line, a dotted line, a slanted dash-dot line and a double line - Set
Coloron each edge, using red, brown, dark grey and orange red - Take another cell, fetch its diagonal-down edge with
BordersLineType.DiagonalDownand set its line style
function App() {
  const addEdgeBorders = async () => {
    const xlsModule = window.wasmModule?.spirexls;
    if (!xlsModule) {
      alert('Spire.Xls is not ready yet');
      return;
    }

    await window.spire.FetchFileToVFS('ARIAL.TTF', '/Library/Fonts/', `${process.env.PUBLIC_URL}/font/`);
    const inputFileName = 'CellBorders.xlsx';
    await window.spire.FetchFileToVFS(inputFileName, '', `${process.env.PUBLIC_URL}data/`);

    const workbook = new xlsModule.Workbook();
    workbook.LoadFromFile({ fileName: inputFileName });
    const sheet = workbook.Worksheets.get(0);

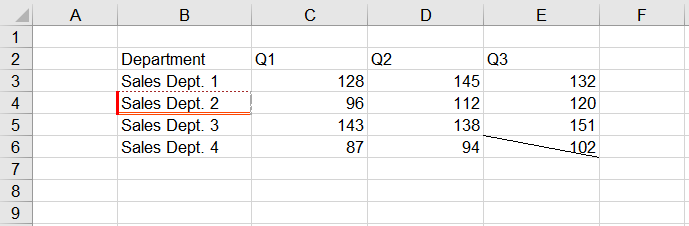
    // Give each of the four edges of B4 its own line style and colour
    const cell = sheet.Range.get('B4');
    const edgeSpecs = [
      ['EdgeLeft', xlsModule.LineStyleType.Thick, xlsModule.Color.get_Red()],
      ['EdgeTop', xlsModule.LineStyleType.Dotted, xlsModule.Color.get_Brown()],
      ['EdgeRight', xlsModule.LineStyleType.SlantedDashDot, xlsModule.Color.get_DarkGray()],
      ['EdgeBottom', xlsModule.LineStyleType.Double, xlsModule.Color.get_OrangeRed()],
    ];
    for (const [edge, lineStyle, color] of edgeSpecs) {
      const border = cell.Borders.get(xlsModule.BordersLineType[edge]);
      border.LineStyle = lineStyle;
      border.Color = color;
    }

    // Add a diagonal-down border to E6
    const diagonal = sheet.Range.get('E6').Borders.get(xlsModule.BordersLineType.DiagonalDown);
    diagonal.LineStyle = xlsModule.LineStyleType.Thin;

    const outputFileName = 'AddEdgeBorders.xlsx';
    workbook.SaveToFile({ fileName: outputFileName, version: xlsModule.ExcelVersion.Version2010 });
    workbook.Dispose();

    const fileArray = window.dotnetRuntime.Module.FS.readFile(outputFileName);
    const blob = new Blob([fileArray], { type: 'application/vnd.openxmlformats-officedocument.spreadsheetml.sheet' });
    const url = URL.createObjectURL(blob);
    const a = document.createElement('a');
    a.href = url;
    a.download = outputFileName;
    a.click();
    URL.revokeObjectURL(url);
  };

  return (
    <div style={{ textAlign: 'center', height: '300px' }}>
      <h1>Add or Remove Cell Borders</h1>
      <button onClick={addEdgeBorders}>Set the four edges and a diagonal</button>
    </div>
  );
}

export default App;
The effect of styling the four edges of a cell and adding a diagonal line:
Remove the borders of a cell or a cell range
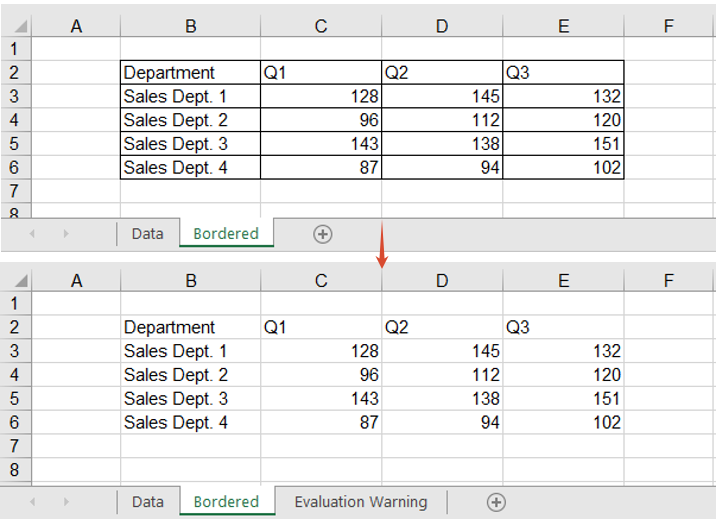
When an internal report goes out to a customer, or its data is fed to a downstream system, borders are often just noise: they make the data look like a finished report, and a parser that walks the sheet region by region can pick them up as content. Removing them is as simple as setting them — assign LineStyleType.None to the range's Borders.LineStyle and every line inside it goes at once.
The steps are:
- Take the worksheet that holds the framed report
- Take the cell range to clean up with
Range.get - Set the range's
Borders.LineStyletoLineStyleType.None, clearing every border inside it
function App() {
  const removeBorders = async () => {
    const xlsModule = window.wasmModule?.spirexls;
    if (!xlsModule) {
      alert('Spire.Xls is not ready yet');
      return;
    }

    await window.spire.FetchFileToVFS('ARIAL.TTF', '/Library/Fonts/', `${process.env.PUBLIC_URL}/font/`);
    const inputFileName = 'CellBorders.xlsx';
    await window.spire.FetchFileToVFS(inputFileName, '', `${process.env.PUBLIC_URL}data/`);

    const workbook = new xlsModule.Workbook();
    workbook.LoadFromFile({ fileName: inputFileName });

    // The second worksheet holds the same report, already framed with borders
    const sheet = workbook.Worksheets.get(1);

    // Set every border in the B2:E6 range to None
    sheet.Range.get('B2:E6').Borders.LineStyle = xlsModule.LineStyleType.None;

    const outputFileName = 'RemoveBorders.xlsx';
    workbook.SaveToFile({ fileName: outputFileName, version: xlsModule.ExcelVersion.Version2010 });
    workbook.Dispose();

    const fileArray = window.dotnetRuntime.Module.FS.readFile(outputFileName);
    const blob = new Blob([fileArray], { type: 'application/vnd.openxmlformats-officedocument.spreadsheetml.sheet' });
    const url = URL.createObjectURL(blob);
    const a = document.createElement('a');
    a.href = url;
    a.download = outputFileName;
    a.click();
    URL.revokeObjectURL(url);
  };

  return (
    <div style={{ textAlign: 'center', height: '300px' }}>
      <h1>Add or Remove Cell Borders</h1>
      <button onClick={removeBorders}>Remove cell borders</button>
    </div>
  );
}

export default App;
The effect of clearing every border inside the range:
FAQ
Setting a top edge on a whole range puts a line above every row
Cause: Borders.get(BordersLineType.EdgeTop) returns the top edge of every cell in the range, not the outline of the range itself. Used on B2:E6 as it stands, every row inside the range gets a top edge of its own, so four extra lines appear in the middle of the table.
Solution: narrow the range to a single row or column, and the edge that comes back sits on the outline. Take the top from the first row, the bottom from the last row, the left from the first column and the right from the last column:
// Top: the first row only
sheet.Range.get('B2:E2').Borders.get(xlsModule.BordersLineType.EdgeTop).LineStyle = xlsModule.LineStyleType.Thin;
// Bottom: the last row only
sheet.Range.get('B6:E6').Borders.get(xlsModule.BordersLineType.EdgeBottom).LineStyle = xlsModule.LineStyleType.Thin;
// Left: the first column only
sheet.Range.get('B2:B6').Borders.get(xlsModule.BordersLineType.EdgeLeft).LineStyle = xlsModule.LineStyleType.Thin;
// Right: the last column only
sheet.Range.get('E2:E6').Borders.get(xlsModule.BordersLineType.EdgeRight).LineStyle = xlsModule.LineStyleType.Thin;
BorderInside throws when it is called on a single cell
Cause: BorderInside means "the separators inside the range", and a single cell has no inside, so passing one throws This method doesn't support for single cell. No result file is written either.
Solution: use BorderAround to frame a single cell, or set its edges one at a time as in the previous section:
sheet.Range.get('B2').BorderAround({ borderLine: xlsModule.LineStyleType.Thin });
Get a Free License
Spire.XLS for JavaScript offers a 30-day full-featured free trial license with no functional limitations. Apply here to evaluate before purchasing.
Extract OLE Objects from Excel with JavaScript in React
Contracts, quotations and slide decks are often embedded straight into an Excel workbook: what you see on the sheet is an icon or a thumbnail, while the real document data sits in the xl/embeddings part of the package. Pulling those attachments out for archiving one by one means opening each object and saving a copy by hand.Spire.XLS for JavaScript does the job in the browser through WebAssembly, using a virtual file system (VFS) for the input and the output, with no backend service involved.
This article covers two feature points:
For installation and project configuration, see Integrating Spire.XLS for JavaScript in a React Project. The examples below assume Spire.XLS is installed and the WebAssembly module has finished initializing.
Read the OLE object information of a worksheet
Before extracting anything it helps to know what a workbook actually carries. A listing sets out the kind, original name, cell and size of every embedded object in one place and serves as an attachment register, so archiving or handing the file over does not mean double-clicking each icon in turn.
The steps are:
- Use
HasOleObjectsto check whether the worksheet holds any embedded objects, and stop early if it does not - Walk every object of the worksheet through the
OleObjectscollection - Read four pieces of information off each object:
ObjectType: the kind of object, such asWordDocumentorPowerPointPresentationOleOriginName: the file name the object had before it was embeddedLocation: the cell the object sits on- the length of
OleData: the data size
- Join the four fields into one line per object and write the listing to
ListOleObjects.txt
The example below collects those fields into a plain text listing:
function App() {
  const listOleObjects = async () => {
    // Get the Spire.XLS WASM module
    const xlsModule = window.wasmModule?.spirexls;

    // Check if the module is ready
    if (!xlsModule) {
      alert('Spire.Xls is not ready yet');
      return;
    }

    // Load the font and the input file into VFS
    await window.spire.FetchFileToVFS('simsun.ttc', '/Library/Fonts/', `${process.env.PUBLIC_URL}/font/`);
    const inputFileName = 'OLEObjects.xlsx';
    await window.spire.FetchFileToVFS(inputFileName, '', `${process.env.PUBLIC_URL}data/`);

    // Load the workbook and take the first worksheet
    const workbook = new xlsModule.Workbook();
    workbook.LoadFromFile({ fileName: inputFileName });
    const sheet = workbook.Worksheets.get(0);

    // Check whether the worksheet contains OLE objects
    if (!sheet.HasOleObjects) {
      alert('The worksheet contains no OLE objects.');
      return;
    }

    // Collect the listing as text: a header line, then one tab-separated line per object
    const lines = [['No.', 'Object Type', 'Original File Name', 'Location', 'Data Size (bytes)'].join('\t')];

    // Walk the OLE objects of the worksheet, one line per object
    let index = 1;
    for (const oleObject of sheet.OleObjects) {
      lines.push([
        index,
        String(oleObject.ObjectType),
        String(oleObject.OleOriginName),
        String(oleObject.Location.RangeAddress),
        oleObject.OleData.length,
      ].join('\t'));
      index += 1;
    }

    // Release the workbook object
    workbook.Dispose();

    // Write the listing to a text file in the VFS
    const outputFileName = 'ListOleObjects.txt';
    window.dotnetRuntime.Module.FS.writeFile(outputFileName, lines.join('\n'));

    // Read the result file from VFS and trigger the download
    const fileArray = window.dotnetRuntime.Module.FS.readFile(outputFileName);
    const blob = new Blob([fileArray], { type: 'text/plain;charset=utf-8' });
    const url = URL.createObjectURL(blob);
    const a = document.createElement('a');
    a.href = url;
    a.download = outputFileName;
    a.click();
    URL.revokeObjectURL(url);
  };

  return (
    <div style={{ textAlign: 'center', height: '300px' }}>
      <h1>List OLE Objects</h1>
      <button onClick={listOleObjects}>List OLE objects</button>
    </div>
  );
}

export default App;
The effect of reading the OLE object information:
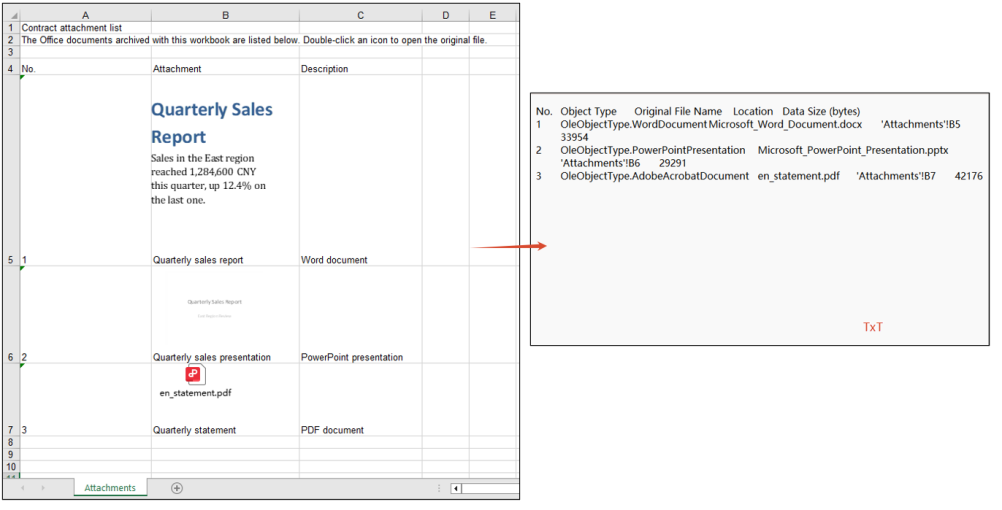
Extract OLE object payloads by type
A listing only says what is embedded; archiving the attachment itself means getting the document out. An OLE object carries its payload as a byte array, so writing those bytes out restores the document exactly as it was embedded, with no re-typesetting or format conversion.
The steps are:
- Use
HasOleObjectsto confirm the worksheet holds embedded objects - Walk every object in the
OleObjectscollection and decide the name and MIME type of the output file fromObjectType - Take the raw bytes of the object through
OleData, write them into the virtual file system, read them back and wrap them in a downloadable Blob - Dispose of the workbook once the walk is done, then trigger the downloads one by one
The example below walks every object of the worksheet and writes the Word, PowerPoint and PDF attachments out as .docx, .pptx and .pdf files, offering each one for download:
function App() {
  const extractOleObjects = async () => {
    // Get the Spire.XLS WASM module
    const xlsModule = window.wasmModule?.spirexls;

    // Check if the module is ready
    if (!xlsModule) {
      alert('Spire.Xls is not ready yet');
      return;
    }

    // Load the font and the input file into VFS
    await window.spire.FetchFileToVFS('simsun.ttc', '/Library/Fonts/', `${process.env.PUBLIC_URL}/font/`);
    const inputFileName = 'OLEObjects.xlsx';
    await window.spire.FetchFileToVFS(inputFileName, '', `${process.env.PUBLIC_URL}data/`);

    // Load the workbook and take the first worksheet
    const workbook = new xlsModule.Workbook();
    workbook.LoadFromFile({ fileName: inputFileName });
    const sheet = workbook.Worksheets.get(0);

    // Collect the extracted files so the page can offer them for download
    const results = [];

    // Walk the OLE objects of the worksheet and write each one out in its own format
    if (sheet.HasOleObjects) {
      for (const oleObject of sheet.OleObjects) {
        const type = oleObject.ObjectType;
        let outputFileName = '';
        let mimeType = '';

        // Word document
        if (type === xlsModule.OleObjectType.WordDocument) {
          outputFileName = 'ExtractWord.docx';
          mimeType = 'application/vnd.openxmlformats-officedocument.wordprocessingml.document';
        }
        // PowerPoint presentation: .pptx and .sldx fall under two different enum members
        else if (
          type === xlsModule.OleObjectType.PowerPointPresentation ||
          type === xlsModule.OleObjectType.PowerPointSlide
        ) {
          outputFileName = 'ExtractPowerPoint.pptx';
          mimeType = 'application/vnd.openxmlformats-officedocument.presentationml.presentation';
        }
        // PDF document
        else if (type === xlsModule.OleObjectType.AdobeAcrobatDocument) {
          outputFileName = 'ExtractPdf.pdf';
          mimeType = 'application/pdf';
        }

        // Any other type is left alone
        if (!outputFileName) continue;

        // Write the raw data of the object into the virtual file system
        window.dotnetRuntime.Module.FS.writeFile(outputFileName, oleObject.OleData);
        const fileArray = window.dotnetRuntime.Module.FS.readFile(outputFileName);
        results.push({
          name: outputFileName,
          url: URL.createObjectURL(new Blob([fileArray], { type: mimeType })),
        });
      }
    }

    // Release the workbook object
    workbook.Dispose();

    // Trigger the downloads one by one
    results.forEach(({ name, url }) => {
      const a = document.createElement('a');
      a.href = url;
      a.download = name;
      a.click();
      URL.revokeObjectURL(url);
    });
  };

  return (
    <div style={{ textAlign: 'center', height: '300px' }}>
      <h1>Extract OLE Objects</h1>
      <button onClick={extractOleObjects}>Extract OLE objects by type</button>
    </div>
  );
}

export default App;
The effect of extracting the attachment documents:
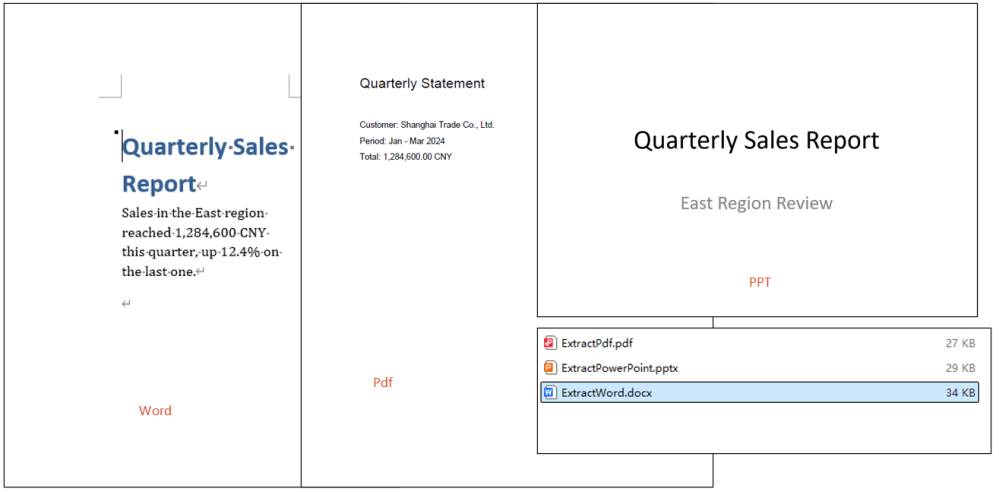
FAQ
OleObjectType.PowerPointSlide never matches a PowerPoint attachment
Cause: OleObjectType splits objects by the real format of the embedded file. A .pptx presentation reports PowerPointPresentation; only slideshow formats such as .sldx and .ppt land on PowerPointSlide, so testing for the latter alone misses the vast majority of PowerPoint attachments.
Solution: match both enum members in the branch, for example:
else if (
  type === xlsModule.OleObjectType.PowerPointPresentation ||
  type === xlsModule.OleObjectType.PowerPointSlide
) {
  outputFileName = 'ExtractPowerPoint.pptx';
}
Only the attachments of the first worksheet come out
Cause: OleObjects is a per-worksheet collection. The example takes the first sheet through Worksheets.get(0) and walks the OleObjects of that sheet alone, so objects embedded on any other worksheet are never visited. When the attachments are spread over several sheets, the extraction silently comes up short, with no error to show for it.
Solution: walk the worksheets instead, taking the OleObjects of each one in turn:
for (let i = 0; i < workbook.Worksheets.Count; i++) {
  const worksheet = workbook.Worksheets.get(i);
  for (const oleObject of worksheet.OleObjects) {
    // write the attachment out by type
  }
}
Get a Free License
Spire.XLS for JavaScript offers a 30-day full-featured free trial license with no functional limitations. Apply here to evaluate before purchasing.
Set Excel Print Titles and Print Order in React with JavaScript
When a report is generated in the browser, an order detail sheet often runs to several printed pages. With the default print settings, the header and the key columns disappear from the second page onwards, which makes the columns hard to identify and leaves the page numbers out of step with the rest of the report. Spire.XLS for JavaScript handles the page setup directly in the browser through WebAssembly, managing input and output files in a virtual file system (VFS) with no backend service required.
Using an order detail sheet of 18 columns by 60 rows as the sample, this article covers two core feature points:
For installation and project setup, see Integrating Spire.XLS for JavaScript in a React Project. The examples below assume Spire.XLS is installed and the WebAssembly module has been initialized.
Set the print title rows and columns
Print titles are what Excel calls the "Rows to repeat at top" and "Columns to repeat at left" options in the Page Setup dialog. Once set, the chosen rows or columns are repeated in the same position on every printed page, so the header is still visible once the table runs onto the second page. Spire.XLS for JavaScript sets them through the PrintTitleRows and PrintTitleColumns properties of PageSetup, which take a row or column reference string. Here is a complete code example showing how to set the print title rows and columns in React:
function App() {
  const setPrintTitles = async () => {
    // Get the Spire.XLS WASM module
    const xlsModule = window.wasmModule?.spirexls;

    // Check if the module is ready
    if (!xlsModule) {
      alert('Spire.Xls is not ready yet');
      return;
    }

    // Load the font and the input file into the VFS
    await window.spire.FetchFileToVFS('ARIAL.TTF', '/Library/Fonts/', `${process.env.PUBLIC_URL}/font/`);
    const inputFileName = 'OrderDetails.xlsx';
    await window.spire.FetchFileToVFS(inputFileName, '', `${process.env.PUBLIC_URL}data/`);

    // Load the workbook and get the first worksheet
    const workbook = new xlsModule.Workbook();
    workbook.LoadFromFile({ fileName: inputFileName });
    const sheet = workbook.Worksheets.get(0);

    // Get the page setup of the worksheet
    const pageSetup = sheet.PageSetup;

    // Use rows 1 and 2 as the print title rows, so they repeat at the top of every page
    pageSetup.PrintTitleRows = '$1:$2';

    // Use columns A and B as the print title columns, so they repeat at the left of every page
    pageSetup.PrintTitleColumns = '$A:$B';

    // Save the workbook
    const outputFileName = 'SetPrintTitles.xlsx';
    workbook.SaveToFile({ fileName: outputFileName, version: xlsModule.ExcelVersion.Version2010 });

    // Dispose of the workbook object to free resources
    workbook.Dispose();

    // Read the result file from the VFS and trigger the download
    const fileArray = window.dotnetRuntime.Module.FS.readFile(outputFileName);
    const blob = new Blob([fileArray], { type: 'application/vnd.openxmlformats-officedocument.spreadsheetml.sheet' });
    const url = URL.createObjectURL(blob);
    const a = document.createElement('a');
    a.href = url;
    a.download = outputFileName;
    a.click();
    URL.revokeObjectURL(url);
  };

  return (
    <div style={{ textAlign: 'center', height: '300px' }}>
      <h1>Set Print Title Rows and Columns</h1>
      <button onClick={setPrintTitles}>Set Print Title Rows and Columns</button>
    </div>
  );
}

export default App;
Print result of the original file
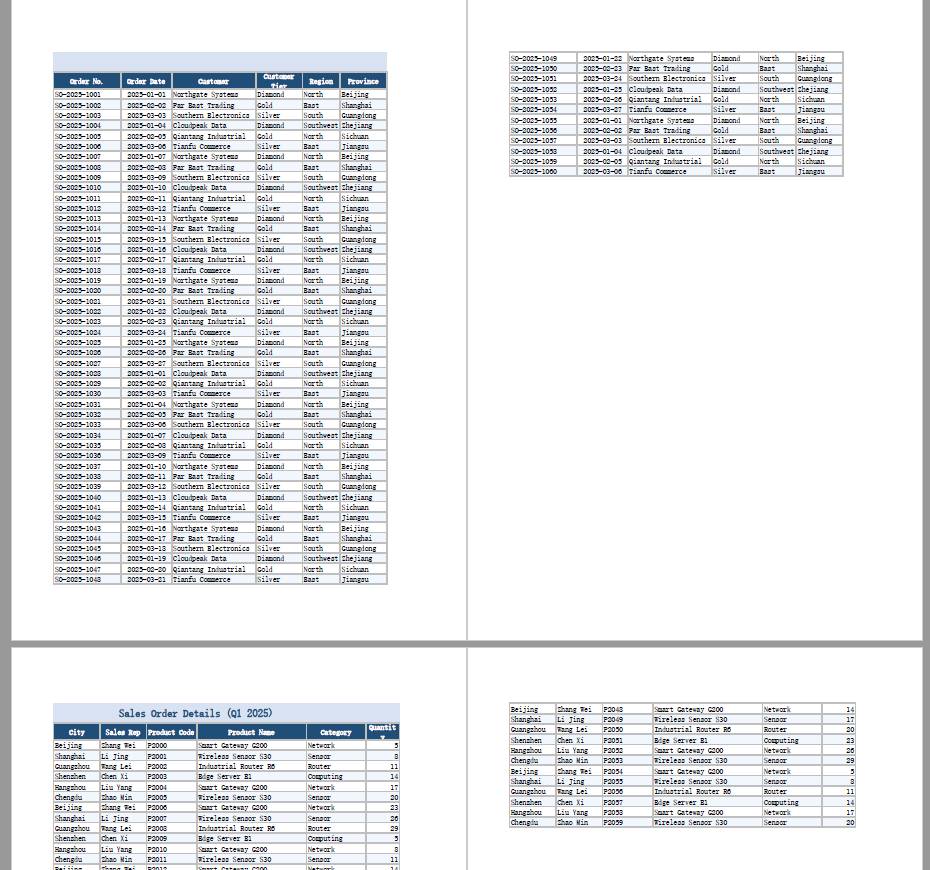
After running, the effect of setting the print title rows and columns:
Set the print order
When a worksheet is wider than one page and longer than one page at the same time, Excel has to decide which direction the pages advance in. The default, "down, then over", fills a page vertically before moving to the next block of columns on the right; "over, then down" fills a page horizontally first and then moves down. Spire.XLS for JavaScript switches between the two with the Order property of PageSetup. Here is a complete code example showing how to set the print order of a worksheet in React:
function App() {
  const setPrintOrder = async () => {
    // Get the Spire.XLS WASM module
    const xlsModule = window.wasmModule?.spirexls;

    // Check if the module is ready
    if (!xlsModule) {
      alert('Spire.Xls is not ready yet');
      return;
    }

    // Load the font and the input file into the VFS
    await window.spire.FetchFileToVFS('ARIAL.TTF', '/Library/Fonts/', `${process.env.PUBLIC_URL}/font/`);
    const inputFileName = 'OrderDetails.xlsx';
    await window.spire.FetchFileToVFS(inputFileName, '', `${process.env.PUBLIC_URL}data/`);

    // Load the workbook and get the first worksheet
    const workbook = new xlsModule.Workbook();
    workbook.LoadFromFile({ fileName: inputFileName });
    const sheet = workbook.Worksheets.get(0);

    // Get the page setup of the worksheet
    const pageSetup = sheet.PageSetup;

    // Set the page order to over-then-down: print a column top to bottom, then move right
    pageSetup.Order = xlsModule.OrderType.OverThenDown;

    // Save the workbook
    const outputFileName = 'SetPrintOrder.xlsx';
    workbook.SaveToFile({ fileName: outputFileName, version: xlsModule.ExcelVersion.Version2010 });

    // Dispose of the workbook object to free resources
    workbook.Dispose();

    // Read the result file from the VFS and trigger the download
    const fileArray = window.dotnetRuntime.Module.FS.readFile(outputFileName);
    const blob = new Blob([fileArray], { type: 'application/vnd.openxmlformats-officedocument.spreadsheetml.sheet' });
    const url = URL.createObjectURL(blob);
    const a = document.createElement('a');
    a.href = url;
    a.download = outputFileName;
    a.click();
    URL.revokeObjectURL(url);
  };

  return (
    <div style={{ textAlign: 'center', height: '300px' }}>
      <h1>Set Print Order</h1>
      <button onClick={setPrintOrder}>Set Print Order</button>
    </div>
  );
}

export default App;
After running, the effect of setting the print order to over-then-down:
FAQ
Can I set only the print title rows and not the title columns
Cause: PrintTitleRows and PrintTitleColumns are two independent properties — one controls the rows repeated at the top of each page, the other the columns repeated at the left. Setting only one leaves the other unset: the call is not rejected for the missing half, and no default is filled in.
Solution: Set whichever one you need. To repeat the header rows only, use pageSetup.PrintTitleRows = '$1:$2'.
Does setting the print titles change the data in the worksheet
Cause: Print titles are part of the page setup. They only decide which rows and columns are repeated in the printout; they do not touch cell contents, and they add or remove no rows and columns.
Solution: The data is unaffected. The file measures 62 rows by 18 columns both before and after the setting, with cell-by-cell identical text — the only difference is the print title definition added to the page setup. The worksheet looks exactly the same on screen.
Get a Free License
Spire.XLS for JavaScript offers a 30-day full-featured free trial license with no functional limitations. Apply here to evaluate before purchasing.
Set Excel Print Output Options in React with JavaScript
When an order detail sheet or a statement is exported for printing, the page setup decides whether the printed copy is actually readable: whether the table comes out with gridlines and row and column headings, how fine the output is, and whether comments travel with it. These switches are scattered across several tabs of the Excel Page Setup dialog, which makes them tedious to tick one by one.Spire.XLS for JavaScript handles the page setup in the browser through WebAssembly, using a virtual file system (VFS) for the input and the output, with no backend service involved.
This article takes an 18-column by 60-row order detail sheet and covers three feature points:
- Set the print quality and draft quality
- Print gridlines and row and column headings
- Set black and white printing, comments and error values
For installation and project configuration, see Integrating Spire.XLS for JavaScript in a React Project. The examples below assume Spire.XLS is installed and the WebAssembly module has finished initializing.
Set the print quality and draft quality
Print quality sets the number of ink dots per inch in the printed output and takes a plain integer in dpi; draft quality lets the printer run faster with less toner, which suits a proof that only circulates internally. Spire.XLS for JavaScript exposes both through the PrintQuality and Draft members of PageSetup:
PrintQuality = 72prints at 72 dpi, a low setting that lets the page come out faster with less consumableDraft = trueturns on draft quality, trading fine detail for speed
The complete example code is as follows:
function App() {
  const setPrintQuality = async () => {
    // Get the Spire.XLS WASM module
    const xlsModule = window.wasmModule?.spirexls;

    // Make sure the module is ready
    if (!xlsModule) {
      alert('Spire.Xls is not ready yet');
      return;
    }

    // Load the font and the input file into the VFS
    await window.spire.FetchFileToVFS('ARIAL.TTF', '/Library/Fonts/', `${process.env.PUBLIC_URL}/font/`);
    const inputFileName = 'OrderDetails.xlsx';
    await window.spire.FetchFileToVFS(inputFileName, '', `${process.env.PUBLIC_URL}data/`);

    // Load the workbook and take its first worksheet
    const workbook = new xlsModule.Workbook();
    workbook.LoadFromFile({ fileName: inputFileName });
    const sheet = workbook.Worksheets.get(0);

    // Get the page setup of the worksheet
    const pageSetup = sheet.PageSetup;

    // Set the print quality to 72 dpi
    pageSetup.PrintQuality = 72;

    // Turn on draft quality: speed matters more than fine detail
    pageSetup.Draft = true;

    // Save the workbook
    const outputFileName = 'SetPrintQuality.xlsx';
    workbook.SaveToFile({ fileName: outputFileName, version: xlsModule.ExcelVersion.Version2010 });

    // Release the workbook to free its resources
    workbook.Dispose();

    // Read the result file back from the VFS to trigger the download
    const fileArray = window.dotnetRuntime.Module.FS.readFile(outputFileName);
    const blob = new Blob([fileArray], { type: 'application/vnd.openxmlformats-officedocument.spreadsheetml.sheet' });
    const url = URL.createObjectURL(blob);
    const a = document.createElement('a');
    a.href = url;
    a.download = outputFileName;
    a.click();
    URL.revokeObjectURL(url);
  };

  return (
    <div style={{ textAlign: 'center', height: '300px' }}>
      <h1>Set print quality and draft quality</h1>
      <button onClick={setPrintQuality}>Set print quality and draft quality</button>
    </div>
  );
}

export default App;
The original file as printed:
The effect of the print quality and draft quality settings:
Print gridlines and row and column headings
The gridlines on screen do not travel with the data when the sheet is printed, so a sheet without borders of its own reaches paper as a field of floating values that is hard to check cell by cell. Row and column headings have the same problem: printing them is what lets a printed copy be discussed in the same C5, D7 terms used in Excel. The two boolean members IsPrintGridlines and IsPrintHeadings control them. The complete example code is as follows:
function App() {
  const setGridlinesAndHeadings = async () => {
    // Get the Spire.XLS WASM module
    const xlsModule = window.wasmModule?.spirexls;

    // Make sure the module is ready
    if (!xlsModule) {
      alert('Spire.Xls is not ready yet');
      return;
    }

    // Load the font and the input file into the VFS
    await window.spire.FetchFileToVFS('ARIAL.TTF', '/Library/Fonts/', `${process.env.PUBLIC_URL}/font/`);
    const inputFileName = 'OrderDetails.xlsx';
    await window.spire.FetchFileToVFS(inputFileName, '', `${process.env.PUBLIC_URL}data/`);

    // Load the workbook and take its first worksheet
    const workbook = new xlsModule.Workbook();
    workbook.LoadFromFile({ fileName: inputFileName });
    const sheet = workbook.Worksheets.get(0);

    // Get the page setup of the worksheet
    const pageSetup = sheet.PageSetup;

    // Print the gridlines along with the data
    pageSetup.IsPrintGridlines = true;

    // Print the row and column headings along with the data
    pageSetup.IsPrintHeadings = true;

    // Save the workbook
    const outputFileName = 'SetGridlinesAndHeadings.xlsx';
    workbook.SaveToFile({ fileName: outputFileName, version: xlsModule.ExcelVersion.Version2010 });

    // Release the workbook to free its resources
    workbook.Dispose();

    // Read the result file back from the VFS to trigger the download
    const fileArray = window.dotnetRuntime.Module.FS.readFile(outputFileName);
    const blob = new Blob([fileArray], { type: 'application/vnd.openxmlformats-officedocument.spreadsheetml.sheet' });
    const url = URL.createObjectURL(blob);
    const a = document.createElement('a');
    a.href = url;
    a.download = outputFileName;
    a.click();
    URL.revokeObjectURL(url);
  };

  return (
    <div style={{ textAlign: 'center', height: '300px' }}>
      <h1>Print gridlines and headings</h1>
      <button onClick={setGridlinesAndHeadings}>Print gridlines and headings</button>
    </div>
  );
}

export default App;
The effect of printing the gridlines and the row and column headings:
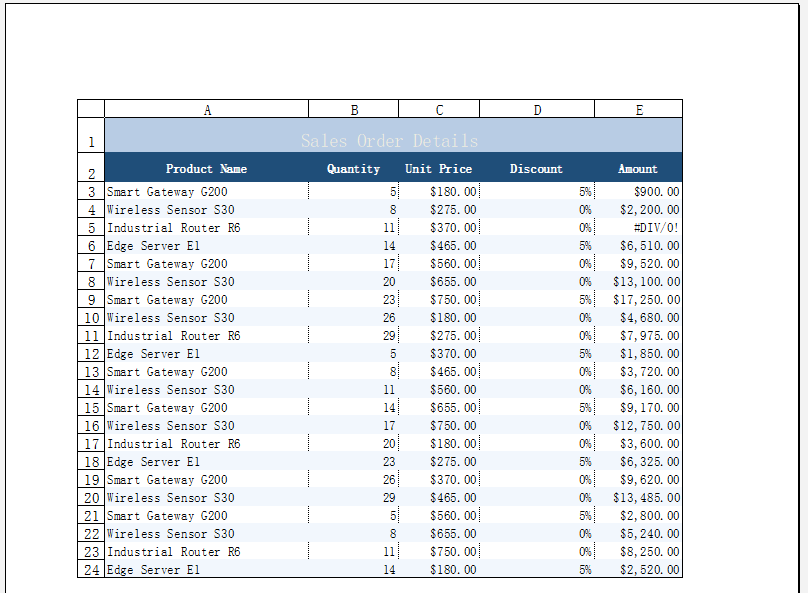
Set black and white printing, comments and error values
The remaining three output switches also live on PageSetup, and they decide what colour the printed copy comes out in, whether comments travel with the sheet, and how errors are shown. The three members and their values:
BlackAndWhiteset totrueprints in black and white, turning colour content into greyscale, which is especially useful with a mono laser printerPrintCommentsset toInPlaceprints each comment box where it sits on the sheet; the comment has to be shown first — one that is not displayed is not printedPrintErrorsset toNAshows every error value such as#DIV/0!as#N/Aon paper, keeping internal formula errors out of sight
The complete example code is as follows:
function App() {
  const setOtherPrintOptions = async () => {
    // Get the Spire.XLS WASM module
    const xlsModule = window.wasmModule?.spirexls;

    // Make sure the module is ready
    if (!xlsModule) {
      alert('Spire.Xls is not ready yet');
      return;
    }

    // Load the font and the input file into the VFS
    await window.spire.FetchFileToVFS('ARIAL.TTF', '/Library/Fonts/', `${process.env.PUBLIC_URL}/font/`);
    const inputFileName = 'OrderDetails.xlsx';
    await window.spire.FetchFileToVFS(inputFileName, '', `${process.env.PUBLIC_URL}data/`);

    // Load the workbook and take its first worksheet
    const workbook = new xlsModule.Workbook();
    workbook.LoadFromFile({ fileName: inputFileName });
    const sheet = workbook.Worksheets.get(0);

    // Get the page setup of the worksheet
    const pageSetup = sheet.PageSetup;

    // The sample carries one comment, on cell A18
    // Show it first: a comment that is not displayed is not printed
    sheet.Range.get('A18').Comment.Visible = true;

    // Print the worksheet in black and white
    pageSetup.BlackAndWhite = true;

    // Print comments where they appear on the worksheet
    pageSetup.PrintComments = xlsModule.PrintCommentType.InPlace;

    // Print every cell error as #N/A
    pageSetup.PrintErrors = xlsModule.PrintErrorsType.NA;

    // Save the workbook
    const outputFileName = 'SetOtherPrintOptions.xlsx';
    workbook.SaveToFile({ fileName: outputFileName, version: xlsModule.ExcelVersion.Version2010 });

    // Release the workbook to free its resources
    workbook.Dispose();

    // Read the result file back from the VFS to trigger the download
    const fileArray = window.dotnetRuntime.Module.FS.readFile(outputFileName);
    const blob = new Blob([fileArray], { type: 'application/vnd.openxmlformats-officedocument.spreadsheetml.sheet' });
    const url = URL.createObjectURL(blob);
    const a = document.createElement('a');
    a.href = url;
    a.download = outputFileName;
    a.click();
    URL.revokeObjectURL(url);
  };

  return (
    <div style={{ textAlign: 'center', height: '300px' }}>
      <h1>Set black and white, comments and errors</h1>
      <button onClick={setOtherPrintOptions}>Set black and white, comments and errors</button>
    </div>
  );
}

export default App;
The effect of the black and white, comment and error value settings:
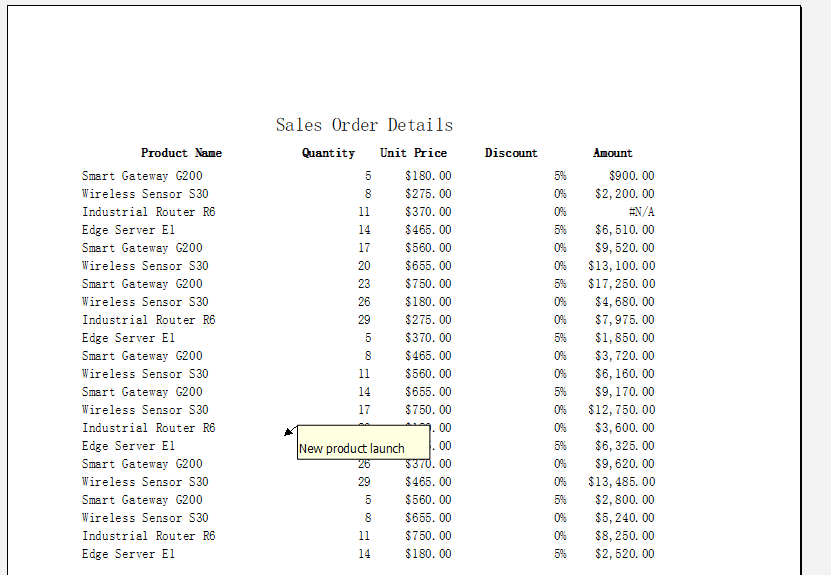
FAQ
The sheet still runs to several pages, and lowering the print quality did not help
Cause: print quality and draft quality only decide how fine the output is and how much ink it uses; they do not change the layout of the content, so no setting of theirs moves a page break. Fitting a whole sheet onto one page is a matter of page scaling, which has nothing to do with print quality. Setting both at once is not a conflict — each one simply does its own job.
Solution: use FitToPagesWide and FitToPagesTall to squeeze the worksheet into a given number of pages, where 1 means one page wide and one page tall:
// Scale the worksheet onto one page wide and one page tall
pageSetup.FitToPagesWide = 1;
pageSetup.FitToPagesTall = 1;
Set together with the print quality, both survive:
<pageSetup fitToHeight="1" fitToWidth="1" horizontalDpi="72" verticalDpi="72" orientation="portrait" paperSize="9" />
The worksheet looks exactly the same after setting PrintQuality and Draft
Cause: both act on the printer output only and leave the worksheet's own content and display untouched, so the document looks no different once they are set. That is expected, and does not mean the setting failed to apply.
Solution: the print quality and the draft quality are written into the result file. To confirm they took effect, unzip the result file and look at xl/worksheets/sheet1.xml: the print quality lands on the horizontalDpi and verticalDpi of <pageSetup>, and the draft quality shows up as draft="1" on the same element. This example sets both, giving:
<pageSetup draft="1" horizontalDpi="72" verticalDpi="72" orientation="portrait" paperSize="9" />
Note that what Draft actually does depends on the printer driver — some drivers ignore the switch, and the attribute is written into the file either way.
Get a Free License
Spire.XLS for JavaScript offers a 30-day full-featured free trial license with no functional limitations. Apply here to evaluate before purchasing.
Generate PPT Speaker Notes and Script with Spire.Agent.Office
When you build a presentation, the part that really costs time is rarely the layout — it is deciding what to say. A slide only has room for the essentials: a few short lines, a set of numbers, one chart. The words that actually need to be spoken live in the author's head. The night before the talk, the author reads the whole deck again, slide by slide, trying to remember what each page was meant to say, and then writes it up.
It gets worse when a team is involved. For a product launch, one person writes the content, another builds the slides, and a third delivers the talk. Whoever steps on stage inherits a deck of bullet points with no idea which numbers matter most — so they improvise. Speaker notes exist precisely for this: they never appear on the projector, only in Presenter View, as the author's message to the speaker. In practice, almost nobody has the patience to fill them in page by page.
The PowerPoint AI capability in Spire.Agent.Office lets you describe in plain language what the notes should say and what tone the script should take. The AI agent reads the title and bullet points of every slide and then handles two jobs: writing speaker notes for each slide, and expanding the whole deck into a Word script that can be read aloud directly.
Compared with the Traditional SDK API
| Traditional Spire.Office for .NET API | Spire.Agent.Office | |
|---|---|---|
| Driving model | Loop over slides, pull text out of each shape, assemble the copy yourself, then write it back to the notes page — every step is code | Describe the writing requirements in natural language and let the AI plan the execution path |
| Code size | 150-300 lines of C# (slide iteration, shape traversal, text extraction, notes-page writing, font and paragraph settings) | About 10 lines of calling code plus one natural-language instruction |
| Content generation | You must wire up a model yourself or hand-write templates, and it is hard to keep each slide in context | The AI understands each slide's points and writes copy that reads coherently page to page |
| Layout handling | Writing notes easily damages the original layout and placeholder structure | The AI preserves the original layout, fonts and colours, appending only to the notes pane |
| Changing requirements | Adjust tone, length or script format → edit code → rebuild → redeploy | Edit the wording of the instruction and it takes effect immediately |
This article shows how to use Spire.Agent.Office to generate speaker notes and a script for a PowerPoint deck. Two cases cover the two common patterns — adding notes to an existing deck and turning a report into a Word script:
- Case 1: Generate per-slide speaker notes for a deck
- Case 2: Turn a business review into a ready-to-read Word script
For product installation and SpireToken configuration, please refer to Integrating Spire.Agent.Office in a .NET Project. The examples below assume Spire.Agent.Office is installed and SpireToken is configured.
Case 1: Generate per-slide speaker notes for a deck
The most common situation is a deck that is already final: layout and content stay exactly as they are, and the only thing missing is the prompt for whoever has to speak. A projected slide is built to be read at a glance, so it carries a title and a few bullet points — where the emphasis falls, what is behind each number, and how to move from one page to the next all stay in the author's head. Speaker notes are what carry that across. They are the author's handover to the presenter: what this page is really getting at, what to stress, and how to lead naturally into the next one. This product launch deck has 8 slides, each with a title and a few bullet points, and an empty notes pane from start to finish. The presenter needs one short paragraph per slide — not an essay, but enough to present the deck rather than read it out. Writing those notes by hand is expensive because every slide needs its own thought. Read the page, rebuild the sentence, and calibrate length — too short and it is no help, too long and it turns into reading from a script. Eight slides is tolerable; a fifty-page annual review rarely gets the treatment it deserves.
The example below uses the Spire.Agent.Office agent to read every slide and write speaker notes into the notes pane, ready to be read aloud:
using Spire.Agent.Office.AI;
using Spire.Agent.Office.Extensions;
using Spire.Presentation;

// PowerPoint processing configuration
string inputPath = @"E:\product-launch.pptx";  // Deck to add speaker notes to
string savePath = @"E:\product_result.pptx";  // Result document path

string key = "**************************";  // SpireToken key
string instruction = "Generate speaker notes for each slide of the input PPT file and write them into the notes pane of that slide: " +
"1. Read each slide's title and bullet points and understand what the page is meant to convey; " +
"2. Write one paragraph of speaker notes per slide, in the presenter's voice, ready to be read aloud; " +
"3. Each note should make clear what this page emphasises and lead naturally into the next slide; keep the notes varied in depth — explain the important content in detail and keep transition slides brief; " +
"4. Keep the original slide layout, fonts, colours and page order completely unchanged, and do not add or remove any slides; " +
"Finally, save the output as a PowerPoint file";

// Call the PowerPoint processing function
AIResult result = ExecuteDemoPpt(instruction, inputPath, savePath, key);

// Run the PowerPoint AI processing
static AIResult ExecuteDemoPpt(string instruction, string inputPath, string savePath, string key)
{
    // Create the AIOptions configuration object
    AIOptions options = new AIOptions();
    options.SpireToken = key;  // Set the SpireToken key

    // Process the PowerPoint document with a Presentation object
    using (Presentation ppt = new Presentation())
    {
        // Load the PowerPoint document from file
        if (!string.IsNullOrEmpty(inputPath) && File.Exists(inputPath))
        {
            ppt.LoadFromFile(inputPath);
        }
        // Create the AI document processor
        AIDocumentProcessor processor = ppt.AI(options);

        // Execute the AI instruction
        return processor.ExecuteInstruction(ppt, instruction, savePath);
    }
}
The original deck with an empty notes pane
 The deck after speaker notes were written slide by slide

The generated deck looks identical to the original on the projector; the notes appear only in Presenter View. The speaker opens Presenter View and sees the prompt for each slide below it, ready to deliver a complete product launch in order.
Case 2: Turn a business review into a ready-to-read Word script
The notes pane is good for prompting, but not for reading aloud. Notes are short fragments in a small font at the edge of the screen; looking down at them on stage hurts delivery and invites missed lines. When the occasion is more formal — reporting quarterly results to management, for instance, where every figure has to be explained — the speaker needs a complete, spoken-word script. The medium for that script deserves a word of its own. A presentation is made to be looked at; a script is made to be read. A script needs control over font size, line spacing and sectioning, and it is usually printed and carried into the room. Packing several hundred words of body text onto each slide reads badly — and projecting it hands the audience every line. So this case takes a PPT as input and produces a Word script document as output.
Handling that format change is exactly what Spire.Agent.Office does: the deck is still loaded with Presentation, the AI reads each slide, and it writes the script as a Word file following the instruction. So this case has the AI read the figures page by page and then write the script as sections in the original order: each slide of the original becomes one section of the script document, keeping the original title, with the body holding the full script text.
The example below uses the Spire.Agent.Office agent to interpret the figures page by page and write the script, producing a Word document:
using Spire.Agent.Office.AI;
using Spire.Agent.Office.Extensions;
using Spire.Presentation;

// PowerPoint processing configuration
string inputPath = @"E:\quarterly-review.pptx";  // Input presentation path
string savePath = null;  // Result document path (null here, the output folder below is used instead)
string OutDir = @"E:\output-script";  // Output directory
string key = "**************************";  // SpireToken key
string instruction =
    "Read the input PPT file and write a complete presentation script for the speaker, outputting it as a Word script document: " +
    "1. Read the figures and bullet points on each slide and understand the core conclusion of that page; " +
    "2. Write a complete, conversational script per slide that can be read aloud directly; keep it varied in depth, quote the specific figures on that page and explain what they mean for the business; " +
    "3. Lay the script out as sections in the original slide order, each headed 'Slide N + the original title', with the full script for that page as the body; " +
    "4. Format the body for reading aloud: a clear typeface, no smaller than 14 pt, 1.5 line spacing, comfortable paragraph spacing;";

// Call the PowerPoint processing function
AIResult result = ExecuteDemoPpt(instruction, inputPath, savePath, key, OutDir);

// Run the PowerPoint AI processing
static AIResult ExecuteDemoPpt(string instruction, string inputPath, string savePath, string key, string output)
{
    // Create the AIOptions configuration object
    AIOptions options = new AIOptions();
    options.WorkDir = output;  // Set the working directory to the output directory
    options.SpireToken = key;  // Set the SpireToken key

    // Process the PowerPoint document with a Presentation object
    using (Presentation ppt = new Presentation())
    {
        // Load the PowerPoint document from file
        if (!string.IsNullOrEmpty(inputPath) && File.Exists(inputPath))
        {
            ppt.LoadFromFile(inputPath);
        }
        // Create the AI document processor
        AIDocumentProcessor processor = ppt.AI(options);

        // Execute the AI instruction
        return processor.ExecuteInstruction(ppt, instruction, savePath);
    }
}
The generated Word script document
FAQ
Can I use my own model or a private deployment?
Note: By default the AI requests go to Spire's model service. AIOptions also exposes Model, BaseUrl and ApiKey for the model name, the service address and the access key — set these three to route the requests to your own or a third-party inference service.
AIOptions options = new AIOptions();
options.BaseUrl = "baseUrl";
options.Model = "modelName";
options.SpireToken = "*************";
options.ApiKey = "*************";
A long deck is slow to process — and may time out
Cause: Notes and scripts are generated page by page, so the AI reads and writes the document repeatedly and sends the existing content back to the model each time. The more slides there are, and the denser the text on each, the faster token consumption grows and the longer the whole run takes — the default timeout is often not enough.
Solution: Set TimeoutMs explicitly on the AIOptions instance (the unit is milliseconds) so a long deck has enough time. For a 50-slide PPT file, TimeoutMs can be set to 10 minutes (600000).
Getting a SpireToken Key
- Contact sales@e-iceblue.com or visit https://www.e-iceblue.com/TemLicense.html for a trial or commercial API key
Configure it in code:
AIOptions options = new AIOptions();
options.SpireToken = key;