Set the Alignment, Indent, Orientation and Wrapping of Excel Cell Text in React with JavaScript
How readable a table is often has nothing to do with the data itself and everything to do with how the text sits inside its cells. Titles need to be centred, amounts need to be pushed right, multi-line descriptions need to be indented, a long sentence in a narrow column needs to fold, and a header set at an angle fits more information into limited column width. All of these are cell text layout settings. Spire.XLS for JavaScript performs them directly in the browser through WebAssembly, managing input and output files with a virtual file system (VFS) and requiring no backend service.
This article covers four key features:
- Set the Alignment of Text
- Set the Indent of Text
- Set the Orientation of Text
- Set the Wrapping of Text
For installation and project setup, see Integrating Spire.XLS for JavaScript in a React Project. The examples below assume Spire.XLS is already installed and the WebAssembly module has been initialized.
Set the Alignment of Text
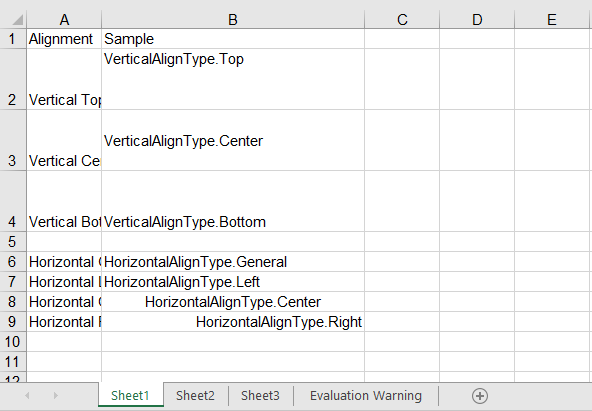
Alignment works along two axes. Vertical alignment decides where the text sits within the height of the cell and is set through the VerticalAlignment property, which accepts Top, Center, Bottom and others. Horizontal alignment decides where the text sits within the width of the cell and is set through the HorizontalAlignment property, which accepts General, Left, Center, Right and others. The two are independent and can be combined freely. The steps are as follows:
- Create a workbook and get the first worksheet.
- Write the sample text.
- Set the vertical alignment through
VerticalAlignment. - Set the horizontal alignment through
HorizontalAlignment. - Save the workbook.
Here is a complete code example that sets the alignment of cell text in React:
function App() {
  const setTextAlignment = async () => {
    // Get the Spire.XLS WASM module
    const xlsModule = window.wasmModule?.spirexls;

    // Check if the module is ready
    if (!xlsModule) {
      alert('Spire.Xls is not ready yet');
      return;
    }

    // Load the font into VFS
    await window.spire.FetchFileToVFS('ARIAL.TTF', '/Library/Fonts/', `${process.env.PUBLIC_URL}/font/`);

    // Create a new workbook
    const workbook = new xlsModule.Workbook();

    // Get the first worksheet
    const sheet = workbook.Worksheets.get(0);

    // Write the sample text for vertical alignment
    sheet.Range.get("A1").Text = "Alignment";
    sheet.Range.get("B1").Text = "Sample";
    sheet.Range.get("A2").Text = "Vertical Top";
    sheet.Range.get("B2").Text = "VerticalAlignType.Top";
    sheet.Range.get("A3").Text = "Vertical Center";
    sheet.Range.get("B3").Text = "VerticalAlignType.Center";
    sheet.Range.get("A4").Text = "Vertical Bottom";
    sheet.Range.get("B4").Text = "VerticalAlignType.Bottom";

    // Write the sample text for horizontal alignment
    sheet.Range.get("A6").Text = "Horizontal General";
    sheet.Range.get("B6").Text = "HorizontalAlignType.General";
    sheet.Range.get("A7").Text = "Horizontal Left";
    sheet.Range.get("B7").Text = "HorizontalAlignType.Left";
    sheet.Range.get("A8").Text = "Horizontal Center";
    sheet.Range.get("B8").Text = "HorizontalAlignType.Center";
    sheet.Range.get("A9").Text = "Horizontal Right";
    sheet.Range.get("B9").Text = "HorizontalAlignType.Right";

    // Set the vertical alignment
    sheet.Range.get("B2").Style.VerticalAlignment = xlsModule.VerticalAlignType.Top;
    sheet.Range.get("B3").Style.VerticalAlignment = xlsModule.VerticalAlignType.Center;
    sheet.Range.get("B4").Style.VerticalAlignment = xlsModule.VerticalAlignType.Bottom;

    // Set the horizontal alignment
    sheet.Range.get("B6").Style.HorizontalAlignment = xlsModule.HorizontalAlignType.General;
    sheet.Range.get("B7").Style.HorizontalAlignment = xlsModule.HorizontalAlignType.Left;
    sheet.Range.get("B8").Style.HorizontalAlignment = xlsModule.HorizontalAlignType.Center;
    sheet.Range.get("B9").Style.HorizontalAlignment = xlsModule.HorizontalAlignType.Right;

    // Widen column B and raise rows 2-4 so the alignment differences are visible
    sheet.Range.get("B1:B9").ColumnWidth = 32;
    sheet.Range.get("A2:B4").RowHeight = 40;

    // Save the workbook
    const outputFileName = "TextAlignment.xlsx";
    workbook.SaveToFile(outputFileName);

    // Release resources
    workbook.Dispose();

    // Read the result file from VFS and trigger the download
    const fileArray = window.dotnetRuntime.Module.FS.readFile(outputFileName);
    const blob = new Blob([fileArray], { type: "application/vnd.openxmlformats-officedocument.spreadsheetml.sheet" });
    const url = URL.createObjectURL(blob);
    const a = document.createElement('a');
    a.href = url;
    a.download = outputFileName;
    a.click();
    URL.revokeObjectURL(url);
  };

  return (
    <div style={{ textAlign: 'center', height: '300px' }}>
      <h1>Set Text Alignment</h1>
      <button onClick={setTextAlignment}>Start</button>
    </div>
  );
}

export default App;
Vertical alignment is only visible once the row is tall enough, which is why the example sets rows 2-4 to a height of 40; horizontal alignment is at its clearest once the column is wide enough.
After running, the effect of setting the alignment of text:
Set the Indent of Text
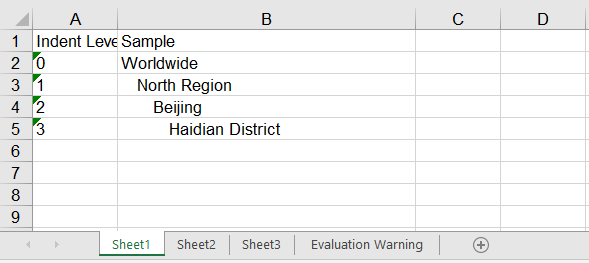
Indentation leaves blank space on the left (or right) inside a cell, which suits data that has a hierarchy, such as "region → city". The indent level is set through the IndentLevel property, where one level is roughly one character wide. The steps are as follows:
- Create a workbook and get the first worksheet.
- Write the sample text.
- Set the horizontal alignment to left so the indentation takes effect.
- Set an increasing indent level through
IndentLevel. - Save the workbook.
Here is a complete code example that sets the indent of cell text in React:
function App() {
  const setTextIndent = async () => {
    // Get the Spire.XLS WASM module
    const xlsModule = window.wasmModule?.spirexls;

    // Check if the module is ready
    if (!xlsModule) {
      alert('Spire.Xls is not ready yet');
      return;
    }

    // Load the font into VFS
    await window.spire.FetchFileToVFS('ARIAL.TTF', '/Library/Fonts/', `${process.env.PUBLIC_URL}/font/`);

    // Create a new workbook
    const workbook = new xlsModule.Workbook();

    // Get the first worksheet
    const sheet = workbook.Worksheets.get(0);

    // Write the sample text
    sheet.Range.get("A1").Text = "Indent Level";
    sheet.Range.get("B1").Text = "Sample";
    sheet.Range.get("A2").Text = "0";
    sheet.Range.get("B2").Text = "Worldwide";
    sheet.Range.get("A3").Text = "1";
    sheet.Range.get("B3").Text = "North Region";
    sheet.Range.get("A4").Text = "2";
    sheet.Range.get("B4").Text = "Beijing";
    sheet.Range.get("A5").Text = "3";
    sheet.Range.get("B5").Text = "Haidian District";

    // Indentation only takes effect together with left alignment
    sheet.Range.get("B2:B5").Style.HorizontalAlignment = xlsModule.HorizontalAlignType.Left;

    // Set the indentation level of the text
    sheet.Range.get("B2").Style.IndentLevel = 0;
    sheet.Range.get("B3").Style.IndentLevel = 1;
    sheet.Range.get("B4").Style.IndentLevel = 2;
    sheet.Range.get("B5").Style.IndentLevel = 3;

    // Widen column B so the indentation differences are visible
    sheet.Range.get("B1:B5").ColumnWidth = 32;

    // Save the workbook
    const outputFileName = "Indentation.xlsx";
    workbook.SaveToFile(outputFileName);

    // Release resources
    workbook.Dispose();

    // Read the result file from VFS and trigger the download
    const fileArray = window.dotnetRuntime.Module.FS.readFile(outputFileName);
    const blob = new Blob([fileArray], { type: "application/vnd.openxmlformats-officedocument.spreadsheetml.sheet" });
    const url = URL.createObjectURL(blob);
    const a = document.createElement('a');
    a.href = url;
    a.download = outputFileName;
    a.click();
    URL.revokeObjectURL(url);
  };

  return (
    <div style={{ textAlign: 'center', height: '300px' }}>
      <h1>Set Text Indent</h1>
      <button onClick={setTextIndent}>Start</button>
    </div>
  );
}

export default App;
The four rows step in one level at a time, forming exactly the hierarchy "Worldwide → North Region → Beijing → Haidian District". Cell B5 has an IndentLevel of 3, so its text starts about three characters in from the left edge.
After running, the effect of setting the indent of text:
Set the Orientation of Text
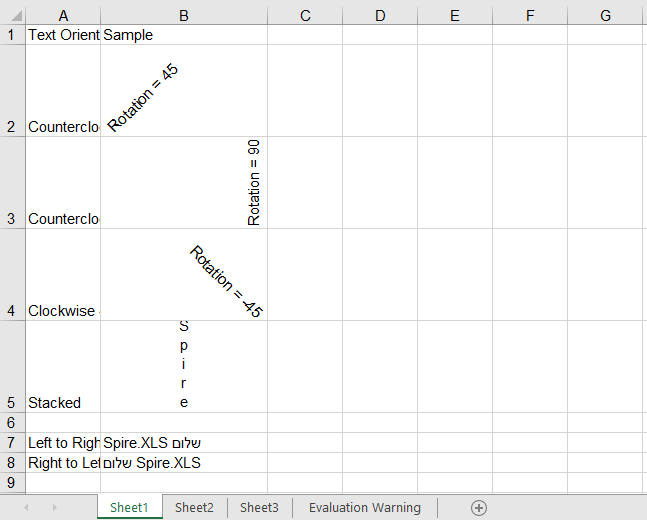
Text orientation covers two independent settings. The first is the rotation angle, set through the Rotation property, where values 0 to 90 are degrees counterclockwise and -1 to -90 are degrees clockwise. There is also the special value 255, which stacks the text vertically one character per line; rotation is often used to fit a long header into a narrow column. The second is the reading order, set through the ReadingOrder property, which accepts LeftToRight, RightToLeft and Context. It decides which direction the mixed content in a cell is laid out from, and is used for languages written from right to left such as Arabic and Hebrew. Rotated or stacked text takes up far more height than usual, so the row height has to be raised at the same time to keep the text inside the cell. The steps are as follows:
- Create a workbook and get the first worksheet.
- Write the sample text.
- Set the rotation angle through
Rotation. - Set the reading order through
ReadingOrder. - Save the workbook.
Here is a complete code example that sets the orientation of cell text in React:
function App() {
  const setTextOrientation = async () => {
    // Get the Spire.XLS WASM module
    const xlsModule = window.wasmModule?.spirexls;

    // Check if the module is ready
    if (!xlsModule) {
      alert('Spire.Xls is not ready yet');
      return;
    }

    // Load the font into VFS
    await window.spire.FetchFileToVFS('ARIAL.TTF', '/Library/Fonts/', `${process.env.PUBLIC_URL}/font/`);

    // Create a new workbook
    const workbook = new xlsModule.Workbook();

    // Get the first worksheet
    const sheet = workbook.Worksheets.get(0);

    // Write the sample text for the rotation angle
    sheet.Range.get("A1").Text = "Text Orientation";
    sheet.Range.get("B1").Text = "Sample";
    sheet.Range.get("A2").Text = "Counterclockwise 45";
    sheet.Range.get("B2").Text = "Rotation = 45";
    sheet.Range.get("A3").Text = "Counterclockwise 90";
    sheet.Range.get("B3").Text = "Rotation = 90";
    sheet.Range.get("A4").Text = "Clockwise 45";
    sheet.Range.get("B4").Text = "Rotation = -45";
    sheet.Range.get("A5").Text = "Stacked";
    sheet.Range.get("B5").Text = "Spire";

    // Write the sample text for the reading order: Latin mixed with Hebrew, so the
    // difference between the two directions is actually visible
    sheet.Range.get("A7").Text = "Left to Right";
    sheet.Range.get("B7").Text = "Spire.XLS שלום";
    sheet.Range.get("A8").Text = "Right to Left";
    sheet.Range.get("B8").Text = "Spire.XLS שלום";

    // Set the rotation angle of the text; 255 stacks the text vertically
    sheet.Range.get("B2").Style.Rotation = 45;
    sheet.Range.get("B3").Style.Rotation = 90;
    sheet.Range.get("B4").Style.Rotation = -45;
    sheet.Range.get("B5").Style.Rotation = 255;

    // Set the reading order of the text
    sheet.Range.get("B7").Style.ReadingOrder = xlsModule.ReadingOrderType.LeftToRight;
    sheet.Range.get("B8").Style.ReadingOrder = xlsModule.ReadingOrderType.RightToLeft;

    // Widen column B and raise rows 2-5 so the rotated and stacked text fits
    sheet.Range.get("B1:B8").ColumnWidth = 20;
    sheet.Range.get("A2:B5").RowHeight = 60;

    // Save the workbook
    const outputFileName = "TextOrientation.xlsx";
    workbook.SaveToFile(outputFileName);

    // Release resources
    workbook.Dispose();

    // Read the result file from VFS and trigger the download
    const fileArray = window.dotnetRuntime.Module.FS.readFile(outputFileName);
    const blob = new Blob([fileArray], { type: "application/vnd.openxmlformats-officedocument.spreadsheetml.sheet" });
    const url = URL.createObjectURL(blob);
    const a = document.createElement('a');
    a.href = url;
    a.download = outputFileName;
    a.click();
    URL.revokeObjectURL(url);
  };

  return (
    <div style={{ textAlign: 'center', height: '300px' }}>
      <h1>Set Text Orientation</h1>
      <button onClick={setTextOrientation}>Start</button>
    </div>
  );
}

export default App;
In the example, B2, B3 and B4 are rotated 45 degrees, 90 degrees and -45 degrees respectively, and B5 uses a Rotation of 255, which stacks the text into a column running top to bottom; all five rows are given a height of 60. B7 and B8 hold the same mixed Latin and Hebrew string with opposite reading orders, and the Hebrew ends up on opposite sides in the two rows — which is exactly what reading order does to mixed content.
After running, the effect of setting the orientation of text:
Set the Wrapping of Text
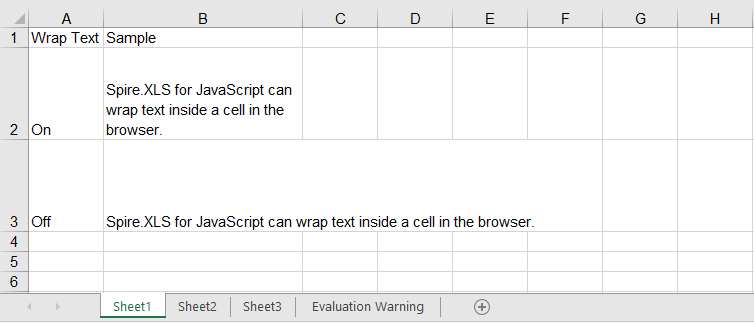
When a piece of text is longer than the column, it spills over onto the neighbouring empty cell by default, and is cut off as soon as that neighbour has content of its own. Setting the WrapText property to true folds the text inside the cell instead; setting it to false returns the text to a single line. As with rotation, wrapping only changes how the text is laid out and does not adjust the row height by itself, so the row height is usually raised as well to show every folded line in full. The steps are as follows:
- Create a workbook and get the first worksheet.
- Write a long piece of text.
- Turn wrapping on or off through
WrapText. - Adjust the column width and row height so the folding is fully visible.
- Save the workbook.
Here is a complete code example that sets the wrapping of cell text in React:
function App() {
  const setTextWrap = async () => {
    // Get the Spire.XLS WASM module
    const xlsModule = window.wasmModule?.spirexls;

    // Check if the module is ready
    if (!xlsModule) {
      alert('Spire.Xls is not ready yet');
      return;
    }

    // Load the font into VFS
    await window.spire.FetchFileToVFS('ARIAL.TTF', '/Library/Fonts/', `${process.env.PUBLIC_URL}/font/`);

    // Create a new workbook
    const workbook = new xlsModule.Workbook();

    // Get the first worksheet
    const sheet = workbook.Worksheets.get(0);

    // Write the sample text
    sheet.Range.get("A1").Text = "Wrap Text";
    sheet.Range.get("B1").Text = "Sample";
    sheet.Range.get("A2").Text = "On";
    sheet.Range.get("B2").Text = "Spire.XLS for JavaScript can wrap text inside a cell in the browser.";
    sheet.Range.get("A3").Text = "Off";
    sheet.Range.get("B3").Text = "Spire.XLS for JavaScript can wrap text inside a cell in the browser.";

    // Turn wrapping on so the text folds inside the cell when it is wider than the column
    sheet.Range.get("B2").Style.WrapText = true;

    // Turn wrapping off so the text stays on a single line
    sheet.Range.get("B3").Style.WrapText = false;

    // Narrow column B and raise rows 2-3 so the wrapping is visible
    sheet.Range.get("B1:B3").ColumnWidth = 24;
    sheet.Range.get("A2:B3").RowHeight = 60;

    // Save the workbook
    const outputFileName = "WrapText.xlsx";
    workbook.SaveToFile(outputFileName);

    // Release resources
    workbook.Dispose();

    // Read the result file from VFS and trigger the download
    const fileArray = window.dotnetRuntime.Module.FS.readFile(outputFileName);
    const blob = new Blob([fileArray], { type: "application/vnd.openxmlformats-officedocument.spreadsheetml.sheet" });
    const url = URL.createObjectURL(blob);
    const a = document.createElement('a');
    a.href = url;
    a.download = outputFileName;
    a.click();
    URL.revokeObjectURL(url);
  };

  return (
    <div style={{ textAlign: 'center', height: '300px' }}>
      <h1>Set Text Wrap</h1>
      <button onClick={setTextWrap}>Start</button>
    </div>
  );
}

export default App;
B2 and B3 hold the very same sentence; the only difference is the value of WrapText. B2 folds into several lines and shows in full, while B3 stays on one line. The cell to the right of B3 is empty, so the text spills into it; if there were content there, the overflow would simply be cut off.
After running, the effect of setting the wrapping of text:
FAQ
I set IndentLevel and the text is not indented at all?
Cause: Indentation is only displayed when the horizontal alignment is a non-General value such as Left or Right. Cells default to General alignment, and IndentLevel is ignored outright in that case — so setting only the indent level shows no change.
Solution: Set HorizontalAlignment first, then IndentLevel:
// Indentation only takes effect together with left alignment
sheet.Range.get("B2").Style.HorizontalAlignment = xlsModule.HorizontalAlignType.Left;
sheet.Range.get("B3").Style.HorizontalAlignment = xlsModule.HorizontalAlignType.Left;

// Set the indent level of the text
sheet.Range.get("B2").Style.IndentLevel = 1;
sheet.Range.get("B3").Style.IndentLevel = 2;
I want the text stacked vertically, one character per line — why does Rotation = 90 not do it?
Cause: The 0 to 90 and -1 to -90 ranges of Rotation only deal with the rotation angle. 90 merely lays the text on its side; it never breaks it into a column of single characters.
Solution: Stacked text needs the special value 255:
// 90 degrees simply rotates the text
sheet.Range.get("B2").Style.Rotation = 90;

// 255 stacks the text vertically, one character per line
sheet.Range.get("B3").Style.Rotation = 255;
Get a Free License
Spire.XLS for JavaScript offers a 30-day full-featured free trial license with no functional limitations. Apply here to evaluate before purchasing.
Automated Case File Archiving and Management with Spire.Agent.Office
In courts, law firms and compliance departments, electronic case file archiving is a high-frequency but tedious task. The materials of a single case are often scattered across dozens of PDFs — complaints, evidence lists, hearing transcripts, judgments — of varying counts and page lengths. Archiving means first organizing these loose materials into one complete volume that meets records-management standards, and then filling in an archive register that lists the name, creation date and page count of every material in the volume, for storage and later retrieval.
The traditional approach means switching between several tools: open each file to identify the material type, drag them into the conventional case-file order by hand, type out a cover page and a table of contents, then use image tools to add page numbers, watermarks and passwords separately. When the register is due, every material has to be opened all over again to copy out its name and page count by hand. With dozens of materials, this is slow and prone to mistakes or omissions.
The PDF AI capability of Spire.Agent.Office lets you describe the archiving requirements in natural language. The AI agent understands the request and handles two kinds of work automatically: turning loose materials into a well-formed volume, and extracting the volume's information into an archive register.
Comparison with Traditional SDK API
| Traditional Spire.Office for .NET API | Spire.Agent.Office | |
|---|---|---|
| Driving style | Write loops to iterate files plus code that orders, merges, stamps and encrypts, controlling every step | Describe the archiving requirements in natural language; the AI understands it and orchestrates the execution path |
| Code size | Case file consolidation usually needs 300-500 lines of C# (file enumeration, ordering, page merging, cover and contents generation, page-number drawing, watermark generation, encryption parameters, register reading, etc.) | About 10 lines of calling code + 1 natural-language instruction |
| Requirement change | Change the ordering/watermark style/register fields → change code → compile → redeploy | Modify the instruction and it takes effect immediately |
This article shows how to use the Spire.Agent.Office PDF AI capability to archive case files. Two cases demonstrate the two typical uses — "organizing the volume" and "registering the volume":
- Case 1: Merge case files into one volume
- Case 2: Extract material information and generate an archive register
For product installation and SpireToken configuration, please refer to Integrating Spire.Agent.Office in a .NET Project. The examples below assume that Spire.Agent.Office has been installed and SpireToken has been configured.
Case 1: Merge case files into one volume
The types of material in a case are fairly fixed, but their counts and page lengths are not: complaints, evidence lists, hearing transcripts, judgments and so on — each type may have several documents, of differing lengths. Archiving requires not only stitching them into one volume in the conventional case-file order, but also adding a cover page and a table of contents, giving the volume continuous page numbers and a unified case-number identifier, and encrypting it when it is handed over or stored to prevent leaks. Doing this by hand means switching between multiple tools, and the more materials there are, the more likely the order gets mixed up, the page numbers fail to run on, or the encryption is missed.
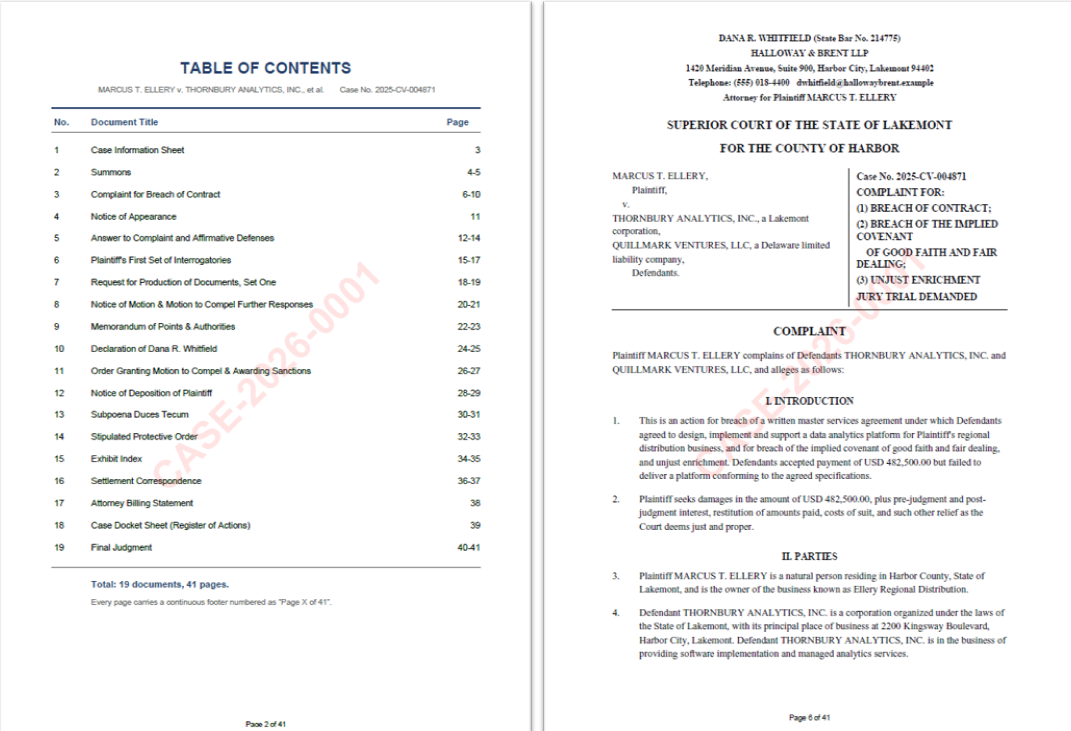
The example below uses the Spire.Agent.Office agent to read all the PDF materials among the attachments, merge them into one volume in the conventional case-file order, generate a cover page and a table of contents automatically, remove the original page numbers and add continuous footers, then stamp the case-number watermark and set an open password:
using Spire.Agent.Office.AI;
using Spire.Agent.Office.Extensions;
using Spire.Pdf;

// Folder containing the PDF materials to consolidate: every PDF in this folder is treated as an attachment
string attachmentDir = @"E:\case_files";  // folder that holds the PDF materials of one case
string[] attachmentPaths = Directory.GetFiles(attachmentDir, "*.pdf");

// PDF-related configuration
string inputPath = "";  // empty input: all materials to archive are among the attachments
string savePath = null;  // result path
string OutDir = @"E:\output";  // output directory (the merged and encrypted case file is saved here)
string key = "**************************";  // SpireToken key
string instruction =
    "Read all the PDF case materials among the attachments and complete the consolidation:" +
    "1. Merge all materials into a single case file PDF in the conventional order of case file documents, and generate a cover page and a table of contents page based on the content;" +
    "2. Remove the original page numbers and add continuous footers to the merged file, centered in the footer as 'Page X of Y', with a font size smaller than the body text so that no existing content is covered;" +
    "3. Add the case-number watermark 'CASE-2026-0001' to every page, rotated 45 degrees, red, without affecting readability;" +
    "4. Set the open password '2026@Case0001' for the case file PDF; this password only restricts opening the document and does not affect printing or copying;" +
    "5. Add a table of contents page and keep the layout, fonts and page settings of each original material;" +
    "Save the final result as a PDF file";

// Call the PDF document processing function
AIResult result = ExecuteDemoPDF(instruction, inputPath, savePath, key, OutDir, attachmentPaths);

// Execute PDF AI processing
static AIResult ExecuteDemoPDF(string instruction, string inputPath, string savePath, string key, string output, string[] attachmentPaths)
{
    // Create the AIOptions configuration object
    AIOptions options = new AIOptions();
    options.WorkDir = output;  // set the working directory to the output directory
    options.SpireToken = key;  // set the SpireToken key

    // Process the PDF document using a PdfDocument object
    using (PdfDocument pdf = new PdfDocument())
    {
        // The input file is empty so nothing is loaded; all files to process come from the attachments
        if (!string.IsNullOrEmpty(inputPath) && File.Exists(inputPath))
        {
            pdf.LoadFromFile(inputPath);
        }
        // Create the AI document processor
        AIDocumentProcessor processor = pdf.AI(options);

        // Execute the AI instruction
        return processor.ExecuteInstruction(pdf, instruction, savePath, attachmentPaths);
    }
}
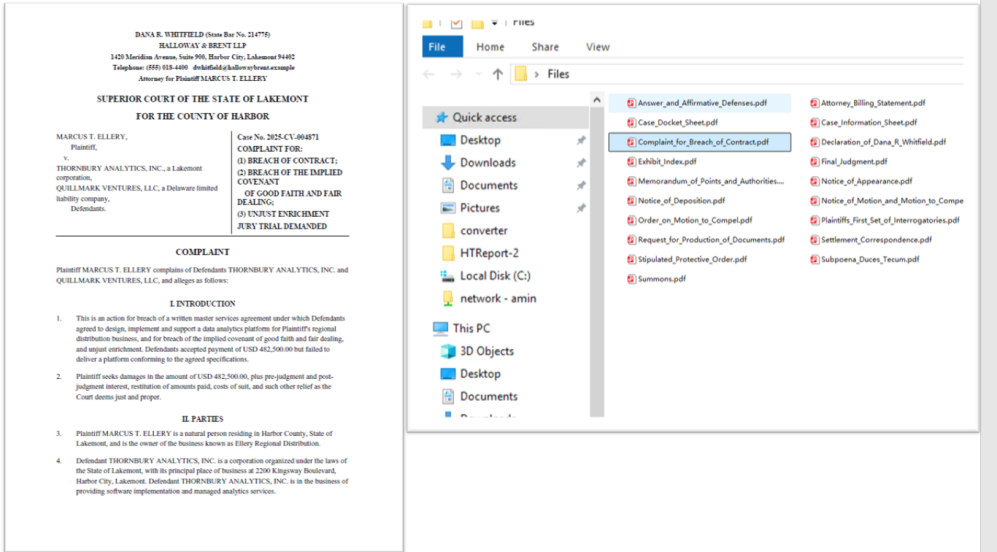
The PDF case materials to be consolidated
 The encrypted case file merged in order, with page numbers and watermark
Case 2: Extract material information and generate an archive register
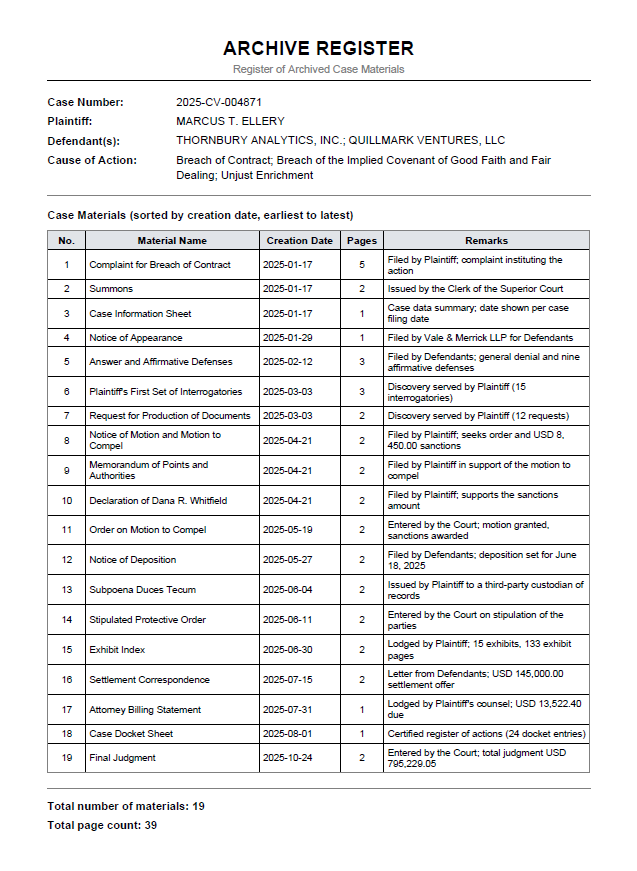
Once the volume is organized, an archive register has to be filed together with it. The register lists the name, creation date and page count of every material in the volume, headed by the case number, the parties and the cause of action. All of this information is already inside the materials themselves, but the traditional approach can only copy it out by hand, opening each material one by one — with many materials, a wrong page count or date is almost unavoidable.
Unlike Case 1, this case does not modify any page. It only reads information: the input is the same set of PDF attachments, but the output is a newly generated register PDF.
The example below uses the Spire.Agent.Office agent to read all the PDF materials among the attachments, extract the case information and the per-material information, sort them by creation date and compile an archive register:
using Spire.Agent.Office.AI;
using Spire.Agent.Office.Extensions;
using Spire.Pdf;

// Folder containing the PDF materials to register: every PDF in this folder is treated as an attachment
string attachmentDir = @"E:\case_files";  // folder that holds the PDF materials of one case
string[] attachmentPaths = Directory.GetFiles(attachmentDir, "*.pdf");

// PDF-related configuration
string inputPath = "";  // empty input: all materials to register are among the attachments
string savePath = null;  // result path
string OutDir = @"E:\output-register";  // output directory (the archive register is saved here)
string key = "**************************";  // SpireToken key
string instruction =
    "Read all the PDF case materials among the attachments, extract the information and compile an 'Archive Register':" +
    "1. Extract the basic case information from the materials: case number, plaintiff, defendant and cause of action;" +
    "2. Extract the material name, creation date and page count from each material;" +
    "3. Sort the materials from the earliest creation date to the latest;" +
    "4. Generate a PDF-format 'Archive Register' in the output directory, with columns: Serial Number, Material Name, Creation Date, Pages, Remarks;" +
    "5. List the case number, plaintiff, defendant and cause of action above the table, and summarize the number of materials and the total page count below it;" ;

// Call the PDF document processing function
AIResult result = ExecuteDemoPDF(instruction, inputPath, savePath, key, OutDir, attachmentPaths);

// Execute PDF AI processing
static AIResult ExecuteDemoPDF(string instruction, string inputPath, string savePath, string key, string output, string[] attachmentPaths)
{
    // Create the AIOptions configuration object
    AIOptions options = new AIOptions();
    options.WorkDir = output;  // set the working directory to the output directory
    options.SpireToken = key;  // set the SpireToken key

    // Process the PDF document using a PdfDocument object
    using (PdfDocument pdf = new PdfDocument())
    {
        // The input file is empty so nothing is loaded; all files to process come from the attachments
        if (!string.IsNullOrEmpty(inputPath) && File.Exists(inputPath))
        {
            pdf.LoadFromFile(inputPath);
        }
        // Create the AI document processor
        AIDocumentProcessor processor = pdf.AI(options);

        // Execute the AI instruction
        return processor.ExecuteInstruction(pdf, instruction, savePath, attachmentPaths);
    }
}
Generated archive register PDF
FAQ
Will the page numbers and watermark cover the body text?
Cause: Page numbers and watermarks are drawing layers overlaid on the page; a poorly chosen position or opacity can indeed cover the content.
Solution: Describe the position and style explicitly in the instruction (for example, "page numbers centered in the footer", "watermark rotated 45 degrees, red") and the AI will draw them as described. When adding page numbers and watermarks, Spire.Agent.Office does not change the original layout, fonts or page settings of the body text.
How is the merge order of the materials determined?
Cause: Case 1 arranges the materials in the conventional order of case file documents (complaint, evidence list, transcript, judgment and so on), while Case 2 sorts them by creation date. If a material type is unusual, or a creation date cannot be recognized, the result may not be as expected.
Solution: For Case 1, state the volume order directly in the instruction (for example, "arrange in the order of complaint, evidence list, hearing transcript, judgment"). For Case 2, make sure the materials carry a creation date, and add a fallback rule for those that genuinely lack one (for example, "materials without a date go last, with the remarks column marked 'date pending'").
Getting a SpireToken Key
- Contact sales@e-iceblue.com or visit https://www.e-iceblue.com/TemLicense.html to obtain a trial/commercial API key
Configure it in your code:
AIOptions options = new AIOptions();
options.SpireToken = key;
Financial Report Parsing and Valuation Modeling Automation with Spire.Agent.Office in C#
In the field of financial analysis and investment research, interpreting listed company financial reports is one of the most fundamental yet time-consuming tasks. A complete annual report is quite lengthy, encompassing not only core statements such as the balance sheet, income statement, cash flow statement, and statement of changes in shareholders' equity, but also a large amount of detailed data in the notes. Analysts need to extract key data from these documents and generate visual charts before forming investment judgments. The traditional approach typically requires manually flipping through PDFs, manually entering data into Excel, manually drawing charts, and writing analysis conclusions. The entire process takes 4-8 hours and is highly prone to errors caused by data entry mistakes.
But parsing is only the first step. In a real investment research and financial modeling workflow, the data ultimately has to land in the analyst's own valuation model. And the valuation model is precisely the most delicate part of the whole workflow: it is usually built up over months or years, containing a large number of custom macros (VBA), pivot tables and deeply nested formulas. The traditional approach leaves no choice but to key the data in cell by cell — the reason nobody dares to batch-write it with a script is that most third-party Excel libraries rebuild the workbook structure when reading and writing. The result is lost macros, broken pivot tables and nested formulas flattened into static values — a carefully maintained model ruined.
This article uses two connected cases and the Spire.Agent.Office Excel AI capabilities to cover the complete chain from "PDF financial report" to "valuation conclusion":
- Case One: Long-Text Financial Report Data Extraction and Analysis
- Case Two: Injecting Financial Data into a Preset Valuation Model
For product installation and SpireToken configuration, please refer to Integrating Spire.Agent.Office in a .NET Project. The following examples assume Spire.Agent.Office is already installed and SpireToken is configured.
Comparison with Traditional SDK API Processing
| Traditional Spire.Office for .NET API | Spire.Agent.Office Processing | |
|---|---|---|
| Driving Method | Write PDF parsing + cell writing + chart creation + formula calculation code | Describe the goal in natural language, AI understands and automatically orchestrates the execution path |
| Code Volume | The two cases together typically require 800-1500 lines of C# code (including PDF table positioning, row/column parsing, chart configuration, etc.) | Approximately 20 lines of calling code + two natural language instructions |
| Table Recognition | Must manually locate table positions in PDF, handle cross-page table splitting, merged cells, and other logic | AI automatically identifies table structures in the document, understands headers and hierarchical relationships |
| Chart Generation | Must manually create Chart objects, configure data ranges, set chart types and styles | AI automatically selects the most appropriate chart type based on data semantics |
| Data Injection | Must hard-code a "source row N → template row M" mapping; any change in reporting structure means changing the code | AI matches by item name semantics; row/column order changes in the source do not affect the result |
| Macros and Pivot Tables | Must handle VBA project and pivot cache preservation yourself; a single mistake corrupts them | Macros, pivot tables and charts are preserved as-is; the AI writes only to the target cells |
| Requirement Changes | Adding new analysis dimensions requires modifying code → compiling → deploying | Modify the description in the instruction, takes effect immediately |
Case One: Long-Text Financial Report Data Extraction and Analysis
AI reads a PDF financial report file, automatically identifies and extracts financial statement tables into an Excel file, while automatically generating visual charts and financial analysis from the data. The entire process requires only one piece of code and one instruction.
using Spire.Agent.Office.AI;
using Spire.Agent.Office.Extensions;
using Spire.Xls;

// PDF financial report file to be processed (passed as an attachment)
string[] attachmentPaths = new string[] { @"C:\FinancialReport\ListedCompany2025AnnualReport.pdf" };
// Save path of the result Excel document
string savePath = @"C:\FinancialReport\AnalysisResult.xlsx";
// SpireToken Key (apply on the official website)
string key = "sk-***************************";

// Natural language instruction
string instruction =
    "Process the attachment file as follows: " +
    "1. Extract all tables from the financial reporting section, placing each table in a separate worksheet named after the original table. " +
    "2. Preserve all original data without adding or modifying any values. " +
    "3. Enhance table readability with appropriate formatting. " +
    "4. Merge multi-page tables into a single worksheet. " +
    "5. Generate suitable charts to visualize the data from each table. " +
    "6. Use the extracted raw data directly for charting, without adding or modifying any values. " +
    "7. Analyze and summarize the company's financial status and trends based on the data provided.";

// AI generation
AIResult result = AnalyzeFinancialReport(instruction, savePath, key, attachmentPaths);

// AI-assisted financial report analysis
static AIResult AnalyzeFinancialReport(string instruction, string savePath, string key, string[] attachmentPaths)
{
    // Configure the AI processing options
    AIOptions options = new AIOptions();
    options.SpireToken = key;
    options.TimeoutMs = 10000000;

    using (Workbook wb = new Workbook())
    {
        AIDocumentProcessor processor = wb.AI(options);
        return processor.ExecuteInstruction(wb, instruction, savePath, attachmentPaths);
    }
}
Financial Report Data Processing and Chart Analysis Results:
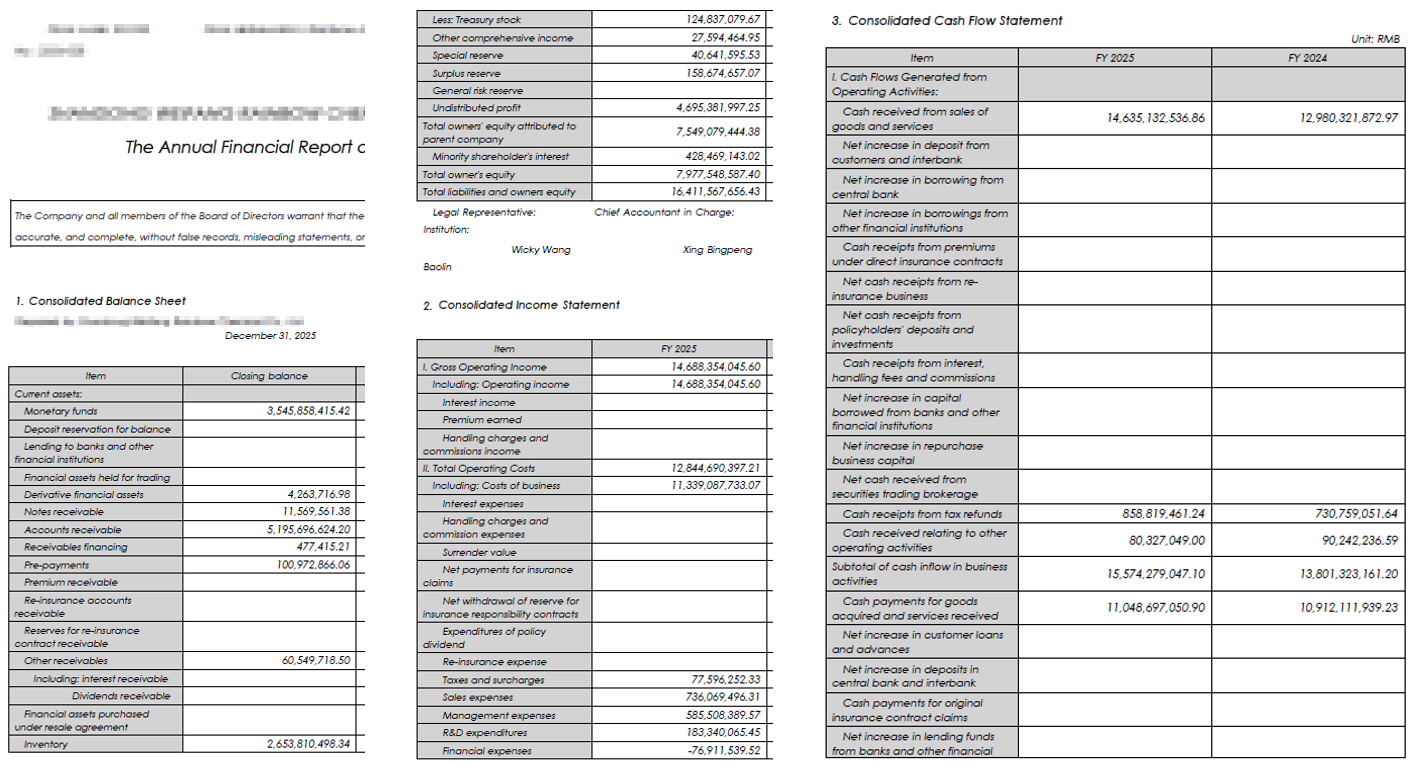 Description: The original input file
The output consists of two parts:
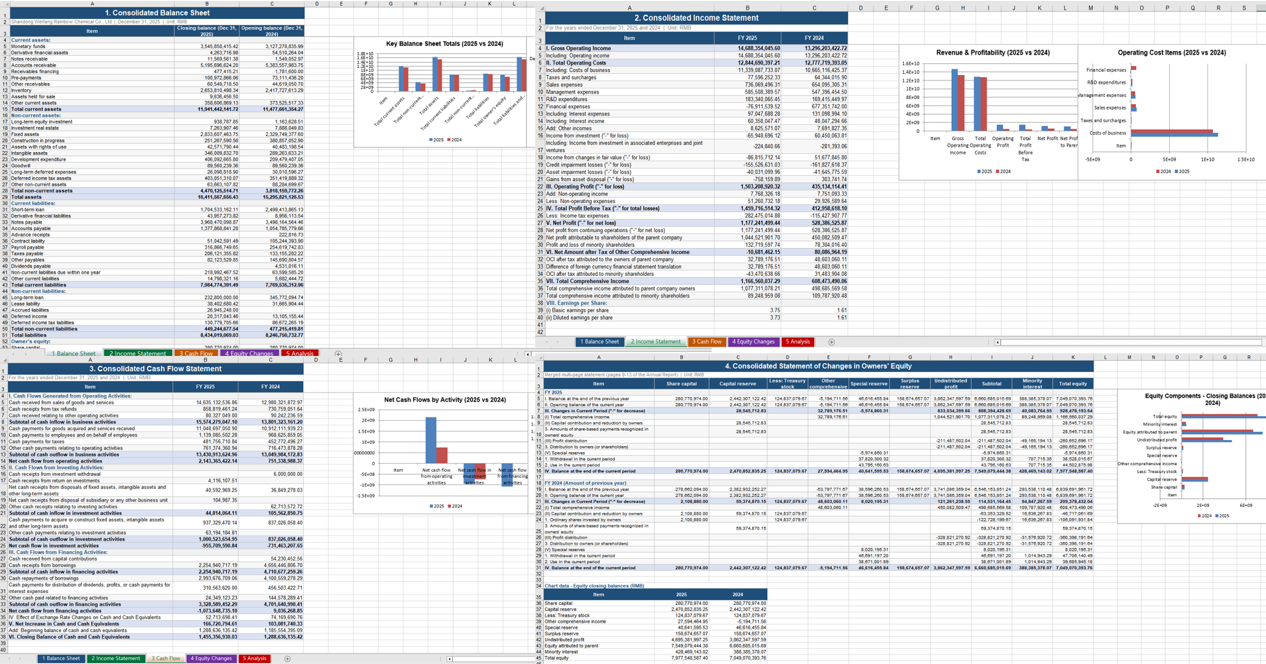 Description: Table data extracted from the PDF financial report, with corresponding visual charts.
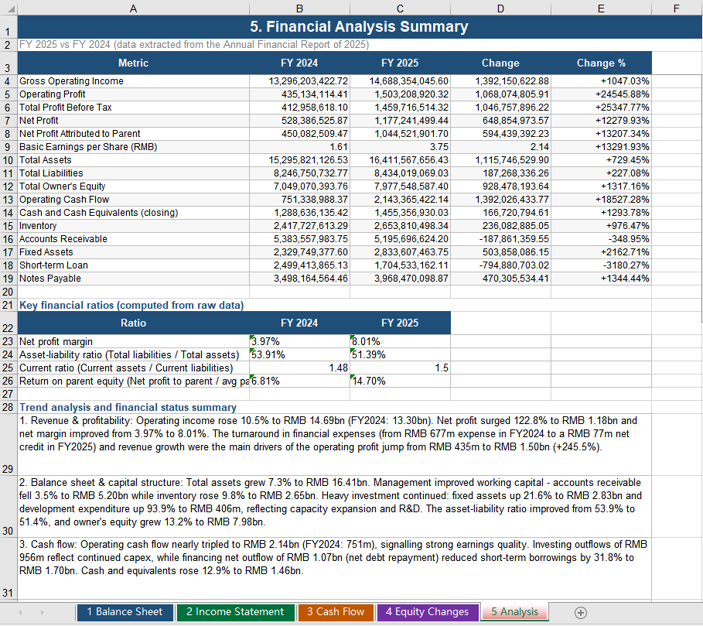 Description: Financial analysis conclusions generated from the extracted data.
Case Two: Injecting Financial Data into a Preset Valuation Model
Case one produced "data"; case two is about "modeling". The process takes two inputs: a preset valuation model template (.xlsm, containing macros, pivot tables and nested formulas) and the financial data workbook produced by case one (.xlsx). AI reads the financial data, fills it into the "Data Input" worksheet of the template by matching item names, and the formulas inside the model recalculate immediately — the valuation curve updates itself.
using Spire.Agent.Office.AI;
using Spire.Agent.Office.Extensions;
using Spire.Xls;

// Preset valuation model template (macros / pivot table / nested formulas / valuation curve chart)
string inputPath = @"C:\FinancialReport\ValuationModelTemplate.xlsm";
// Financial data workbook produced by case one (passed as an attachment)
string[] attachmentPaths = new string[] { @"C:\FinancialReport\AnalysisResult.xlsx" };
// Result document path (null here; the output folder below is used instead)
string savePath = null;
// Output directory
string OutDir = @"C:\FinancialReport\output";
// SpireToken Key (apply on the official website)
string key = "sk-***************************";

// Natural language instruction
string instruction =
    "Read the financial data in the attachment and fill it into the Data Input worksheet of the current valuation model template by matching item names, current period and prior period into the two respective columns; " +
    "fill only the shaded cells, do not modify any existing formula; " +
    "keep the existing macros, pivot table, formulas and chart in the template; " +
    "recalculate the model, refresh the pivot table and update the Valuation Curve after filling; " +
    "save the final result as a macro-enabled Excel file";

// AI generation
AIResult result = InjectDataIntoModel(instruction, inputPath, savePath, key, OutDir, attachmentPaths);

// AI-assisted data injection into the valuation model
static AIResult InjectDataIntoModel(string instruction, string inputPath, string savePath,
                                    string key, string output, string[] attachmentPaths)
{
    // Configure the AI processing options
    AIOptions options = new AIOptions();
    options.WorkDir = output;      // Set the working directory to the output folder
    options.SpireToken = key;      // Set the SpireToken Key

    using (Workbook workbook = new Workbook())
    {
        // Load the valuation model template from file
        if (!string.IsNullOrEmpty(inputPath) && File.Exists(inputPath))
        {
            workbook.LoadFromFile(inputPath);
        }

        // Create the AI document processor
        AIDocumentProcessor processor = workbook.AI(options);

        // Execute the AI instruction
        return processor.ExecuteInstruction(workbook, instruction, savePath, attachmentPaths);
    }
}
The valuation model template before injection:
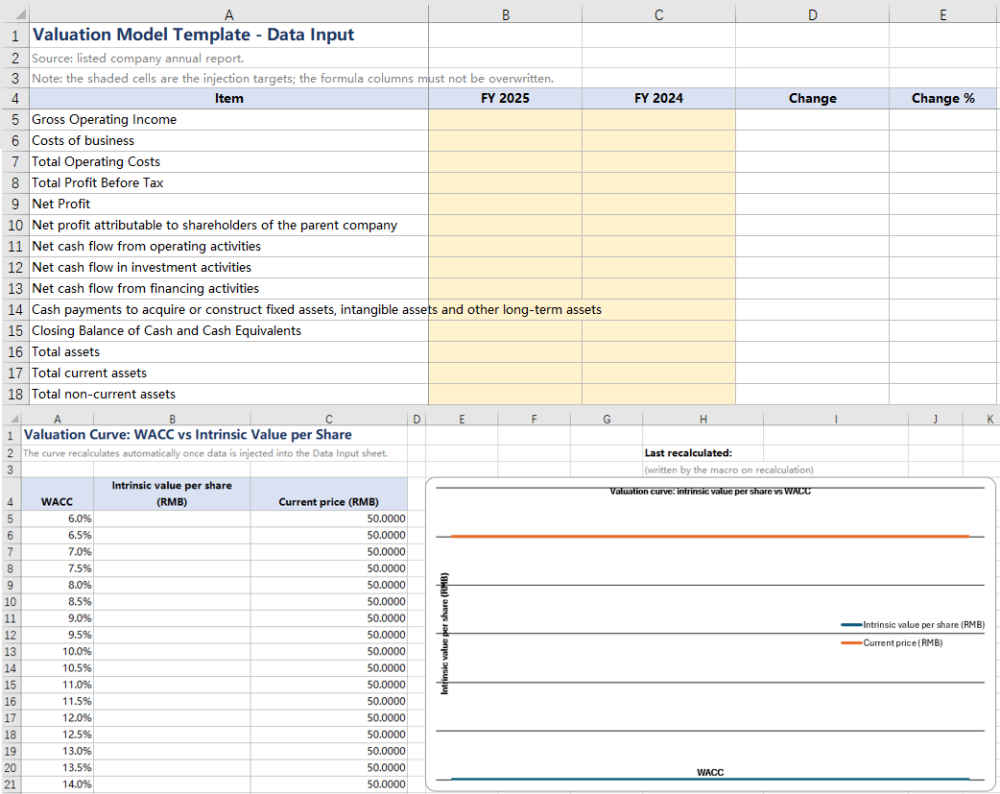 Description: The preset valuation model template; the shaded cells are the injection targets.
The financial data workbook produced by case one, used as the data source for this injection, filled into the Data Input area of the valuation template:
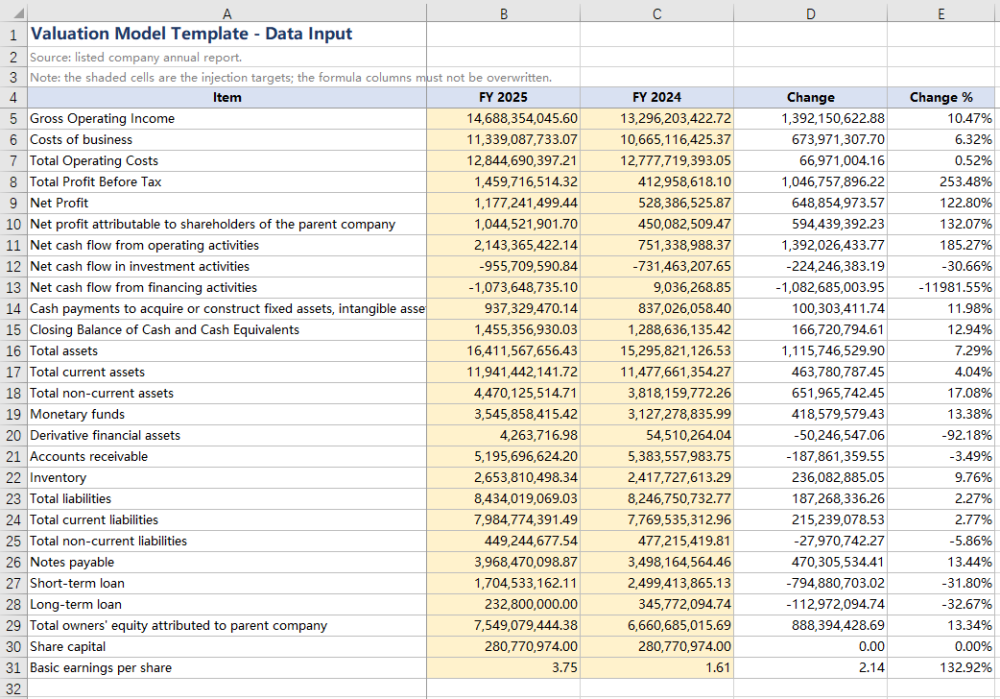 Description: The consolidated balance sheet, income statement and cash flow statement data filled in from among them.
The valuation curve recalculated automatically after injection:
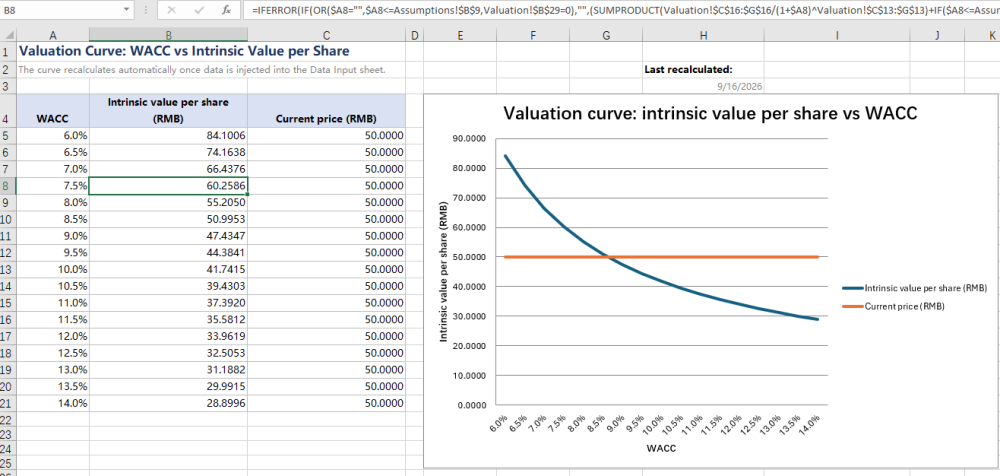 Description: The valuation curve refreshed automatically once the data injection completed.
Frequently Asked Questions
Extracted table data does not match the PDF
Cause: PDF tables may contain complex layouts such as cross-page splitting, merged cells, rotated text, etc., and AI may have deviations during recognition.
Solution: Add "carefully verify data accuracy, especially pay attention to merged cells and cross-page table joining" to the instruction; or limit specific page ranges for batch extraction and review before consolidation.
The valuation curve does not update after data injection
Cause: Model recalculation and pivot table refresh are two independent operations. Writing the data alone does not refresh the pivot cache, and some readers do not proactively recalculate the whole formula chain.
Solution: Explicitly require "recalculate the model and refresh the pivot tables after filling in the data" in the instruction. In addition, the template can be set to force recalculation on open so the curve is always up to date.
Obtaining a SpireToken Key
- Contact sales@e-iceblue.com or visit https://www.e-iceblue.com/TemLicense.html to obtain a trial/commercial API key
Configure it in code:
AIOptions options = new AIOptions();
options.SpireToken = key;
Create Named Ranges in React with JavaScript
In Excel, formulas usually have to hard-code a specific cell range, such as =SUM(D2:D10). As such formulas multiply, maintenance costs rise: when the data range changes, every related formula must be updated one by one, and a single missed edit produces a wrong result. A named range is designed to solve exactly this problem — give a cell range a meaningful name and refer to that name in the formula. The range and the formula are thereby separated: changing the range takes a single edit, every formula that refers to it updates automatically, and the result is both less error-prone and easier to read. Spire.XLS for JavaScript ships a complete named range API and can create both global (workbook-level) and local (worksheet-level) named ranges in the browser through WebAssembly, with no backend service required.
This article covers two key features:
For installation and project setup, see Integrating Spire.XLS for JavaScript in a React Project. The examples below assume Spire.XLS is already installed and the WebAssembly module has been initialized.
Global Named Range
A global named range is stored in the workbook's name collection Workbook.NameRanges, its name is unique across the whole workbook, and any worksheet can refer to it directly. Create it with Workbook.NameRanges.Add() and point it at a cell range through the RefersToRange property. The steps are:
- Load the Excel file that contains the data and get the first worksheet.
- Create a global named range with
workbook.NameRanges.Add("SalesData"). - Set
namedRange.RefersToRangetosheet.Range.get("A1:D10"), that is, the range A1:D10. - Read
namedRange.NameandnamedRange.RefersToRange.RangeAddressand write the name and the referred address back into cells. - Save the workbook with the
Workbook.SaveToFile()method.
The following is a complete code example that shows how to create a global named range in React:
function App() {
  const createGlobalNamedRange = async () => {
    // Get the Spire.XLS WASM module
    const xlsModule = window.wasmModule?.spirexls;

    // Check if the module is ready
    if (!xlsModule) {
      alert('Spire.Xls is not ready yet');
      return;
    }

    // Load the font into VFS
    await window.spire.FetchFileToVFS('ARIAL.TTF', '/Library/Fonts/', `${process.env.PUBLIC_URL}/font/`);

    // Load the Excel file into VFS
    const inputFileName = 'NamedRanges.xlsx';
    await window.spire.FetchFileToVFS(inputFileName, '', `${process.env.PUBLIC_URL}/static/data/`);

    // Load the workbook
    const workbook = new xlsModule.Workbook();
    workbook.LoadFromFile(inputFileName);

    // Get the first worksheet
    let sheet = workbook.Worksheets.get(0);

    // Create a workbook-level (global) named range
    let namedRange = workbook.NameRanges.Add("SalesData");

    // Set the cell range the named range refers to
    namedRange.RefersToRange = sheet.Range.get("A1:D10");

    // Read the name and the referred address
    sheet.Range.get("F1").Text = "Named Range Name";
    sheet.Range.get("F2").Text = namedRange.Name;
    sheet.Range.get("G1").Text = "Refers To Address";
    sheet.Range.get("G2").Text = namedRange.RefersToRange.RangeAddress;

    // Auto-fit the columns
    sheet.AllocatedRange.AutoFitColumns();

    // Save the workbook
    const outputFileName = 'GlobalNamedRange.xlsx';
    workbook.SaveToFile(outputFileName);

    // Release resources
    workbook.Dispose();

    // Read the result file from VFS and trigger the download
    const fileArray = window.dotnetRuntime.Module.FS.readFile(outputFileName);
    const blob = new Blob([fileArray], { type: "application/vnd.openxmlformats-officedocument.spreadsheetml.sheet" });
    const url = URL.createObjectURL(blob);
    const a = document.createElement('a');
    a.href = url;
    a.download = outputFileName;
    a.click();
    URL.revokeObjectURL(url);
  };

  return (
    <div style={{ textAlign: 'center', height: '300px' }}>
      <h1>Create Global Named Range</h1>
      <button onClick={createGlobalNamedRange}>Start</button>
    </div>
  );
}

export default App;
After running, the effect of creating a global named range:
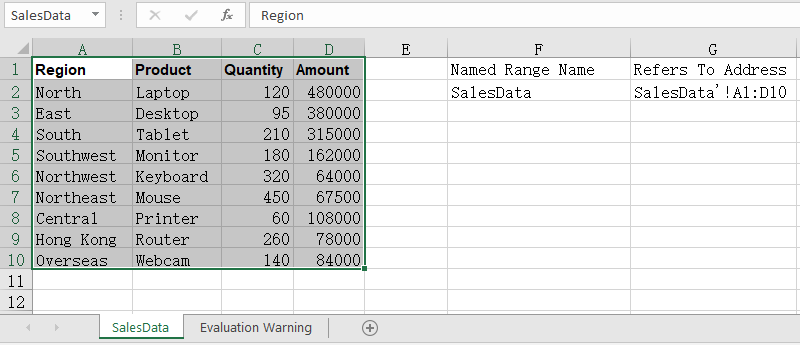
Local Named Range
A global named range requires its name to be unique across the entire workbook. When different worksheets all want to use the same name while pointing at different data areas, switch to a local named range instead — added through Worksheet.Names.Add(), its name only takes effect inside the owning worksheet, so same-named ranges can live on several worksheets at once without interfering with each other. The steps are:
- Load the workbook and get the first worksheet.
- Create a local named range on the first worksheet with
sheet.Names.Add("SalesData"), pointing atA2:D10. - Add another worksheet with
workbook.Worksheets.Add()and create a same-named local named range on it, pointing at a different area. - Read the referred address of both ranges back into cells.
- Save the workbook.
The following is a complete code example that shows how to create a local named range in React:
function App() {
  const createLocalNamedRange = async () => {
    // Get the Spire.XLS WASM module
    const xlsModule = window.wasmModule?.spirexls;

    // Check if the module is ready
    if (!xlsModule) {
      alert('Spire.Xls is not ready yet');
      return;
    }

    // Load the font into VFS
    await window.spire.FetchFileToVFS('ARIAL.TTF', '/Library/Fonts/', `${process.env.PUBLIC_URL}/font/`);

    // Load the Excel file into VFS
    const inputFileName = 'NamedRanges.xlsx';
    await window.spire.FetchFileToVFS(inputFileName, '', `${process.env.PUBLIC_URL}/static/data/`);

    // Load the workbook
    const workbook = new xlsModule.Workbook();
    workbook.LoadFromFile(inputFileName);

    // Get the first worksheet
    let sheet = workbook.Worksheets.get(0);

    // Create a local named range on the first worksheet
    let localRange = sheet.Names.Add("SalesData");
    localRange.RefersToRange = sheet.Range.get("A2:D10");

    // Add another worksheet and create a same-named local range on it
    let sheet2 = workbook.Worksheets.Add("Summary");
    let localRange2 = sheet2.Names.Add("SalesData");
    localRange2.RefersToRange = sheet2.Range.get("A1:B5");

    // Read the addresses of the same-named ranges in both worksheets
    sheet.Range.get("F1").Text = "SalesData on Sheet1";
    sheet.Range.get("F2").Text = localRange.RefersToRange.RangeAddress;
    sheet.Range.get("G1").Text = "SalesData on Sheet2";
    sheet.Range.get("G2").Text = localRange2.RefersToRange.RangeAddress;

    // Auto-fit the columns
    sheet.AllocatedRange.AutoFitColumns();

    // Save the workbook
    const outputFileName = 'LocalNamedRange.xlsx';
    workbook.SaveToFile(outputFileName);

    // Release resources
    workbook.Dispose();

    // Read the result file from VFS and trigger the download
    const fileArray = window.dotnetRuntime.Module.FS.readFile(outputFileName);
    const blob = new Blob([fileArray], { type: "application/vnd.openxmlformats-officedocument.spreadsheetml.sheet" });
    const url = URL.createObjectURL(blob);
    const a = document.createElement('a');
    a.href = url;
    a.download = outputFileName;
    a.click();
    URL.revokeObjectURL(url);
  };

  return (
    <div style={{ textAlign: 'center', height: '300px' }}>
      <h1>Create Local Named Range</h1>
      <button onClick={createLocalNamedRange}>Start</button>
    </div>
  );
}

export default App;
After running, the effect of creating a local named range:
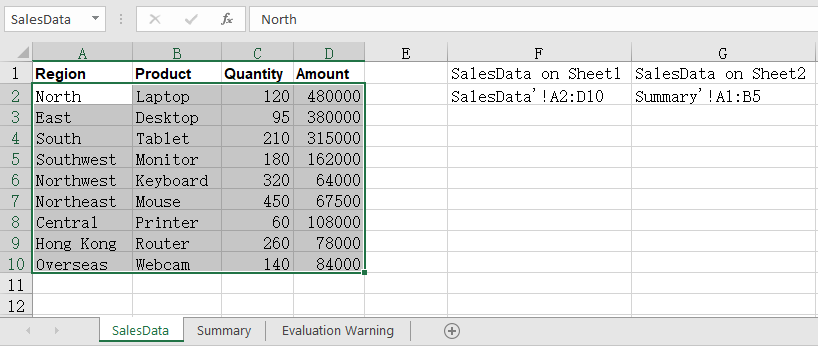
FAQ
How do I use a named range in a formula?
Cause: The real value of a named range is being referenced from formulas. Once the amount column is defined as a named range, the formula no longer needs a literal address, and the summed range expands automatically when rows are inserted later.
Solution: Simply write the name of the named range into the formula:
let namedRange = workbook.NameRanges.Add("SalesAmount");
namedRange.RefersToRange = sheet.Range.get("D2:D10");

// Refer to the named range in a formula
sheet.Range.get("F2").Formula = "=SUM(SalesAmount)";
How do I read the named ranges that already exist in a workbook?
Cause: A named range is saved together with the workbook, so it has to be read back before you can tell which names currently exist and which area each one points to.
Solution: Walk the NameRanges collection: take the count first, then read the name and the refers-to address of each entry by index:
// Total number of named ranges
let count = workbook.NameRanges.Count;

// Read the name and the refers-to address of each one
for (let i = 0; i < count; i++) {
  let namedRange = workbook.NameRanges.get(i);
  sheet.Range.get(`F${i + 2}`).Text = namedRange.Name;
  sheet.Range.get(`G${i + 2}`).Text = namedRange.RefersToRange.RangeAddress;
}
This walks workbook-level named ranges; worksheet-level ones are read through sheet.Names, in exactly the same way.
Get a Free License
Spire.XLS for JavaScript offers a 30-day full-featured free trial license with no functional limitations. Apply here to evaluate before purchasing.
Create a Radar Chart with JavaScript in React
When you need to compare several metrics across multiple dimensions at the same time, a radar chart is a very intuitive way to present them — each dimension is placed on an axis radiating out from the center, and the values on those axes are joined into a polygon, so the shape immediately shows where the strengths and weaknesses are. Spire.XLS for JavaScript provides a complete charting API that supports creating radar charts directly in the browser via WebAssembly, without requiring a backend service.
This article covers two core features:
For installation and project configuration, please refer to Integrating Spire.XLS for JavaScript in a React Project. The following examples assume Spire.XLS is already installed and the WebAssembly module has been initialized.
Create a Radar Chart
You can add a radar chart to a worksheet with the sheet.Charts.Add() method. The steps are as follows:
- Load the Excel file that contains the data and get the first worksheet.
- Add a radar chart with
Charts.Add({ chartType: ExcelChartType.Radar }). - Set the
DataRangeproperty to specify the chart data range: the first row holds the series names, the first column holds the category names for each axis, and the remaining cells hold the values. - Set
SeriesDataFromRange = falseso that the data is not taken from a row/column layout. - Set the chart title, position, and legend position.
- Save the workbook with the
Workbook.SaveToFile()method.
Below is a complete code example that shows how to create a radar chart in React:
function App() {
  const createRadarChart = async () => {
    // Get the Spire.XLS WASM module
    const xlsModule = window.wasmModule?.spirexls;

    // Check if the module is ready
    if (!xlsModule) {
      alert('Spire.Xls is not ready yet');
      return;
    }

    // Load the Excel file into VFS
    const inputFileName = 'RadarChartData.xlsx';
    await window.spire.FetchFileToVFS(inputFileName, '', `${process.env.PUBLIC_URL}/static/data/`);

    // Load the workbook
    const workbook = new xlsModule.Workbook();
    workbook.LoadFromFile(inputFileName);

    // Get the first worksheet
    let sheet = workbook.Worksheets.get(0);

    // Add a radar chart
    let chart = sheet.Charts.Add({ chartType: xlsModule.ExcelChartType.Radar });

    // Set the chart data range
    chart.DataRange = sheet.Range.get("A1:C5");
    chart.SeriesDataFromRange = false;

    // Set the chart position
    chart.LeftColumn = 7;
    chart.TopRow = 6;
    chart.RightColumn = 16;
    chart.BottomRow = 29;

    // Set the chart title
    chart.ChartTitle = "Product Sales by Region";
    chart.ChartTitleArea.IsBold = true;
    chart.ChartTitleArea.Size = 12;

    // Set the legend position
    chart.Legend.Position = xlsModule.LegendPositionType.Corner;

    // Save the workbook
    const outputFileName = 'CreateRadarChart.xlsx';
    workbook.SaveToFile(outputFileName);

    // Release resources
    workbook.Dispose();

    // Read the converted file from VFS and trigger download
    const fileArray = window.dotnetRuntime.Module.FS.readFile(outputFileName);
    const blob = new Blob([fileArray], { type: "application/vnd.openxmlformats-officedocument.spreadsheetml.sheet" });
    const url = URL.createObjectURL(blob);
    const a = document.createElement('a');
    a.href = url;
    a.download = outputFileName;
    a.click();
    URL.revokeObjectURL(url);
  };

  return (
    <div style={{ textAlign: 'center', height: '300px' }}>
      <h1>Create a Radar Chart</h1>
      <button onClick={createRadarChart}>Start</button>
    </div>
  );
}

export default App;
After running, the effect of creating a radar chart:

Style the Radar Chart
After creating the radar chart, you can further improve its appearance by setting the chart area, plot area, and series line colors. The steps are as follows:
- Get the radar chart object that has been created.
- Set the
ChartArea.Fill.ForeColorproperty to set the chart background color. - Set the
PlotArea.Fill.ForeColorproperty to set the plot area background color. - Set the
Series[i].Format.LineProperties.Colorproperty to specify the line color of each series;Series.get(0)andSeries.get(1)correspond to the two series in the data range. - Save the workbook.
Below is a complete code example that shows how to style the radar chart:
function App() {
  const styleRadarChart = async () => {
    // Get the Spire.XLS WASM module
    const xlsModule = window.wasmModule?.spirexls;

    // Check if the module is ready
    if (!xlsModule) {
      alert('Spire.Xls is not ready yet');
      return;
    }

    // Load the Excel file into VFS
    const inputFileName = 'RadarChartData.xlsx';
    await window.spire.FetchFileToVFS(inputFileName, '', `${process.env.PUBLIC_URL}/static/data/`);

    // Load the workbook
    const workbook = new xlsModule.Workbook();
    workbook.LoadFromFile(inputFileName);

    // Get the first worksheet
    let sheet = workbook.Worksheets.get(0);

    // Add a radar chart
    let chart = sheet.Charts.Add({ chartType: xlsModule.ExcelChartType.Radar });

    // Set the chart data range
    chart.DataRange = sheet.Range.get("A1:C5");
    chart.SeriesDataFromRange = false;

    // Set the chart position
    chart.LeftColumn = 7;
    chart.TopRow = 6;
    chart.RightColumn = 16;
    chart.BottomRow = 29;

    // Set the chart title
    chart.ChartTitle = "Product Sales by Region";
    chart.ChartTitleArea.IsBold = true;
    chart.ChartTitleArea.Size = 12;

    // Style the radar chart
    // Set the chart area background color
    chart.ChartArea.Fill.ForeColor = xlsModule.Color.get_LightCyan();
    // Set the plot area background color
    chart.PlotArea.Fill.ForeColor = xlsModule.Color.get_LightYellow();
    // Set the color of the first series line
    chart.Series.get(0).Format.LineProperties.Color = xlsModule.Color.get_Orange();
    // Set the color of the second series line
    chart.Series.get(1).Format.LineProperties.Color = xlsModule.Color.get_CornflowerBlue();

    // Save the workbook
    const outputFileName = 'StyledRadarChart.xlsx';
    workbook.SaveToFile(outputFileName);

    // Release resources
    workbook.Dispose();

    // Read the converted file from VFS and trigger download
    const fileArray = window.dotnetRuntime.Module.FS.readFile(outputFileName);
    const blob = new Blob([fileArray], { type: "application/vnd.openxmlformats-officedocument.spreadsheetml.sheet" });
    const url = URL.createObjectURL(blob);
    const a = document.createElement('a');
    a.href = url;
    a.download = outputFileName;
    a.click();
    URL.revokeObjectURL(url);
  };

  return (
    <div style={{ textAlign: 'center', height: '300px' }}>
      <h1>Style the Radar Chart</h1>
      <button onClick={styleRadarChart}>Start</button>
    </div>
  );
}

export default App;
After running, the effect of styling the radar chart:

Frequently Asked Questions
The radar chart does not change after setting a series color
Reason: A radar chart draws each series as a line, so setting a fill color with Series.get(i).Format.Fill has no effect.
Solution: Set the line color through Series.get(i).Format.LineProperties.Color, for example:
chart.Series.get(0).Format.LineProperties.Color = xlsModule.Color.get_Orange();
How do I adjust the legend position of a radar chart?
Reason: The legend is docked to the right of the chart by default, where it competes with the plot area for width — especially noticeable on a radar chart, which already takes up a lot of horizontal space.
Solution: Set the legend position with the chart.Legend.Position property. The available values are LegendPositionType.Bottom, Corner, Top, Right, Left, and NotDocked. For example, to move the legend to the top-right corner:
chart.Legend.Position = xlsModule.LegendPositionType.Corner;
Get a Free License
Spire.XLS for JavaScript offers a 30-day full-featured free trial license with no functional limitations. Apply here to evaluate before purchasing.
Create a Bubble Chart with JavaScript in React
In data analysis scenarios, bubble charts help intuitively display multi-dimensional data relationships. Each data point in a bubble chart is defined by three values: X-axis value, Y-axis value, and bubble size. Spire.XLS for JavaScript provides rich charting APIs that support creating bubble charts directly in the browser via WebAssembly, without requiring a backend service.
This article covers two core features:
For installation and project configuration, please refer to Integrating Spire.XLS for JavaScript in a React Project. The following examples assume Spire.XLS is already installed and the WebAssembly module has been initialized.
Create a Bubble Chart
A bubble chart can be added to a worksheet using the sheet.Charts.Add() method. The specific steps are as follows:
- Create a
Workbookobject and get the first worksheet. - Add a bubble chart via
Charts.Add(ExcelChartType.Bubble). - Set the
DataRangeproperty to specify the chart data area. - Set
SeriesDataFromRange = falseto indicate that data is not obtained from row/column layout. - Set
Series[0].Bubblesto specify the bubble size data range. - Set the chart title, position, and dimensions.
- Save the workbook via
Workbook.SaveToFile().
The following is a complete code example that demonstrates creating a bubble chart in React:
function App() {
  const createBubbleChart = async () => {
    // Get the Spire.XLS WASM module
    const xlsModule = window.wasmModule?.spirexls;

    // Check if the module is ready
    if (!xlsModule) {
      alert('Spire.Xls is not ready yet');
      return;
    }

    // Load the Excel file into VFS
    const inputFileName = 'CreateBubbleChart.xlsx';
    await window.spire.FetchFileToVFS(inputFileName, '', `${process.env.PUBLIC_URL}/static/data/`);

    // Load the workbook
    const workbook = new xlsModule.Workbook();
    workbook.LoadFromFile(inputFileName);

    // Get the first worksheet
    let sheet = workbook.Worksheets.get(0);

    // Add a bubble chart
    let chart = sheet.Charts.Add({ chartType: xlsModule.ExcelChartType.Bubble });

    // Set the chart data range
    chart.DataRange = sheet.Range.get("A1:C5");
    chart.SeriesDataFromRange = false;

    // Set the bubble sizes
    chart.Series.get(0).Bubbles = sheet.Range.get("C2:C5");

    // Set the chart position
    chart.LeftColumn = 7;
    chart.TopRow = 6;
    chart.RightColumn = 16;
    chart.BottomRow = 29;

    // Set the chart title
    chart.ChartTitle = "Bubble Chart";
    chart.ChartTitleArea.IsBold = true;
    chart.ChartTitleArea.Size = 12;

    // Save the workbook
    const outputFileName = 'CreateBubbleChart.xlsx';
    workbook.SaveToFile(outputFileName);

    // Dispose resources
    workbook.Dispose();

    // Read the converted file from VFS and trigger download
    const fileArray = window.dotnetRuntime.Module.FS.readFile(outputFileName);
    const blob = new Blob([fileArray], { type: "application/vnd.openxmlformats-officedocument.spreadsheetml.sheet" });
    const url = URL.createObjectURL(blob);
    const a = document.createElement('a');
    a.href = url;
    a.download = outputFileName;
    a.click();
    URL.revokeObjectURL(url);
  };

  return (
    <div style={{ textAlign: 'center', height: '300px' }}>
      <h1>Create Bubble Chart</h1>
      <button onClick={createBubbleChart}>Start</button>
    </div>
  );
}

export default App;
After running the code, the effect of creating a bubble chart is as follows:

Style the Bubble Chart
After creating a bubble chart, you can enhance its appearance by setting the chart area, plot area, and series colors. The specific steps are as follows:
- Get the created bubble chart object.
- Set the
ChartArea.Fill.ForeColorproperty to set the chart background color. - Set the
PlotArea.Fill.ForeColorproperty to set the plot area background color. - Set the
Series[0].Format.Fill.ForeColorproperty to set the series color. - Set the
Series[0].HasDataLabelsproperty to enable data labels, and specify the label content throughDataPoints.DefaultDataPoint.DataLabels. - Save the workbook.
The following is a complete code example that demonstrates how to style a bubble chart:
function App() {
  const styleBubbleChart = async () => {
    // Get the Spire.XLS WASM module
    const xlsModule = window.wasmModule?.spirexls;

    // Check if the module is ready
    if (!xlsModule) {
      alert('Spire.Xls is not ready yet');
      return;
    }

    // Load the Excel file into VFS
    const inputFileName = 'CreateBubbleChart.xlsx';
    await window.spire.FetchFileToVFS(inputFileName, '', `${process.env.PUBLIC_URL}/static/data/`);

    // Load the workbook
    const workbook = new xlsModule.Workbook();
    workbook.LoadFromFile(inputFileName);

    // Get the first worksheet
    let sheet = workbook.Worksheets.get(0);

    // Add a bubble chart
    let chart = sheet.Charts.Add({ chartType: xlsModule.ExcelChartType.Bubble });

    // Set the chart data range
    chart.DataRange = sheet.Range.get("A1:C5");
    chart.SeriesDataFromRange = false;

    // Set the bubble sizes
    chart.Series.get(0).Bubbles = sheet.Range.get("C2:C5");

    // Set the chart position
    chart.LeftColumn = 7;
    chart.TopRow = 6;
    chart.RightColumn = 16;
    chart.BottomRow = 29;

    // Set the chart title
    chart.ChartTitle = "Bubble Chart";
    chart.ChartTitleArea.IsBold = true;
    chart.ChartTitleArea.Size = 12;

    // Style the bubble chart
    // Set chart area background color
    chart.ChartArea.Fill.ForeColor = xlsModule.Color.get_LightCyan();
    // Set plot area background color
    chart.PlotArea.Fill.ForeColor = xlsModule.Color.get_LightYellow();
    // Set series color
    chart.Series.get(0).Format.Fill.FillType = xlsModule.ShapeFillType.SolidColor;
    chart.Series.get(0).Format.Fill.ForeColor = xlsModule.Color.get_Orange();
    // Enable and set data labels
    chart.Series.get(0).HasDataLabels = true;
    chart.Series.get(0).DataPoints.DefaultDataPoint.DataLabels.HasCategoryName = true;
    chart.Series.get(0).DataPoints.DefaultDataPoint.DataLabels.HasValue = true;

    // Save the workbook
    const outputFileName = 'StyledBubbleChart.xlsx';
    workbook.SaveToFile(outputFileName);

    // Dispose resources
    workbook.Dispose();

    // Read the converted file from VFS and trigger download
    const fileArray = window.dotnetRuntime.Module.FS.readFile(outputFileName);
    const blob = new Blob([fileArray], { type: "application/vnd.openxmlformats-officedocument.spreadsheetml.sheet" });
    const url = URL.createObjectURL(blob);
    const a = document.createElement('a');
    a.href = url;
    a.download = outputFileName;
    a.click();
    URL.revokeObjectURL(url);
  };

  return (
    <div style={{ textAlign: 'center', height: '300px' }}>
      <h1>Style Bubble Chart</h1>
      <button onClick={styleBubbleChart}>Start</button>
    </div>
  );
}

export default App;
After running the code, the effect of styling the bubble chart is as follows:

Frequently Asked Questions
What do columns A, B, and C in DataRange represent?
Reason: Each data point in a bubble chart needs three values — an X-axis value, a Y-axis value, and a bubble size — and the three columns specified by DataRange correspond to them exactly.
Solution: Taking chart.DataRange = sheet.Range.get("A1:C5") as an example, column A serves as the category (X axis), column B as the Y-axis value, and column C is set as the bubble size through chart.Series.get(0).Bubbles = sheet.Range.get("C2:C5"). The order of these three columns cannot be swapped, or both the point positions and the bubble sizes will be wrong.
Why does the data range start at A1 instead of A2?
Reason: The first row of the data range is used as the series name.
Solution: Include the header row in DataRange. In the example, the "Sales" shown in the legend comes from cell B1, so the data range is written as A1:C5 rather than A2:C5.
Get a Free License
Spire.XLS for JavaScript offers a 30-day full-featured free trial license with no functional limitations. Apply here to evaluate before purchasing.
Add Trendline to Excel Charts in React with JavaScript
In data analysis scenarios, trendlines help you visually identify data trends and predict directions from Excel charts. Spire.XLS for JavaScript provides rich trendline APIs that allow you to add various types of trendlines to chart series directly in the browser via WebAssembly, without requiring a backend service.
This article covers two core features:
For installation and project configuration, please refer to Integrating Spire.XLS for JavaScript in a React Project. The following examples assume Spire.XLS is installed and the WebAssembly module has been initialized.
Add Trendline to Chart
You can add trendlines to any series in a chart through the chart.Series.get(i).TrendLines.Add() method. Spire.XLS for JavaScript supports 4 types of trendlines defined in the TrendLineType enumeration:
Linear— Linear trendline, suitable for data showing steady increase or decreaseExponential— Exponential trendline, suitable for scenarios where the growth or decline rate acceleratesLogarithmic— Logarithmic trendline, suitable for data that changes rapidly then stabilizesMoving_Average— Moving average trendline, suitable for smoothing data fluctuations
Specific steps:
- Create a
Workbookobject and get the first worksheet. - Get the chart that needs a trendline through
Worksheet.Charts.get(i). - Call
chart.Series.get(0).TrendLines.Add()with thetypeparameter specifying the trendline type. - Save the workbook through
Workbook.SaveToFile().
Below is a complete code example showing how to add four different types of trendlines to an Excel chart in React:
function App() {
  const addTrendline = async () => {
    // Get the Spire.XLS WASM module
    const xlsModule = window.wasmModule?.spirexls;

    // Check if the module is ready
    if (!xlsModule) {
      alert('Spire.Xls is not ready yet');
      return;
    }

    // Load the Excel file into VFS
    const inputFileName = 'ChartTrendline_en.xlsx';
    await window.spire.FetchFileToVFS(inputFileName, '', `${process.env.PUBLIC_URL}data/`);

    // Load the workbook
    const workbook = new xlsModule.Workbook();
    workbook.LoadFromFile({ fileName: inputFileName });

    // Get the first chart from the first worksheet
    let chart = workbook.Worksheets.get(0).Charts.get(0);

    // Add linear trendline
    chart.ChartTitle = "Linear Trendline";
    chart.Series.get(0).TrendLines.Add({ type: xlsModule.TrendLineType.Linear });

    // Add exponential trendline
    chart = workbook.Worksheets.get(0).Charts.get(0);
    chart.ChartTitle = "Exponential Trendline";
    chart.Series.get(0).TrendLines.Add({ type: xlsModule.TrendLineType.Exponential });

    // Add logarithmic trendline
    chart.ChartTitle = "Logarithmic Trendline";
    chart.Series.get(0).TrendLines.Add({ type: xlsModule.TrendLineType.Logarithmic });

    // Add moving average trendline
    chart.ChartTitle = "Moving Average Trendline";
    chart.Series.get(0).TrendLines.Add({ type: xlsModule.TrendLineType.Moving_Average });

    // Save the document
    const outputFileName = 'AddTrendline.xlsx';
    workbook.SaveToFile({ fileName: outputFileName, version: xlsModule.ExcelVersion.Version2010 });

    // Release resources
    workbook.Dispose();

    // Read the converted file from VFS and trigger download
    const fileArray = window.dotnetRuntime.Module.FS.readFile(outputFileName);
    const blob = new Blob([fileArray], { type: 'application/vnd.openxmlformats-officedocument.spreadsheetml.sheet' });
    const url = URL.createObjectURL(blob);
    const a = document.createElement('a');
    a.href = url;
    a.download = outputFileName;
    a.click();
    URL.revokeObjectURL(url);
  };

  return (
    <div style={{ textAlign: 'center', height: '300px' }}>
      <h1>Add Trendline to Chart</h1>
      <button onClick={addTrendline}>Start</button>
    </div>
  );
}

export default App;
After running the code, you get the effect of adding four different types of trendlines to a chart:

Extract Trendline Formula
You can obtain the mathematical formula of a trendline through the trendLine.Formula property, making it easy to display the trendline's analytical expression in reports.
Specific steps:
- Load the
AddTrendline.xlsxfile generated in Step 1, which contains four charts. - Use
Worksheet.Charts.get(i)to iterate through all four charts. - Read the
trendLine.Formulaproperty from each chart to obtain the formula string, then save all formulas to a text file.
Below is a complete code example showing how to extract trendline formulas in React:
function App() {
  const extractTrendlineFormula = async () => {
    // Get the Spire.XLS WASM module
    const xlsModule = window.wasmModule?.spirexls;

    // Check if the module is ready
    if (!xlsModule) {
      alert('Spire.Xls is not ready yet');
      return;
    }

    // Load the AddTrendline.xlsx file generated in Step 1 into VFS
    const inputFileName = 'AddTrendline.xlsx';
    await window.spire.FetchFileToVFS(inputFileName, '', `${process.env.PUBLIC_URL}data/`);

    // Load the workbook
    const workbook = new xlsModule.Workbook();
    workbook.LoadFromFile({ fileName: inputFileName });

    // Get the first worksheet
    let sheet = workbook.Worksheets.get(0);
    let result = "Extracted trendline formulas from four charts:\n\n";

    // Iterate through all four charts and extract trendline formulas
    for (let i = 0; i < 4; i++) {
      let chart = sheet.Charts.get(i);
      let trendLine = chart.Series.get(0).TrendLines.get(0);
      // Moving average trendline has no mathematical formula
      if (trendLine.Type === xlsModule.TrendLineType.Moving_Average) {
        result += `Chart ${i + 1} (${chart.ChartTitle}): N/A (Moving Average)\n`;
      } else {
        let formula = trendLine.Formula;
        result += `Chart ${i + 1} (${chart.ChartTitle}): ${formula}\n`;
      }
    }

    // Release resources
    workbook.Dispose();

    // Save the formulas to a text file and trigger download
    const outputFileName = 'ExtractTrendline.txt';
    const blob = new Blob([result], { type: "text/plain;charset=utf-8" });
    const url = URL.createObjectURL(blob);
    const a = document.createElement('a');
    a.href = url;
    a.download = outputFileName;
    a.click();
    URL.revokeObjectURL(url);
  };

  return (
    <div style={{ textAlign: 'center', height: '300px' }}>
      <h1>Extract Trendline Formula</h1>
      <button onClick={extractTrendlineFormula}>Start</button>
    </div>
  );
}

export default App;
After running the code, you get the effect of extracting trendline formulas:

FAQ
How to delete an added trendline from a chart?
Cause: A trendline has already been added to the chart, but it needs to be removed or replaced.
Solution: Use the TrendLines.RemoveAt(index) method to remove a trendline at a specific index. Indexing starts from 0. For example, chart.Series.get(0).TrendLines.RemoveAt(0) removes the first trendline from the first series.
How to set forward/backward prediction periods for a trendline?
Cause: A trendline can not only fit existing data, but also predict future or past values based on the trend.
Solution: Use the trendLine.Forward and trendLine.Backward properties to set the number of prediction periods forward and backward respectively. For example, trendLine.Forward = 2 predicts two periods beyond the current data, while trendLine.Backward = 1 extrapolates one period before the data.
Get Free License
Spire.XLS for JavaScript offers a 30-day full-featured free trial license with no functional limitations. Apply here to evaluate before purchasing.
Insert Lines in Excel using JavaScript in React
When creating flowcharts, relationship diagrams, or data annotations, inserting lines into an Excel worksheet is a common requirement. Spire.XLS for JavaScript provides rich line APIs for creating various line types (straight lines, curved lines, elbow connectors, etc.) and arrow-tipped connectors. All operations are performed directly in the browser based on WebAssembly, with no backend service required.
This article covers two core features:
For installation and project configuration, refer to Integrating Spire.XLS for JavaScript in a React Project. The examples below assume Spire.XLS is installed and the WebAssembly module is initialized.
Insert Different Types of Lines
The sheet.Lines.AddLine() method inserts line shapes at a specified position. Using the LineShapeType enum, you can create various line types: straight lines (Line), curved lines (CurveLine), elbow connectors (ElbowLine), and inverted lines (LineInv). The appearance of lines can be customized through properties such as DashStyle (dash style), Color (color), and Weight (thickness).
The main steps are as follows:
- Create a
Workbookobject and get the first worksheet. - Call the
Worksheet.Lines.AddLine()method, passing position parameters andLineShapeTypeto specify the line type. - Customize line appearance through the
DashStyle,Color,Weight, andEndArrowHeadStyleproperties. - Save the workbook with the
Workbook.SaveToFile()method.
Here is a complete code example showing how to insert four different types of lines into Excel in React:
function App() {
  const addLineShapes = async () => {
    // Get the Spire.XLS WASM module
    const xlsModule = window.wasmModule?.spirexls;

    // Check whether the module is ready
    if (!xlsModule) {
      alert('Spire.Xls is not ready yet');
      return;
    }

    // Load the font into the VFS for text measurement and column auto-fit
    await window.spire.FetchFileToVFS('ARIAL.TTF', '/Library/Fonts/', `${process.env.PUBLIC_URL}/font/`);

    // Create a new workbook and get the first worksheet
    const workbook = new xlsModule.Workbook();
    const sheet = workbook.Worksheets.get(0);

    // Add a straight line - solid, CadetBlue, weight 2, with arrow
    let line1 = sheet.Lines.AddLine({ row: 10, column: 2, width: 200, height: 1, lineShapeType: xlsModule.LineShapeType.Line });
    line1.DashStyle = xlsModule.ShapeDashLineStyleType.Solid;
    line1.Color = xlsModule.Color.get_CadetBlue();
    line1.Weight = 2;
    line1.EndArrowHeadStyle = xlsModule.ShapeArrowStyleType.LineArrow;

    // Add a curved line - dotted, OrangeRed, weight 2
    let line2 = sheet.Lines.AddLine({ row: 12, column: 2, width: 200, height: 1, lineShapeType: xlsModule.LineShapeType.CurveLine });
    line2.DashStyle = xlsModule.ShapeDashLineStyleType.Dotted;
    line2.Color = xlsModule.Color.get_OrangeRed();
    line2.Weight = 2;

    // Add an elbow connector - DashDotDot, Purple, weight 2
    let line3 = sheet.Lines.AddLine({ row: 14, column: 2, width: 200, height: 1, lineShapeType: xlsModule.LineShapeType.ElbowLine });
    line3.DashStyle = xlsModule.ShapeDashLineStyleType.DashDotDot;
    line3.Color = xlsModule.Color.get_Purple();
    line3.Weight = 2;

    // Add an inverted line - Dashed, Green, weight 2
    let line4 = sheet.Lines.AddLine({ row: 16, column: 2, width: 200, height: 1, lineShapeType: xlsModule.LineShapeType.LineInv });
    line4.DashStyle = xlsModule.ShapeDashLineStyleType.Dashed;
    line4.Color = xlsModule.Color.get_Green();
    line4.Weight = 2;

    // Save the workbook
    const outputFileName = 'AddLineShapes.xlsx';
    workbook.SaveToFile({ fileName: outputFileName, version: xlsModule.ExcelVersion.Version2010 });

    // Release resources
    workbook.Dispose();

    // Read the saved file from the VFS and trigger the download
    const fileArray = window.dotnetRuntime.Module.FS.readFile(outputFileName);
    const blob = new Blob([fileArray], { type: 'application/vnd.openxmlformats-officedocument.spreadsheetml.sheet' });
    const url = URL.createObjectURL(blob);
    const a = document.createElement('a');
    a.href = url;
    a.download = outputFileName;
    a.click();
    URL.revokeObjectURL(url);
  };

  return (
    <div style={{ textAlign: 'center', height: '300px' }}>
      <h1>Add Line Shapes</h1>
      <button onClick={addLineShapes}>Start</button>
    </div>
  );
}

export default App;
Effect of inserting different line types:

Insert Arrow-Tipped Lines
The sheet.TypedLines.AddLine() method inserts arrow-tipped lines. Unlike Lines.AddLine(), TypedLines supports precise positioning using pixel coordinates or row/column coordinates, and supports setting different arrow head styles on both ends (beginning BeginArrowHeadStyle and end EndArrowHeadStyle).
The main steps are as follows:
- Create a
Workbookobject and get the first worksheet. - Call the
Worksheet.TypedLines.AddLine()method to create a line. - Set line position through the
Top,Left,Width, andHeightproperties (in pixels). - Set arrow styles on both ends through
BeginArrowHeadStyleandEndArrowHeadStyle. - Specify the line type through
LineShapeType(straight, elbow, curved, etc.). - Save the workbook with the
Workbook.SaveToFile()method.
Here is a complete code example showing how to insert six different types of arrow lines into Excel in React:
function App() {
  const addArrowLines = async () => {
    // Get the Spire.XLS WASM module
    const xlsModule = window.wasmModule?.spirexls;

    // Check whether the module is ready
    if (!xlsModule) {
      alert('Spire.Xls is not ready yet');
      return;
    }

    // Load the font into the VFS for text measurement and column auto-fit
    await window.spire.FetchFileToVFS('ARIAL.TTF', '/Library/Fonts/', `${process.env.PUBLIC_URL}/font/`);

    // Create a new workbook and get the first worksheet
    const workbook = new xlsModule.Workbook();
    const sheet = workbook.Worksheets.get(0);

    // Add a double-arrow line - solid blue
    let line = sheet.TypedLines.AddLine();
    line.Top = 10;
    line.Left = 20;
    line.Width = 100;
    line.Height = 0;
    line.Color = xlsModule.Color.get_Blue();
    line.BeginArrowHeadStyle = xlsModule.ShapeArrowStyleType.LineArrow;
    line.EndArrowHeadStyle = xlsModule.ShapeArrowStyleType.LineArrow;

    // Add a single-arrow line - solid red
    let line_1 = sheet.TypedLines.AddLine();
    line_1.Top = 50;
    line_1.Left = 30;
    line_1.Width = 100;
    line_1.Height = 100;
    line_1.Color = xlsModule.Color.get_Red();
    line_1.BeginArrowHeadStyle = xlsModule.ShapeArrowStyleType.LineNoArrow;
    line_1.EndArrowHeadStyle = xlsModule.ShapeArrowStyleType.LineArrow;

    // Add an elbow arrow connector
    let line3 = sheet.TypedLines.AddLine();
    line3.LineShapeType = xlsModule.LineShapeType.ElbowLine;
    line3.Width = 30;
    line3.Height = 50;
    line3.EndArrowHeadStyle = xlsModule.ShapeArrowStyleType.LineArrow;
    line3.Top = 100;
    line3.Left = 50;

    // Add an elbow double-arrow connector
    let line2 = sheet.TypedLines.AddLine();
    line2.LineShapeType = xlsModule.LineShapeType.ElbowLine;
    line2.Width = 50;
    line2.Height = 50;
    line2.EndArrowHeadStyle = xlsModule.ShapeArrowStyleType.LineArrow;
    line2.BeginArrowHeadStyle = xlsModule.ShapeArrowStyleType.LineArrow;
    line2.Left = 120;
    line2.Top = 100;

    // Add a curved arrow connector
    line3 = sheet.TypedLines.AddLine();
    line3.LineShapeType = xlsModule.LineShapeType.CurveLine;
    line3.Width = 30;
    line3.Height = 50;
    line3.EndArrowHeadStyle = xlsModule.ShapeArrowStyleType.LineArrowOpen;
    line3.Top = 100;
    line3.Left = 200;

    // Add a curved double-arrow connector
    line2 = sheet.TypedLines.AddLine();
    line2.LineShapeType = xlsModule.LineShapeType.CurveLine;
    line2.Width = 30;
    line2.Height = 50;
    line2.EndArrowHeadStyle = xlsModule.ShapeArrowStyleType.LineArrowOpen;
    line2.BeginArrowHeadStyle = xlsModule.ShapeArrowStyleType.LineArrowOpen;
    line2.Left = 250;
    line2.Top = 100;

    // Save the workbook
    const outputFileName = 'AddArrowLines.xlsx';
    workbook.SaveToFile({ fileName: outputFileName, version: xlsModule.ExcelVersion.Version2010 });

    // Release resources
    workbook.Dispose();

    // Read the saved file from the VFS and trigger the download
    const fileArray = window.dotnetRuntime.Module.FS.readFile(outputFileName);
    const blob = new Blob([fileArray], { type: 'application/vnd.openxmlformats-officedocument.spreadsheetml.sheet' });
    const url = URL.createObjectURL(blob);
    const a = document.createElement('a');
    a.href = url;
    a.download = outputFileName;
    a.click();
    URL.revokeObjectURL(url);
  };

  return (
    <div style={{ textAlign: 'center', height: '300px' }}>
      <h1>Add Arrow Lines</h1>
      <button onClick={addArrowLines}>Start</button>
    </div>
  );
}

export default App;
Effect of inserting arrow-tipped lines:

Frequently Asked Questions
How do I retrieve and modify existing lines in a worksheet?
Reason: An Excel file with existing lines was imported, but it's unclear how to read or modify them.
Solution: Traverse the sheet.Shapes collection to retrieve line shape objects, then modify their properties via the ILineShape interface. For example, sheet.Shapes.get(0) gets the first shape, and after confirming it's a line type, you can modify properties like color, dash style, etc.
How do I delete lines from an Excel worksheet?
Reason: Need to remove excess lines that were created or imported.
Solution: Use sheet.Shapes.Remove(index) to delete a line object at a specified index from the shapes collection, or iterate through the Shapes collection to delete them one by one based on name or type conditions.
Get a Free License
Spire.XLS for JavaScript offers a 30-day full-featured free trial license with no functional limitations. Apply here to evaluate before purchasing.
Create Exploded Pie and Doughnut Charts in Excel with JavaScript in React
Pie charts and doughnut charts are the most intuitive chart types for showing the proportion of each data item. An exploded pie chart or exploded doughnut chart pulls all the slices apart, which makes every part stand out more clearly. Spire.XLS for JavaScript completes this directly in the browser based on WebAssembly, managing input/output files through a virtual file system (VFS), with no backend service required.
This article introduces two core features:
For installation and project configuration, refer to Integrating Spire.XLS for JavaScript in a React Project. The examples below assume Spire.XLS is installed and the WebAssembly module is initialized.
Create an Exploded Pie Chart
The slices of an exploded pie chart are separated from each other, which is suitable for highlighting the proportion of each data item. To create an exploded pie chart, follow these steps:
- Create a
Workbookobject and use theLoadFromFile()method to load the Excel file that contains the data. - Use the
Workbook.Worksheets.get()method to get the worksheet that contains the data. - Call the
Charts.Add()method to add a chart and set theChartTypetoExcelChartType.PieExploded. - Use the
Series.CategoryLabelsandSeries.Valuesproperties to specify the categories and values of the chart. - Set properties such as the chart title, position and data labels.
- Use the
Workbook.SaveToFile()method to save the workbook.
Here is a complete code example showing how to create an exploded pie chart from the product sales data in a worksheet in React:
function App() {
  const createExplodedPieChart = async () => {
    // Get the Spire.XLS WASM module
    const xlsModule = window.wasmModule?.spirexls;

    // Check whether the module is ready
    if (!xlsModule) {
      alert('Spire.Xls is not ready yet');
      return;
    }

    // Load the font and Excel file into the VFS
    await window.spire.FetchFileToVFS('ARIAL.TTF', '/Library/Fonts/', `${process.env.PUBLIC_URL}/font/`);
    const inputFileName = 'SalesData.xlsx';
    await window.spire.FetchFileToVFS(inputFileName, '', `${process.env.PUBLIC_URL}data/`);

    // Load the workbook and get the worksheet that contains the data
    const workbook = new xlsModule.Workbook();
    workbook.LoadFromFile({ fileName: inputFileName });
    const sheet = workbook.Worksheets.get(0);

    // Add a chart and set its chart type to an exploded pie chart
    const chart = sheet.Charts.Add();
    chart.ChartType = xlsModule.ExcelChartType.PieExploded;

    // Set the data range and the title of the chart
    chart.DataRange = sheet.Range.get("B2:B7");
    chart.SeriesDataFromRange = false;
    chart.ChartTitle = "Product Sales Share";
    chart.ChartTitleArea.IsBold = true;
    chart.ChartTitleArea.Size = 12;

    // Set the category labels and the values of the chart, and show the value labels
    const cs = chart.Series.get(0);
    cs.CategoryLabels = sheet.Range.get("A2:A7");
    cs.Values = sheet.Range.get("B2:B7");
    cs.DataPoints.DefaultDataPoint.DataLabels.HasValue = true;

    // Set the position of the chart
    chart.LeftColumn = 4;
    chart.TopRow = 1;
    chart.RightColumn = 15;
    chart.BottomRow = 25;

    // Hide the background of the plot area and set the position of the legend
    chart.PlotArea.Fill.Visible = false;
    chart.Legend.Position = xlsModule.LegendPositionType.Right;

    // Save the document
    const outputFileName = 'ExplodedPieChart_output.xlsx';
    workbook.SaveToFile({ fileName: outputFileName });

    // Release resources
    workbook.Dispose();

    // Read the converted file from the VFS and trigger a download
    const fileArray = window.dotnetRuntime.Module.FS.readFile(outputFileName);
    const blob = new Blob([fileArray], { type: 'application/vnd.openxmlformats-officedocument.spreadsheetml.sheet' });
    const url = URL.createObjectURL(blob);
    const a = document.createElement('a');
    a.href = url;
    a.download = outputFileName;
    a.click();
    URL.revokeObjectURL(url);
  };

  return (
    <div style={{ textAlign: 'center', height: '300px' }}>
      <h1>Create Exploded Pie Chart</h1>
      <button onClick={createExplodedPieChart}>
        Start
      </button>
    </div>
  );
}

export default App;
After running the code, you can see the effect of the exploded pie chart:
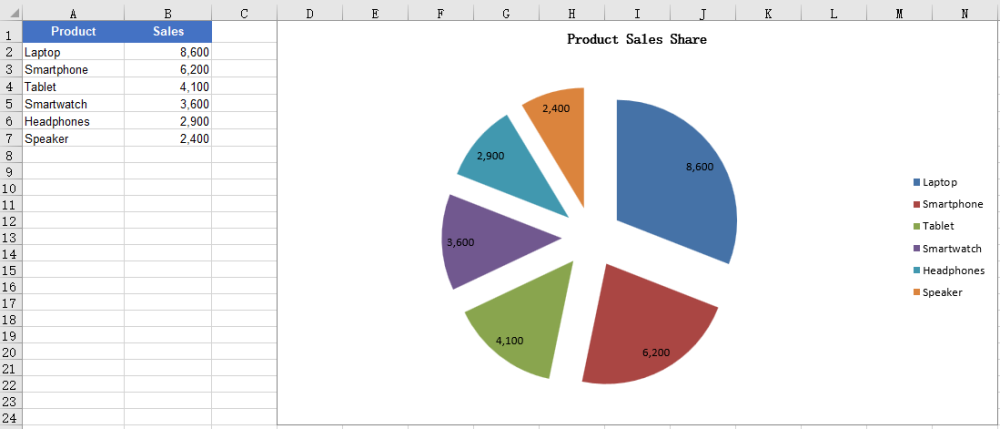
Create an Exploded Doughnut Chart
A doughnut chart is similar to a pie chart, but it has a hole in the center and can also show the proportion of each part in the whole. An exploded doughnut chart further pulls the slices apart. To create an exploded doughnut chart, follow these steps:
- Create a
Workbookobject and use theLoadFromFile()method to load the Excel file that contains the data. - Use the
Workbook.Worksheets.get()method to get the worksheet that contains the data. - Call the
Charts.Add()method to add a chart and set theChartTypetoExcelChartType.DoughnutExploded. - Use the
Series.CategoryLabelsandSeries.Valuesproperties to specify the categories and values of the chart. - Set properties such as the chart title, position and data labels.
- Use the
Workbook.SaveToFile()method to save the workbook.
Here is a complete code example showing how to create an exploded doughnut chart from the product sales data in a worksheet in React:
function App() {
  const createExplodedDoughnutChart = async () => {
    // Get the Spire.XLS WASM module
    const xlsModule = window.wasmModule?.spirexls;

    // Check whether the module is ready
    if (!xlsModule) {
      alert('Spire.Xls is not ready yet');
      return;
    }

    // Load the font and Excel file into the VFS
    await window.spire.FetchFileToVFS('ARIAL.TTF', '/Library/Fonts/', `${process.env.PUBLIC_URL}/font/`);
    const inputFileName = 'SalesData.xlsx';
    await window.spire.FetchFileToVFS(inputFileName, '', `${process.env.PUBLIC_URL}data/`);

    // Load the workbook and get the worksheet that contains the data
    const workbook = new xlsModule.Workbook();
    workbook.LoadFromFile({ fileName: inputFileName });
    const sheet = workbook.Worksheets.get(0);

    // Add a chart and set its chart type to an exploded doughnut chart
    const chart = sheet.Charts.Add();
    chart.ChartType = xlsModule.ExcelChartType.DoughnutExploded;

    // Set the data range and the title of the chart
    chart.DataRange = sheet.Range.get("B2:B7");
    chart.SeriesDataFromRange = false;
    chart.ChartTitle = "Sales Share by Product";
    chart.ChartTitleArea.IsBold = true;
    chart.ChartTitleArea.Size = 12;

    // Set the category labels and the values of the chart, and show the value labels
    const cs = chart.Series.get(0);
    cs.CategoryLabels = sheet.Range.get("A2:A7");
    cs.Values = sheet.Range.get("B2:B7");
    cs.DataPoints.DefaultDataPoint.DataLabels.HasValue = true;

    // Set the position of the chart
    chart.LeftColumn = 4;
    chart.TopRow = 1;
    chart.RightColumn = 15;
    chart.BottomRow = 25;

    // Hide the background of the plot area and set the position of the legend
    chart.PlotArea.Fill.Visible = false;
    chart.Legend.Position = xlsModule.LegendPositionType.Right;

    // Save the document
    const outputFileName = 'ExplodedDoughnutChart_output.xlsx';
    workbook.SaveToFile({ fileName: outputFileName });

    // Release resources
    workbook.Dispose();

    // Read the converted file from the VFS and trigger a download
    const fileArray = window.dotnetRuntime.Module.FS.readFile(outputFileName);
    const blob = new Blob([fileArray], { type: 'application/vnd.openxmlformats-officedocument.spreadsheetml.sheet' });
    const url = URL.createObjectURL(blob);
    const a = document.createElement('a');
    a.href = url;
    a.download = outputFileName;
    a.click();
    URL.revokeObjectURL(url);
  };

  return (
    <div style={{ textAlign: 'center', height: '300px' }}>
      <h1>Create Exploded Doughnut Chart</h1>
      <button onClick={createExplodedDoughnutChart}>
        Start
      </button>
    </div>
  );
}

export default App;
After running the code, you can see the effect of the exploded doughnut chart:
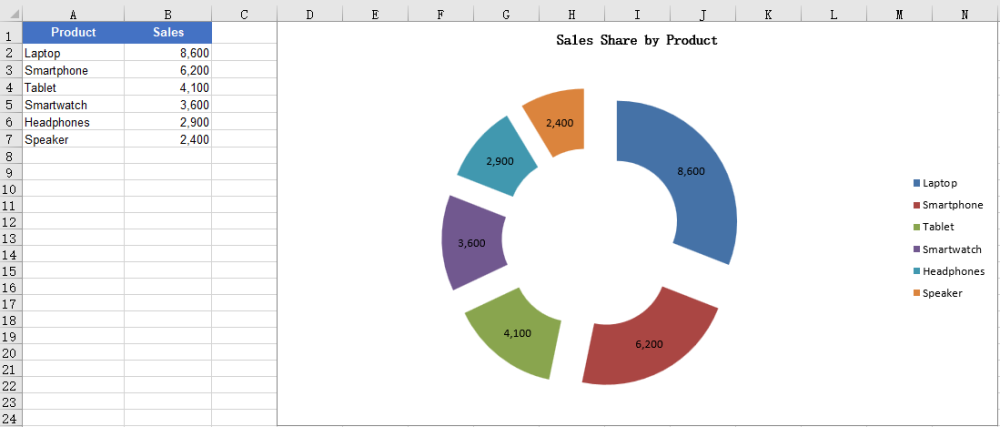
FAQ
The created chart is blank with no slices
Cause: The chart has no valid data series. For example, the DataRange or Values points to an empty range or a range without numbers, so the chart has no data to draw.
Solution: Assign a data range that contains the data to the chart, for example:
chart.DataRange = sheet.Range.get("A1:B7");

const cs = chart.Series.get(0);
cs.CategoryLabels = sheet.Range.get("A2:A7");
cs.Values = sheet.Range.get("B2:B7");
Want to show percentages instead of values in the data labels
Cause: Pie and doughnut charts are usually used to show proportions, but the data labels show values by default, or the percentage labels are not enabled.
Solution: Disable the value labels and enable the percentage labels, for example:
const cs = chart.Series.get(0);
cs.DataPoints.DefaultDataPoint.DataLabels.HasValue = false;
cs.DataPoints.DefaultDataPoint.DataLabels.HasPercentage = true;
Obtain a Free License
Spire.XLS for JavaScript offers a 30-day full-featured free trial license with no functional limitations. Apply here to evaluate before purchasing.
Different Headers and Footers in Excel with JavaScript in React
By default, Excel displays the same header and footer at the top and bottom of every page. However, when printing formal reports, manuals, or theses, it is often necessary for different pages to show different headers and footers — for example, odd and even pages can use different headers, or the first page can have no header/footer while only the body pages show the page number. Spire.XLS for JavaScript completes this directly in the browser based on WebAssembly, managing input/output files through a virtual file system (VFS), with no backend service required.
This article introduces two core features:
- Set Different Headers and Footers for Odd and Even Pages
- Set a Different Header and Footer on the First Page
For installation and project configuration, refer to Integrating Spire.XLS for JavaScript in a React Project. The examples below assume Spire.XLS is installed and the WebAssembly module is initialized.
Set Different Headers and Footers for Odd and Even Pages
In books, papers or reports printed on both sides of the page, odd and even pages usually use different headers and footers, for example the header of odd pages shows the chapter name and the header of even pages shows the book title. To set different headers and footers for odd and even pages with Spire.XLS for JavaScript, follow these steps:
- Create a
Workbookobject and use theLoadFromFile()method to load the Excel file. - Use the
Workbook.Worksheets.get()method to get the specified worksheet. - Set the
PageSetup.DifferentOddEvenproperty to1to enable different headers and footers for odd and even pages. - Use the
PageSetup.OddHeaderStringandPageSetup.OddFooterStringproperties to set the header and footer of odd pages. - Use the
PageSetup.EvenHeaderStringandPageSetup.EvenFooterStringproperties to set the header and footer of even pages. - Use the
Workbook.SaveToFile()method to save the workbook.
Here is a complete code example showing how to set different headers and footers for the odd and even pages of a worksheet in React (the sample input file contains data that spans multiple pages, making it easy to observe the effect on different pages):
function App() {
  const setOddEvenHeaderFooter = async () => {
    // Get the Spire.XLS WASM module
    const xlsModule = window.wasmModule?.spirexls;

    // Check whether the module is ready
    if (!xlsModule) {
      alert('Spire.Xls is not ready yet');
      return;
    }

    // Load the font and Excel file into the VFS
    await window.spire.FetchFileToVFS('ARIAL.TTF', '/Library/Fonts/', `${process.env.PUBLIC_URL}/font/`);
    const inputFileName = 'DifferentHeaderFooter.xlsx';
    await window.spire.FetchFileToVFS(inputFileName, '', `${process.env.PUBLIC_URL}data/`);

    // Load the workbook
    const workbook = new xlsModule.Workbook();
    workbook.LoadFromFile({ fileName: inputFileName });

    // Get the first worksheet
    const sheet = workbook.Worksheets.get(0);

    // Enable different headers and footers for odd and even pages
    sheet.PageSetup.DifferentOddEven = 1;

    // Set the header and footer for odd pages (orange, bold)
    sheet.PageSetup.OddHeaderString = "&\"Arial\"&12&B&KFFC000Odd Page Header";
    sheet.PageSetup.OddFooterString = "&\"Arial\"&12&B&KFFC000Odd Page Footer";

    // Set the header and footer for even pages (red, bold)
    sheet.PageSetup.EvenHeaderString = "&\"Arial\"&12&B&KFF0000Even Page Header";
    sheet.PageSetup.EvenFooterString = "&\"Arial\"&12&B&KFF0000Even Page Footer";

    // Switch to Page Layout view to preview the header and footer
    sheet.ViewMode = xlsModule.ViewMode.Layout;

    // Save the document
    const outputFileName = 'DifferentHeaderFooterOddEven_output.xlsx';
    workbook.SaveToFile({ fileName: outputFileName, version: xlsModule.ExcelVersion.Version2010 });

    // Release resources
    workbook.Dispose();

    // Read the converted file from the VFS and trigger a download
    const fileArray = window.dotnetRuntime.Module.FS.readFile(outputFileName);
    const blob = new Blob([fileArray], { type: 'application/vnd.openxmlformats-officedocument.spreadsheetml.sheet' });
    const url = URL.createObjectURL(blob);
    const a = document.createElement('a');
    a.href = url;
    a.download = outputFileName;
    a.click();
    URL.revokeObjectURL(url);
  };

  return (
    <div style={{ textAlign: 'center', height: '300px' }}>
      <h1>Set Different Header and Footer for Odd and Even Pages</h1>
      <button onClick={setOddEvenHeaderFooter}>
        Start
      </button>
    </div>
  );
}

export default App;
After this setting, different headers and footers are applied to odd and even pages.
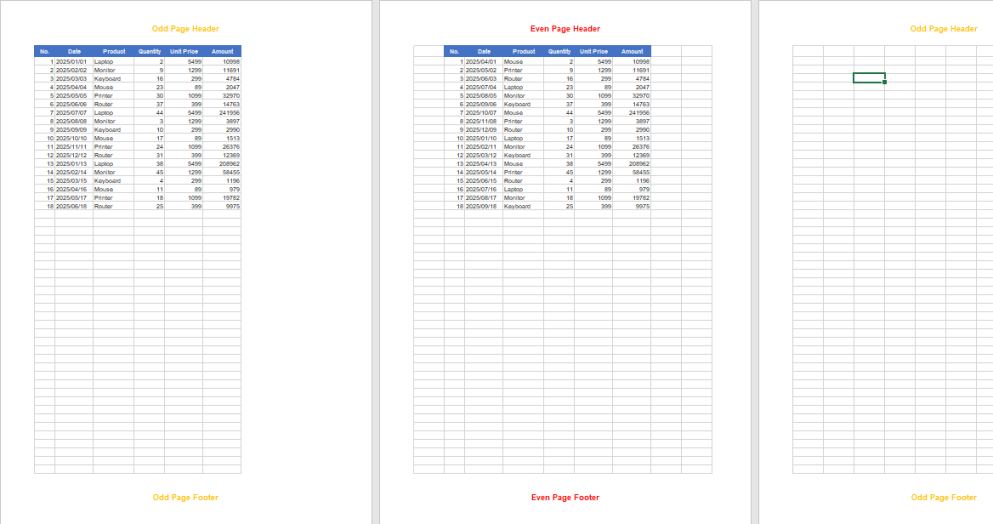
Set a Different Header and Footer on the First Page
Many formal documents require the first page (cover page) to display no header/footer or a dedicated header/footer, while the body pages display a header and footer carrying document information. In this case, you can enable "different first page" and set the header and footer of the first page separately. The steps are as follows:
- Create a
Workbookobject and use theLoadFromFile()method to load the Excel file. - Use the
Workbook.Worksheets.get()method to get the specified worksheet. - Set the
PageSetup.DifferentFirstproperty to1to enable a header and footer on the first page that differ from those on the other pages. - Use the
PageSetup.FirstHeaderStringandPageSetup.FirstFooterStringproperties to set the header and footer of the first page. - Use properties such as
PageSetup.LeftHeaderandPageSetup.CenterFooterto set the header and footer of the other pages. - Use the
Workbook.SaveToFile()method to save the workbook.
Here is a complete code example showing how to set a different header and footer on the first page of a worksheet in React:
function App() {
  const setFirstPageHeaderFooter = async () => {
    // Get the Spire.XLS WASM module
    const xlsModule = window.wasmModule?.spirexls;

    // Check whether the module is ready
    if (!xlsModule) {
      alert('Spire.Xls is not ready yet');
      return;
    }

    // Load the font and Excel file into the VFS
    await window.spire.FetchFileToVFS('ARIAL.TTF', '/Library/Fonts/', `${process.env.PUBLIC_URL}/font/`);
    const inputFileName = 'DifferentHeaderFooter.xlsx';
    await window.spire.FetchFileToVFS(inputFileName, '', `${process.env.PUBLIC_URL}data/`);

    // Load the workbook
    const workbook = new xlsModule.Workbook();
    workbook.LoadFromFile({ fileName: inputFileName });

    // Get the first worksheet
    const sheet = workbook.Worksheets.get(0);

    // Enable a different header and footer on the first page
    sheet.PageSetup.DifferentFirst = 1;

    // Set the header and footer for the first page (blue, bold)
    sheet.PageSetup.FirstHeaderString = "&\"Arial\"&16&B&K4253E2First Page Header";
    sheet.PageSetup.FirstFooterString = "&\"Arial\"&16&B&K4253E2First Page Footer";

    // Set the header and footer for the other pages (gray, bold)
    sheet.PageSetup.LeftHeader = "&\"Arial\"&12&B&K808080Other Pages Header";
    sheet.PageSetup.CenterFooter = "&\"Arial\"&12&B&K808080Other Pages Footer";

    // Switch to Page Layout view to preview the header and footer
    sheet.ViewMode = xlsModule.ViewMode.Layout;

    // Save the document
    const outputFileName = 'DifferentHeaderFooterFirstPage_output.xlsx';
    workbook.SaveToFile({ fileName: outputFileName, version: xlsModule.ExcelVersion.Version2010 });

    // Release resources
    workbook.Dispose();

    // Read the converted file from the VFS and trigger a download
    const fileArray = window.dotnetRuntime.Module.FS.readFile(outputFileName);
    const blob = new Blob([fileArray], { type: 'application/vnd.openxmlformats-officedocument.spreadsheetml.sheet' });
    const url = URL.createObjectURL(blob);
    const a = document.createElement('a');
    a.href = url;
    a.download = outputFileName;
    a.click();
    URL.revokeObjectURL(url);
  };

  return (
    <div style={{ textAlign: 'center', height: '300px' }}>
      <h1>Set Different Header and Footer on the First Page</h1>
      <button onClick={setFirstPageHeaderFooter}>
        Start
      </button>
    </div>
  );
}

export default App;
After this setting, the first page uses a different header and footer from the other pages.
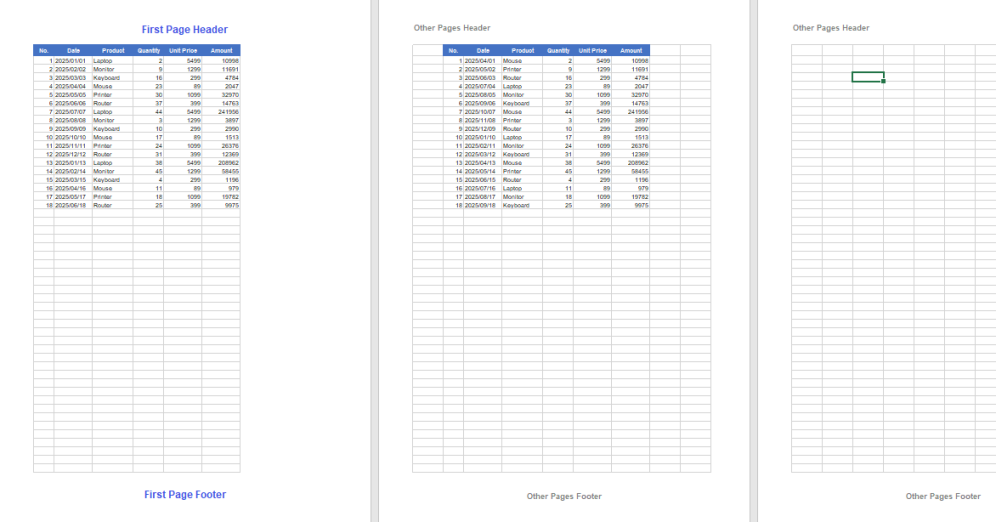
FAQ
The header and footer on the first page is not applied
Cause: The "different first page" option was not enabled. If only FirstHeaderString/FirstFooterString are set without setting PageSetup.DifferentFirst to 1, Excel ignores the first-page header and footer.
Solution: Enable sheet.PageSetup.DifferentFirst = 1; before setting the header and footer of the first page.
Header/footer text shows as garbled characters or boxes
Cause: Browser-side Excel processing depends on font files. If the font used by the text (such as ARIAL.TTF) has not been loaded into the virtual file system (VFS), the text may not render correctly.
Solution: Load the font into the VFS with FetchFileToVFS() before calling Workbook.LoadFromFile(), for example:
await window.spire.FetchFileToVFS(
  'ARIAL.TTF', '/Library/Fonts/', `${process.env.PUBLIC_URL}/font/`
);
Obtain a Free License
Spire.XLS for JavaScript offers a 30-day full-featured free trial license with no functional limitations. Apply here to evaluate before purchasing.