Set HTML Rich Text in Excel Cells in React with JavaScript
A product list or an order detail table rarely keeps one format per cell. A description note has to be split over several lines, only a few words of a promotion line deserve to stand out, and a stock warning needs to be picked out in red. Doing that by hand means double-clicking every cell, selecting the fragment and adjusting the font one by one, which does not scale past a handful of rows. An HTML string describes exactly this kind of content — one piece of text whose parts are styled differently — and Spire.XLS for JavaScript exposes the HtmlString property, which renders a piece of HTML straight into a cell: line breaks, bold, italic, underline, color and font size all follow the tags, so a batch is one assignment inside a loop. It runs entirely in the browser on WebAssembly, managing input and output files with a virtual file system (VFS) and requiring no backend service.
This article covers two feature points:
For installation and project setup, see Integrating Spire.XLS for JavaScript in a React Project. The examples below assume Spire.XLS is installed and the WebAssembly module has been initialized.
Write HTML text with line breaks into a cell
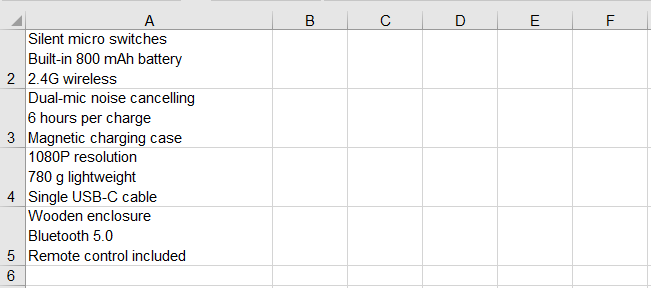
Breaking a line inside a cell normally means pressing Alt+Enter while editing it. When the data comes from a database or a form, that manual step cannot be batched, and the <br> tag in HTML means precisely "break the line here". HtmlString parses <br>, <div> and <p> into line breaks inside the cell, so a single string written into one cell becomes several lines. The steps are as follows:
- Load the font into the VFS.
- Create a workbook, take its first worksheet and widen column A.
- Build an HTML string for each entry, splitting the parts with
<br>. - Write them into the cells of column A with
HtmlString. - Save the workbook.
The complete code example below shows how to write HTML text with line breaks into an Excel cell in React:
function App() {
  const setMultilineText = async () => {
    // Get the Spire.XLS WASM module
    const xlsModule = window.wasmModule?.spirexls;

    // Check that the module is ready
    if (!xlsModule) {
      alert('Spire.Xls is not ready yet');
      return;
    }

    // Load the font into the VFS
    await window.spire.FetchFileToVFS('ARIAL.TTF', '/Library/Fonts/', `${process.env.PUBLIC_URL}/font/`);

    // Create a workbook, take the first worksheet and widen column A so a single line stays on one line
    const workbook = new xlsModule.Workbook();
    const sheet = workbook.Worksheets.get(0);
    sheet.Range.get('A1:A5').ColumnWidth = 30;

    // Each description has three parts, separated by <br> inside the same cell
    const notes = [
      'Bluetooth 5.3 dual pairing<br>30-hour battery<br>USB-C fast charge',
      'Silent micro switches<br>Built-in 800 mAh battery<br>2.4G wireless',
      'Dual-mic noise cancelling<br>6 hours per charge<br>Magnetic charging case',
      '1080P resolution<br>780 g lightweight<br>Single USB-C cable',
      'Wooden enclosure<br>Bluetooth 5.0<br>Remote control included',
    ];

    // Write the HTML strings into column A, three lines inside one cell
    notes.forEach((html, index) => {
      sheet.Range.get(`A${index + 1}`).HtmlString = html;
    });

    // Save the workbook
    const outputFileName = 'MultilineHtmlText.xlsx';
    workbook.SaveToFile({ fileName: outputFileName });

    // Release the resources
    workbook.Dispose();

    // Read the result file out of the VFS and trigger the download
    const fileArray = window.dotnetRuntime.Module.FS.readFile(outputFileName);
    const blob = new Blob([fileArray], { type: 'application/vnd.openxmlformats-officedocument.spreadsheetml.sheet' });
    const url = URL.createObjectURL(blob);
    const a = document.createElement('a');
    a.href = url;
    a.download = outputFileName;
    a.click();
    URL.revokeObjectURL(url);
  };

  return (
    <div style={{ textAlign: 'center', height: '300px' }}>
      <h1>Excel HTML rich text</h1>
      <button onClick={setMultilineText}>Multiline HTML text</button>
    </div>
  );
}

export default App;
After running, the effect of writing HTML text with line breaks into a cell:
Format part of the text in a cell
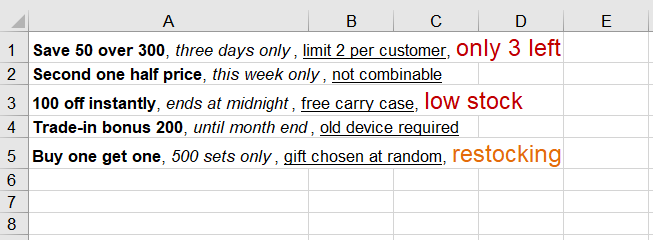
Text inside one cell does not have to share one format. Within a single run of text, only part of it usually needs to stand out, while the rest can stay at the regular weight. HtmlString supports the <b>, <i> and <u> tags, and takes color and font size in a style attribute on a <span>. Every fragment wrapped in a tag becomes its own run of formatting without affecting the others, and the tags themselves never appear in the cell. The steps are as follows:
- As in the previous section, load the font into the VFS, create a workbook, take the first worksheet and widen column A.
- Mark the text to emphasize with
<b>,<i>and<u>, and wrap the text to highlight in<span style="color:#C00000;font-size:14pt">, giving the color as a hexadecimal value and the size in points. - Write the strings into column A; the rest of the text in the same cell keeps its original format.
- Save the workbook.
The complete code example below shows how to format part of the text in an Excel cell in React:
function App() {
  const setPartialFormatting = async () => {
    // Get the Spire.XLS WASM module
    const xlsModule = window.wasmModule?.spirexls;

    // Check that the module is ready
    if (!xlsModule) {
      alert('Spire.Xls is not ready yet');
      return;
    }

    // Load the font into the VFS
    await window.spire.FetchFileToVFS('ARIAL.TTF', '/Library/Fonts/', `${process.env.PUBLIC_URL}/font/`);

    // Create a workbook, take the first worksheet and widen column A so a single line stays on one line
    const workbook = new xlsModule.Workbook();
    const sheet = workbook.Worksheets.get(0);
    sheet.Range.get('A1:A5').ColumnWidth = 30;

    // Each part of a promotion line gets its own <b>, <i>, <u> or styled <span>;
    // bold, italic, underline, color and font size apply only to the wrapped text
    const promotions = [
      '<b>Save 50 over 300</b>, <i>three days only</i>, <u>limit 2 per customer</u>, <span style="color:#C00000;font-size:14pt">only 3 left</span>',
      '<b>Second one half price</b>, <i>this week only</i>, <u>not combinable</u>',
      '<b>100 off instantly</b>, <i>ends at midnight</i>, <u>free carry case</u>, <span style="color:#C00000;font-size:14pt">low stock</span>',
      '<b>Trade-in bonus 200</b>, <i>until month end</i>, <u>old device required</u>',
      '<b>Buy one get one</b>, <i>500 sets only</i>, <u>gift chosen at random</u>, <span style="color:#E36C0A;font-size:14pt">restocking</span>',
    ];

    // Write the HTML strings into column A
    promotions.forEach((html, index) => {
      sheet.Range.get(`A${index + 1}`).HtmlString = html;
    });

    // Save the workbook
    const outputFileName = 'PartialFormattingHtml.xlsx';
    workbook.SaveToFile({ fileName: outputFileName });

    // Release the resources
    workbook.Dispose();

    // Read the result file out of the VFS and trigger the download
    const fileArray = window.dotnetRuntime.Module.FS.readFile(outputFileName);
    const blob = new Blob([fileArray], { type: 'application/vnd.openxmlformats-officedocument.spreadsheetml.sheet' });
    const url = URL.createObjectURL(blob);
    const a = document.createElement('a');
    a.href = url;
    a.download = outputFileName;
    a.click();
    URL.revokeObjectURL(url);
  };

  return (
    <div style={{ textAlign: 'center', height: '300px' }}>
      <h1>Excel HTML rich text</h1>
      <button onClick={setPartialFormatting}>Partial formatting</button>
    </div>
  );
}

export default App;
After running, the effect of formatting part of the text in a cell as bold, italic, underlined, colored or larger:
FAQ
Does the HTML parser swallow runs of spaces?
Cause: A browser collapses consecutive spaces into one when it renders HTML, which makes it easy to assume Spire does the same and to reach for to build any padding.
Solution: It does not. A B is still five spaces when read back out of the cell, and leading spaces survive as well. works too, but ordinary alignment does not need it.
Does writing rich text wipe out the alignment the cell already had?
Cause: HtmlString does change the cell's font properties, so it is fair to wonder whether it resets the alignment set earlier along with them.
Solution: The alignment is untouched. Set Style.HorizontalAlignment first and write the HtmlString afterwards, and the alignment reads back unchanged — setting the format before the content is safe.
const cell = sheet.Range.get('A1');
cell.Style.HorizontalAlignment = xlsModule.HorizontalAlignType.Center;
cell.HtmlString = '<b>Centered</b>';
Get a Free License
Spire.XLS for JavaScript offers a 30-day full-featured free trial license with no functional limitations. Apply here to evaluate before purchasing.
Add Gradient and Pattern Fills to Excel in React with JavaScript
A report whose header and total rows carry nothing but data and borders is hard to scan. Tinting those cells is the usual answer, but a flat color only goes so far: sometimes a light-to-dark sweep is what marks the important row, and sometimes a light dot or stripe texture sets the totals apart without burying the numbers underneath it. Spire.XLS for JavaScript supports both gradient and pattern fills through the Interior object, performing these operations directly in the browser through WebAssembly, managing input and output files with a virtual file system (VFS) and requiring no backend service.
This article covers two core feature points:
For installation and project setup, see Integrating Spire.XLS for JavaScript in a React Project. The examples below assume Spire.XLS is installed and the WebAssembly module has been initialized.
Apply a gradient fill to cells
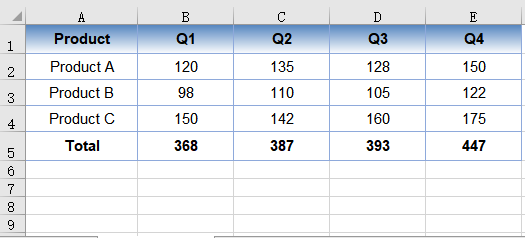
A gradient fill takes three steps: name the fill type, give the two ends their colors, and say how the transition runs. All three land on the same Interior object -- FillPattern picks the fill type, Gradient.ForeColor and Gradient.BackColor give the two ends their colors, and Gradient.TwoColorGradient takes two parameters: the direction comes from GradientStyleType, which covers horizontal, vertical, both diagonals and the spreads that radiate out from the centre or the corner, while the shading variant comes from GradientVariantsType and runs from ShadingVariants1 to ShadingVariants4. The same pair of colors reads completely differently once the direction and variant change. The steps are:
- Load the font and the sample data into the VFS.
- Create a
Workbook, load it withLoadFromFile, then get the first worksheet withWorksheets.get(0). - Take the header range with
Range.getand setStyle.Interior.FillPatterntoExcelPatternType.Gradient. - Give the two ends of the gradient their colors with
Gradient.ForeColorandGradient.BackColor. - Set the direction and the shading variant with
Gradient.TwoColorGradient. - Save the workbook with
SaveToFile.
The complete code example below shows how to apply a gradient fill to Excel cells in React:
function App() {
  const applyGradient = async () => {
    // Get the Spire.XLS WASM module
    const xlsModule = window.wasmModule?.spirexls;

    // Check if the module is ready
    if (!xlsModule) {
      alert('Spire.Xls is not ready yet');
      return;
    }

    // Load the font and the sample data into the VFS
    await window.spire.FetchFileToVFS('ARIAL.TTF', '/Library/Fonts/', `${process.env.PUBLIC_URL}/font/`);
    const inputFileName = 'FillSample_EN.xlsx';
    await window.spire.FetchFileToVFS(inputFileName, '', `${process.env.PUBLIC_URL}data/`);

    // Load the workbook and get the first worksheet
    const workbook = new xlsModule.Workbook();
    workbook.LoadFromFile({ fileName: inputFileName });
    const sheet = workbook.Worksheets.get(0);

    // Take the header row, A1:E1
    const header = sheet.Range.get('A1:E1');

    // Set the fill type to a gradient
    header.Style.Interior.FillPattern = xlsModule.ExcelPatternType.Gradient;

    // Give the two ends of the gradient their colors
    header.Style.Interior.Gradient.ForeColor = xlsModule.Color.FromArgb(255, 255, 255);
    header.Style.Interior.Gradient.BackColor = xlsModule.Color.FromArgb(79, 129, 189);

    // Two-color gradient: the first parameter sets the direction, the second the shading variant
    header.Style.Interior.Gradient.TwoColorGradient(
      xlsModule.GradientStyleType.Horizontal,
      xlsModule.GradientVariantsType.ShadingVariants1,
    );

    // Save the workbook
    const outputFileName = 'GradientFill.xlsx';
    workbook.SaveToFile({ fileName: outputFileName });

    // Dispose of the workbook object to release resources
    workbook.Dispose();

    // Read the result file from the VFS and trigger the download
    const fileArray = window.dotnetRuntime.Module.FS.readFile(outputFileName);
    const blob = new Blob([fileArray], { type: 'application/vnd.openxmlformats-officedocument.spreadsheetml.sheet' });
    const url = URL.createObjectURL(blob);
    const a = document.createElement('a');
    a.href = url;
    a.download = outputFileName;
    a.click();
    URL.revokeObjectURL(url);
  };

  return (
    <div style={{ textAlign: 'center', height: '300px' }}>
      <h1>Apply Gradient Fill</h1>
      <button onClick={applyGradient}>Start</button>
    </div>
  );
}

export default App;
After running, the effect of applying a gradient fill to the header row:
Apply a pattern fill to cells
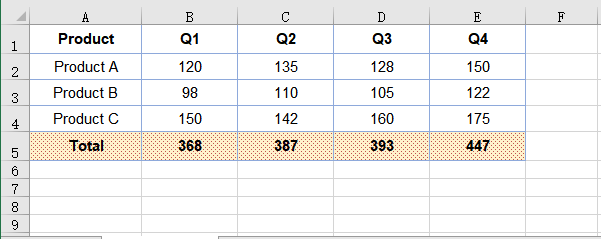
A pattern fill is not one effect but a family of built-in styles: dots, horizontal and vertical stripes, diagonals, chequerboards and more all live under ExcelPatternType, several dozen values in all, with densities running from 5% to 75%. Compared with a gradient, a pattern carries far less visual weight, so it can be laid across a whole row without getting in the way of reading, which makes it a better fit for marking a total row or setting a block of data apart.
Setting one works the same way as a gradient: Interior.FillPattern picks the style, and then two colors are needed. There is one easy trap here -- Interior.Color sets the color of the pattern itself, while Interior.PatternColor sets the backdrop underneath it, so the two property names mean the opposite of what they suggest. Give the dark color to Interior.Color and the light one to Interior.PatternColor, and the dots float on a pale ground. The steps are:
- Load the font and the sample data into the VFS.
- Create a
Workbook, load it withLoadFromFile, then get the first worksheet withWorksheets.get(0). - Take the total row with
Range.getand setStyle.Interior.FillPatternto the wantedExcelPatternTypevalue. - Give the pattern its color with
Interior.Colorand the backdrop its color withInterior.PatternColor. - Save the workbook with
SaveToFile.
The complete code example below shows how to apply a pattern fill to Excel cells in React:
function App() {
  const applyPattern = async () => {
    // Get the Spire.XLS WASM module
    const xlsModule = window.wasmModule?.spirexls;

    // Check if the module is ready
    if (!xlsModule) {
      alert('Spire.Xls is not ready yet');
      return;
    }

    // Load the font and the sample data into the VFS
    await window.spire.FetchFileToVFS('ARIAL.TTF', '/Library/Fonts/', `${process.env.PUBLIC_URL}/font/`);
    const inputFileName = 'FillSample_EN.xlsx';
    await window.spire.FetchFileToVFS(inputFileName, '', `${process.env.PUBLIC_URL}data/`);

    // Load the workbook and get the first worksheet
    const workbook = new xlsModule.Workbook();
    workbook.LoadFromFile({ fileName: inputFileName });
    const sheet = workbook.Worksheets.get(0);

    // Take the total row, A5:E5
    const total = sheet.Range.get('A5:E5');

    // Pick a built-in pattern, here a 12.5% gray dot pattern
    total.Style.Interior.FillPattern = xlsModule.ExcelPatternType.Percent125Gray;

    // Interior.Color sets the pattern itself, Interior.PatternColor the backdrop behind it
    total.Style.Interior.Color = xlsModule.Color.FromArgb(192, 80, 77);
    total.Style.Interior.PatternColor = xlsModule.Color.FromArgb(255, 242, 204);

    // Save the workbook
    const outputFileName = 'PatternFill.xlsx';
    workbook.SaveToFile({ fileName: outputFileName });

    // Dispose of the workbook object to release resources
    workbook.Dispose();

    // Read the result file from the VFS and trigger the download
    const fileArray = window.dotnetRuntime.Module.FS.readFile(outputFileName);
    const blob = new Blob([fileArray], { type: 'application/vnd.openxmlformats-officedocument.spreadsheetml.sheet' });
    const url = URL.createObjectURL(blob);
    const a = document.createElement('a');
    a.href = url;
    a.download = outputFileName;
    a.click();
    URL.revokeObjectURL(url);
  };

  return (
    <div style={{ textAlign: 'center', height: '300px' }}>
      <h1>Apply Pattern Fill</h1>
      <button onClick={applyPattern}>Start</button>
    </div>
  );
}

export default App;
After running, the effect of applying a pattern fill to the total row:
FAQ
The fill is set, so why did the cell's font style stay the same?
Cause: Style.Interior only handles the fill. Fill, font and borders are three independent members of Style, and touching one leaves the other two alone -- darken the background and the text stays the same black, which turns the cell into a smudge; recolor Style.Font and the background does not follow either.
Solution: Set the fill and the font separately, and usually change both together when contrast matters:
// Fill
sheet.Range.get('A1:E1').Style.Interior.Color = xlsModule.Color.FromArgb(79, 129, 189);

// Font
sheet.Range.get('A1:E1').Style.Font.Color = xlsModule.Color.FromArgb(255, 255, 255);
sheet.Range.get('A1:E1').Style.Font.IsBold = true;
Style.Font also carries FontName, Size, IsItalic and Underline, none of which interfere with the fill.
After filling a cell, how do I take the color off again?
Cause: Changing the color only swaps one fill for another; it does not remove the fill. The fill type is still a value other than None, so the pattern or the background color is still written into the cell's style.
Solution: Set the fill type back to ExcelPatternType.None, and the pattern and colors stop applying along with it:
sheet.Range.get('A5:E5').Style.Interior.FillPattern = xlsModule.ExcelPatternType.None;
Get a Free License
Spire.XLS for JavaScript offers a 30-day full-featured free trial license with no functional limitations. Apply here to evaluate before purchasing.
Import Arrays into Excel in React with JavaScript
The most direct way to get data into Excel is to assign one cell at a time, which means ten rows take ten loop iterations. But data usually arrives in JavaScript already in blocks -- a list from an API, a table rendered on the page, a computed result set -- and there is no reason to break an array apart just to feed it back cell by cell. The InsertArray method of Spire.XLS for JavaScript takes a whole array at once; combined with a starting row and column and a write direction, a single call drops an entire column or row of data into the worksheet. Spire.XLS for JavaScript performs these operations directly in the browser through WebAssembly, managing input and output files with a virtual file system (VFS) and requiring no backend service.
This article covers two core feature points:
- Import a one-dimensional array into a worksheet
- Import a two-dimensional data table into a worksheet
For installation and project setup, see Integrating Spire.XLS for JavaScript in a React Project. The examples below assume Spire.XLS is installed and the WebAssembly module has been initialized.
Import a one-dimensional array into a worksheet
InsertArray is split into several overloads by data type: stringArray for text, intArray for integers and doubleArray for decimals. That split is not needless fussiness -- Excel treats cells according to their data type. Numbers sit right-aligned and can take part in sums and charts directly, while a number written as text sits left-aligned and a formula referencing it only yields 0. Scores, amounts and quantities -- anything that will be used in a calculation -- belong in a numeric overload.
The remaining parameters decide where the data lands: firstRow and firstColumn give the starting position, with rows and columns both counted from 1, and isVertical picks the direction the array spreads -- false lays it along a row, true down a column. The same ['Jan', 'Feb', 'Mar'] becomes either a header row spanning A1 to C1 or a column of data running down A1 to A3. The steps are:
- Load the font into the VFS.
- Create a
Workbookand get the first worksheet withWorksheets.get(0). - Write a header row horizontally with the
stringArrayoverload ofInsertArray. - Write the name column vertically with
stringArrayand the score column withintArray. - Auto-fit the columns with
AllocatedRange.AutoFitColumns, then save the workbook withSaveToFile.
The complete code example below shows how to import a one-dimensional array into a worksheet in React:
function App() {
  const importArray = async () => {
    // Get the Spire.XLS WASM module
    const xlsModule = window.wasmModule?.spirexls;

    // Check if the module is ready
    if (!xlsModule) {
      alert('Spire.Xls is not ready yet');
      return;
    }

    // Load the font into the VFS
    await window.spire.FetchFileToVFS('ARIAL.TTF', '/Library/Fonts/', `${process.env.PUBLIC_URL}/font/`);

    // Create a new workbook and get the first worksheet
    const workbook = new xlsModule.Workbook();
    const sheet = workbook.Worksheets.get(0);

    // Write a header row horizontally: isVertical false spreads the array across A1:B1
    sheet.InsertArray({
      stringArray: ['Name', 'Score'],
      firstRow: 1,
      firstColumn: 1,
      isVertical: false,
    });

    // Write the name column vertically: isVertical true spreads the array down A2:A4
    sheet.InsertArray({
      stringArray: ['Alice', 'Bob', 'Carol'],
      firstRow: 2,
      firstColumn: 1,
      isVertical: true,
    });

    // Write the score column: numbers go through the intArray overload, so the cells hold
    // numbers rather than text
    sheet.InsertArray({
      intArray: [92, 85, 78],
      firstRow: 2,
      firstColumn: 2,
      isVertical: true,
    });

    // Auto-fit the columns to their content
    sheet.AllocatedRange.AutoFitColumns();

    // Save the workbook
    const outputFileName = 'ImportArray.xlsx';
    workbook.SaveToFile({ fileName: outputFileName });

    // Dispose of the workbook object to release resources
    workbook.Dispose();

    // Read the result file from the VFS and trigger the download
    const fileArray = window.dotnetRuntime.Module.FS.readFile(outputFileName);
    const blob = new Blob([fileArray], { type: 'application/vnd.openxmlformats-officedocument.spreadsheetml.sheet' });
    const url = URL.createObjectURL(blob);
    const a = document.createElement('a');
    a.href = url;
    a.download = outputFileName;
    a.click();
    URL.revokeObjectURL(url);
  };

  return (
    <div style={{ textAlign: 'center', height: '300px' }}>
      <h1>Import 1-D Array</h1>
      <button onClick={importArray}>Start</button>
    </div>
  );
}

export default App;
After running, the effect of importing a one-dimensional array into a worksheet:
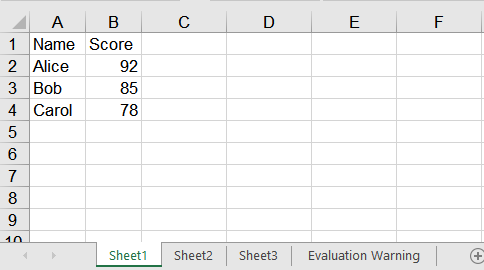
Import a two-dimensional data table into a worksheet
A data table is naturally a two-dimensional array -- a header row first, then one record per row, as in [['Name', 'Subject', 'Score'], ['Alice', 'Math', 92]]. Importing a two-dimensional data table into Excel means splitting it by column and writing each column as a one-dimensional array on its own: write the header across one row, then write the body column by column, text columns with stringArray and numeric ones with intArray. A column holds a single data type throughout, so each call only has to pick one form. When the data arrives in batches, read LastRow to find the last row currently in use and write the next batch from the row after it. The steps are:
- Load the font into the VFS.
- Create a
Workbookand get the first worksheet withWorksheets.get(0). - Write the header across the first row with the
stringArrayoverload ofInsertArray. - Split the body by column and write each one vertically with
stringArrayorintArray. - When a second batch arrives, locate its starting row with
LastRowand write the columns the same way. - Auto-fit the columns with
AllocatedRange.AutoFitColumns, then save the workbook withSaveToFile.
The complete code example below shows how to import a two-dimensional data table into a worksheet in React:
function App() {
  const importDataTable = async () => {
    // Get the Spire.XLS WASM module
    const xlsModule = window.wasmModule?.spirexls;

    // Check if the module is ready
    if (!xlsModule) {
      alert('Spire.Xls is not ready yet');
      return;
    }

    // Load the font into the VFS
    await window.spire.FetchFileToVFS('ARIAL.TTF', '/Library/Fonts/', `${process.env.PUBLIC_URL}/font/`);

    // The two-dimensional data to import, with the header as its first row
    const rows = [
      ['Name', 'Subject', 'Score'],
      ['Alice', 'Math', 92],
      ['Bob', 'Chinese', 85],
    ];

    // Create a new workbook and get the first worksheet
    const workbook = new xlsModule.Workbook();
    const sheet = workbook.Worksheets.get(0);

    // Write one column: text columns go through stringArray, numeric ones through intArray
    const writeColumn = (values, firstRow, firstColumn) => {
      const isNumeric = values.every((value) => typeof value === 'number');
      if (isNumeric) {
        sheet.InsertArray({ intArray: values, firstRow, firstColumn, isVertical: true });
      } else {
        sheet.InsertArray({ stringArray: values, firstRow, firstColumn, isVertical: true });
      }
    };

    // Write the header across the first row
    sheet.InsertArray({
      stringArray: rows[0],
      firstRow: 1,
      firstColumn: 1,
      isVertical: false,
    });

    // Split the body by column and write each one vertically, starting at row 2
    const body = rows.slice(1);
    for (let column = 0; column < rows[0].length; column++) {
      writeColumn(body.map((row) => row[column]), 2, column + 1);
    }

    // A second batch arrives: use LastRow to find where the existing data ends
    const nextBatch = [
      ['Carol', 'English', 78],
      ['Dave', 'Physics', 91],
    ];
    const startRow = sheet.LastRow + 1;
    for (let column = 0; column < rows[0].length; column++) {
      writeColumn(nextBatch.map((row) => row[column]), startRow, column + 1);
    }

    // Auto-fit the columns to their content
    sheet.AllocatedRange.AutoFitColumns();

    // Save the workbook
    const outputFileName = 'ImportDataTable.xlsx';
    workbook.SaveToFile({ fileName: outputFileName });

    // Dispose of the workbook object to release resources
    workbook.Dispose();

    // Read the result file from the VFS and trigger the download
    const fileArray = window.dotnetRuntime.Module.FS.readFile(outputFileName);
    const blob = new Blob([fileArray], { type: 'application/vnd.openxmlformats-officedocument.spreadsheetml.sheet' });
    const url = URL.createObjectURL(blob);
    const a = document.createElement('a');
    a.href = url;
    a.download = outputFileName;
    a.click();
    URL.revokeObjectURL(url);
  };

  return (
    <div style={{ textAlign: 'center', height: '300px' }}>
      <h1>Import 2-D Data Table</h1>
      <button onClick={importDataTable}>Start</button>
    </div>
  );
}

export default App;
After running, the effect of importing a two-dimensional data table into a worksheet:
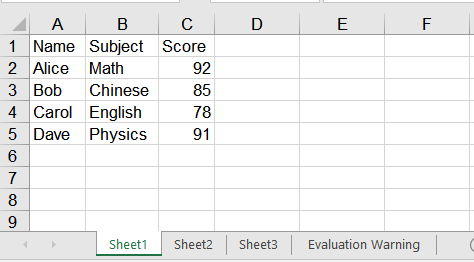
FAQ
How do I put a date into a cell?
Cause: dateTimeArray cannot be used to write a JavaScript Date -- it lands as 0001/1/1. Assigning cell by cell through Range.DateTimeValue does work, but it only accepts a Date object; hand it a string and it reports Value is not a Date.
Solution: For a whole column, the least fuss is to write the date as a yyyy-mm-dd string and pass it to stringArray. The saved cell holds a real date value -- reading NumberValue back gives the date serial number, such as 46037 -- and no number format has to be set:
sheet.InsertArray({
  stringArray: ['2026-01-15', '2026-02-20'],
  firstRow: 1,
  firstColumn: 1,
  isVertical: true,
});
When only one cell needs setting, assign it directly instead, taking care to pass a Date object rather than a string:
sheet.Range.get('A1').DateTimeValue = new Date(Date.UTC(2026, 0, 15));
Do empty values in the array break the write?
Cause: No. null, undefined and the empty string all write an empty cell. InsertArray places each value by its index, so what the value happens to be makes no difference: later elements do not shift, and nothing throws.
Solution: Nothing extra is needed; pass the array as it is. The line below fills A1:D1, with D still landing in the fourth column:
sheet.InsertArray({
  stringArray: ['A', null, '', 'D'],
  firstRow: 1,
  firstColumn: 1,
  isVertical: false,
});
Get a Free License
Spire.XLS for JavaScript offers a 30-day full-featured free trial license with no functional limitations. Apply here to evaluate before purchasing.
Batch Payslip Splitting and PDF Distribution with Spire.Agent.Office
In HR and finance departments, distributing payslips is a monthly task that is small in substance yet remarkably tedious. A payroll sheet is usually an Excel table arranged by rows — each row is one employee, while the columns hold base salary, performance bonus, overtime pay, social insurance deduction, housing fund, individual income tax and net pay. But when the sheet reaches employees, each person should only see their own row. So "one sheet" must first be "split into N copies", and then each copy sent out one by one.
The traditional approach is copy-and-paste row by row inside the spreadsheet: create a new file, paste the header once, paste one employee's row into it, save as PDF, rename it, then loop to the next person. A team of a few dozen people means a few dozen repetitions; at a hundred people it is not only slow but highly prone to missed sends, wrong sends, or sending one person's salary to someone else — and payroll is exactly the information that must never be wrong.
The Excel AI capability of Spire.Agent.Office lets you describe the splitting rules in natural language. The AI agent understands the request and completes two kinds of work automatically: splitting one payroll sheet into individual payslip PDFs, one per employee, and applying a unified layout template to each payslip and encrypting it per person, producing files that are ready to distribute — along with a distribution ledger you can consult at any time.
Comparison with Traditional SDK API
| Traditional Spire.Office for .NET API | Spire.Agent.Office | |
|---|---|---|
| Driving style | Write complete code that loops over data rows, creates workbooks, copies headers and data and exports PDFs, controlling every step | Describe the splitting and distribution requirements in natural language; the AI understands them and orchestrates the execution path |
| Code size | Batch splitting and export usually needs 200-400 lines of C# (data reading, row loops, worksheet creation, style copying, page setup, PDF export, file naming, encryption parameters, etc.) | About 10 lines of calling code + 1 natural-language instruction |
| Layout handling | Copy header styles and set column widths and print areas by hand, or every payslip comes out misformatted | The AI recognizes and reuses the borders, alignment and column widths of the original header |
| Passwords and ledger | Generate each file's password yourself and register it separately; producing a ledger needs extra export logic | State the password rule in one sentence; the AI applies it and also outputs an Excel distribution ledger |
| Requirement change | Change a splitting rule / naming / encryption rule → change code → compile → redeploy | Modify the instruction and it takes effect immediately |
This article shows how to use Spire.Agent.Office to split an Excel payroll sheet into individual payslip PDFs. Two cases demonstrate the two typical uses — "splitting the payroll sheet directly" and "applying a template, encrypting and distributing":
- Case 1: Batch-split a payroll sheet into per-employee payslip PDFs
- Case 2: Apply a payslip template and encrypt to produce distributable files
For product installation and SpireToken configuration, please refer to Integrating Spire.Agent.Office in a .NET Project. The examples below assume that Spire.Agent.Office has been installed and SpireToken has been configured.
Case 1: Batch-split a payroll sheet into per-employee payslip PDFs
This is the most direct scenario: all you have is a raw payroll sheet, with no extra template file. The first row is the header and each following row holds one employee's pay data for the month. The task is to split the sheet by row, generate a payslip for each employee that contains only their own information, and save it named "employeeID_name" for later distribution or archiving.
The pain of doing this by hand is the repetition: the more employees there are, the more copy-and-paste cycles are needed, and the further you get the easier it is for rows to slip — leaving the previous person's net pay in the next person's file. That is a class of error that is hard to notice and serious in its consequences.
The example below uses the Spire.Agent.Office agent to read every employee record in the payroll sheet through a natural-language instruction, split it row by row into individual payslips and export them as PDFs:
using Spire.Agent.Office.AI;
using Spire.Agent.Office.Extensions;
using Spire.Xls;

// Excel-related configuration
string inputPath = @"E:\payroll.xlsx";  // path to the payroll sheet to split
string savePath = null;  // result path (null here: the output folder below will be used)
string OutDir = @"E:\output";  // output directory (the split payslip PDFs are saved here)
string key = "**************************";  // SpireToken key
string instruction =
"Read the employee payroll data in the payroll sheet and generate an individual payslip for each employee:" +
  "1. The first row is the header and each following row is one employee; extract the employee ID, name, department and each pay item row by row;" +
  "2. At the top of each payslip show the title 'Payslip' and the pay month, and list that employee's ID, name and department, then list each pay item in the source column order: base salary, performance bonus, overtime pay, social insurance deduction, housing fund, individual income tax and net pay;" +
  "3. Generate a separate PDF file for each employee, named 'employeeID_name' and saved to the output directory;" +
  "4. Keep the borders and column widths of the original header, right-align the amount columns and keep two decimal places;" +
  "5. Make the page size fit the payslip content, with tight margins and a height that adapts to the content, leaving no large blank areas;" +
  "Save the final result as a PDF file";

// Call the Excel document processing function
AIResult result = ExecuteDemoExcel(instruction, inputPath, savePath, key, OutDir);


// Execute Excel AI processing
static AIResult ExecuteDemoExcel(string instruction, string inputPath, string savePath, string key, string output)
{
    // Create the AIOptions configuration object
    AIOptions options = new AIOptions();
    options.WorkDir = output;  // set the working directory to the output directory
    options.SpireToken = key;  // set the SpireToken key

    // Process the Excel document using a Workbook object
    using (Workbook workbook = new Workbook())
    {
        // Load the Excel payroll sheet from file
        if (!string.IsNullOrEmpty(inputPath) && File.Exists(inputPath))
        {
            workbook.LoadFromFile(inputPath);
        }
        // Create the AI document processor
        AIDocumentProcessor processor = workbook.AI(options);

        // Execute the AI instruction
        return processor.ExecuteInstruction(workbook, instruction, savePath);
    }
}
The Excel payroll sheet to be split
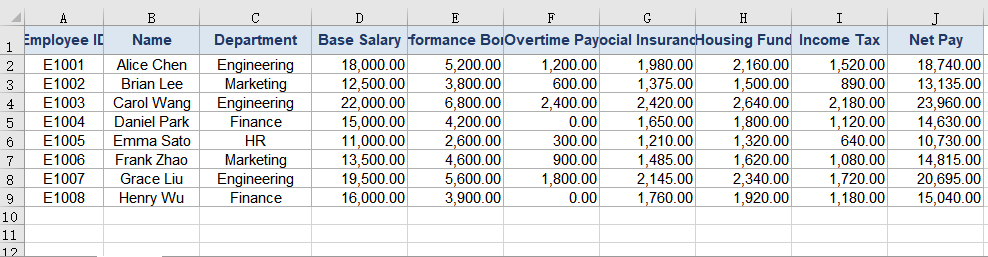 The individual payslip PDFs produced by the split
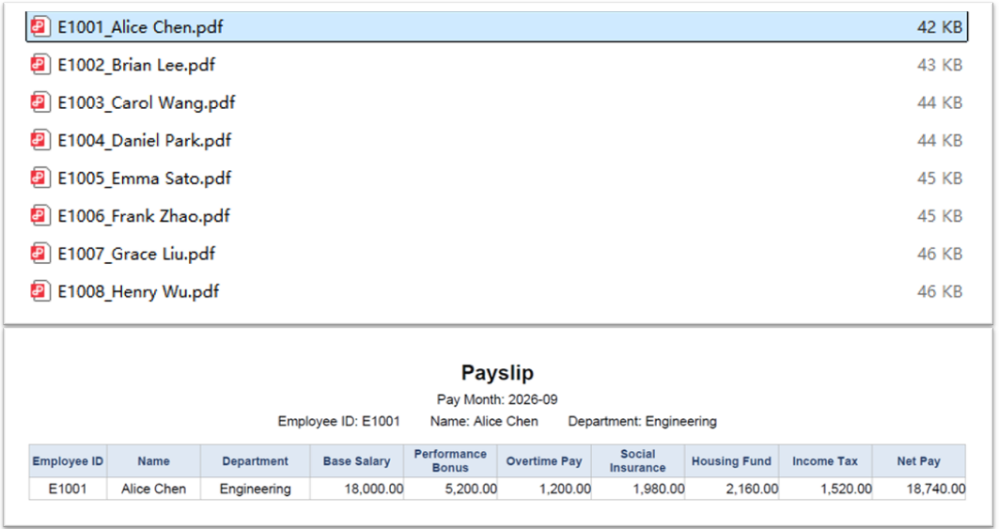
Case 2: Apply a payslip template and encrypt to produce distributable files
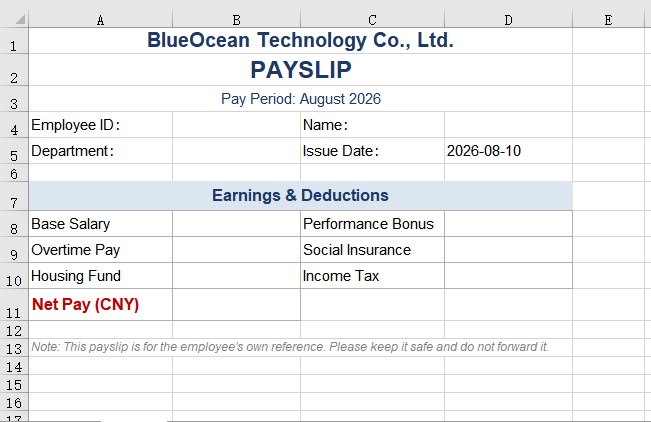
When a company distributes payslips, two more requirements usually come up: a unified layout and confidentiality. Companies normally have a fixed payslip template — with a company letterhead, the pay month, the order of pay items and explanatory text at the bottom. At the same time, salary is sensitive information: sending a plain-text PDF directly means that once it is forwarded or misdelivered, the employee's pay is exposed.
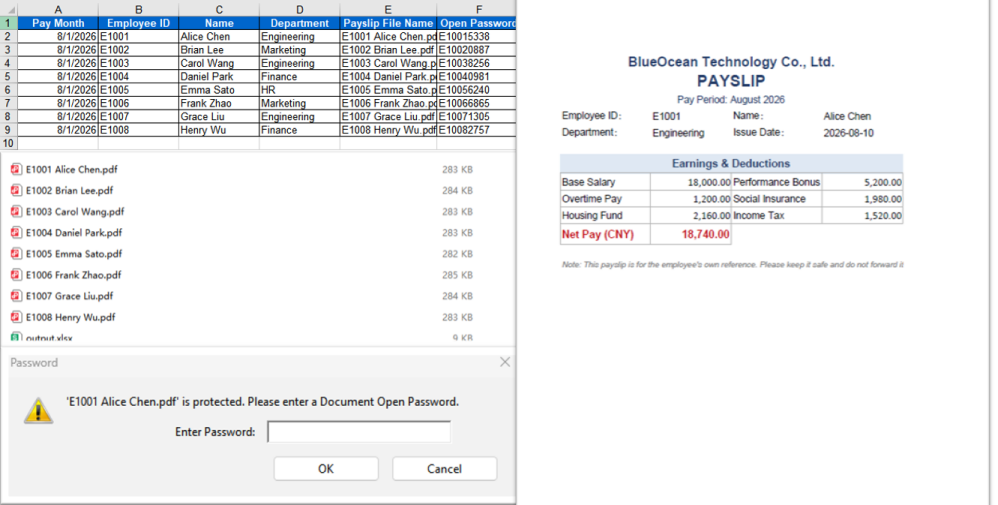
The safer approach is to apply the same template to every payslip and then set an individual open password on each employee's PDF (for example, generated from their own employee ID), so that only that person can open and view their payslip.
But once the passwords "all differ", a new management problem appears: who records them, and where do you look them up afterwards. Each password is built from "employee ID + 4 random digits", and those random digits cannot be reconstructed from the file name or any other information. After dozens or hundreds of files have gone out, if an employee reports that a file will not open, the only fallback is to dig out the original payroll sheet and try one by one. So the complete loop of encrypted distribution should also produce a distribution ledger — recording file names, employee details and open passwords in one-to-one correspondence, for later distribution, reconciliation and archive lookups.
This case takes the payslip template as the input document, while the employee payroll data is passed in as an attachment. The AI needs to fill the attachment data into the corresponding positions of the template and output that ledger alongside the encrypted PDFs.
The example below uses the Spire.Agent.Office agent to read the employee data in the attached payroll sheet through a natural-language instruction, fill it into the payslip template row by row, generate a separate PDF for each employee, encrypt it with "employee ID + 4 random digits", and additionally produce an Excel-format "Payslip Distribution Ledger":
using Spire.Agent.Office.AI;
using Spire.Agent.Office.Extensions;
using Spire.Xls;

// Path to the employee payroll data file (passed in as an attachment)
string[] attachmentPaths = new string[]
{
    @"E:\payroll.xlsx"
};

// Excel-related configuration
string inputPath = @"E:\template-payslip.xlsx";  // path to the payslip template file
string savePath = null;  // result path (null here: the output folder below will be used)
string OutDir = @"E:\output-encrypted";  // output directory (encrypted payslip PDFs and the distribution ledger are saved here)
string key = "**************************";  // SpireToken key
string instruction =
    "Read the employee payroll data from the attached 'payroll.xlsx' and process it as follows:" +
    "1. The first row is the header and each following row is one employee; read the employee ID, name, department and each pay item row by row;" +
    "2. Fill each row of data into the corresponding positions of the payslip template, keeping the template's company letterhead, notes and item order unchanged;" +
    "3. Generate a separate PDF file for each employee, named 'employee ID + employee name' and saved to the output directory;" +
    "4. Set an open password on each PDF as 'employee ID + 4 random digits'; it only restricts opening the document and does not affect printing or copying;" +
    "5. Also generate an Excel-format 'Payslip Distribution Ledger' in the output directory, listing the pay month, employee ID, name, department, payslip file name and the corresponding open password in each row, for later distribution and archive lookups;" +
    "6. Keep the layout, fonts and column widths of the template;" +
    "Save the final result as a PDF file";

// Call the Excel document processing function
AIResult result = ExecuteDemoExcel(instruction, inputPath, savePath, key, OutDir, attachmentPaths);


// Execute Excel AI processing
static AIResult ExecuteDemoExcel(string instruction, string inputPath, string savePath, string key, string output, string[] attachmentPaths)
{
    // Create the AIOptions configuration object
    AIOptions options = new AIOptions();
    options.WorkDir = output;  // set the working directory to the output directory
    options.SpireToken = key;  // set the SpireToken key

    // Process the Excel document using a Workbook object
    using (Workbook workbook = new Workbook())
    {
        // Load the payslip template from file
        if (!string.IsNullOrEmpty(inputPath) && File.Exists(inputPath))
        {
            workbook.LoadFromFile(inputPath);
        }
        // Create the AI document processor
        AIDocumentProcessor processor = workbook.AI(options);

        // Execute the AI instruction
        return processor.ExecuteInstruction(workbook, instruction, savePath, attachmentPaths);
    }
}
The payslip template file
 Template-applied, encrypted payslip PDFs and the payslip distribution ledger
FAQ
The split payslips have slipped rows or misaligned data
Cause: The payroll sheet contains blank rows, merged cells or subtotal rows, so when the AI reads by row it counts non-employee rows as records and everything after them shifts.
Solution: Make sure the first row of the payroll sheet is the header and every row after it corresponds to exactly one employee, with no blank or subtotal rows in between. If the table structure is complex, state the rule in the instruction, for example "treat a row as an employee record only when the 'Employee ID' column is not empty".
An encrypted payslip will not open even for me
Cause: Each payslip's password is generated as "employee ID + 4 random digits", so it differs per person, and the random digits cannot be worked out on your own.
Solution: State the password rule explicitly in the instruction (for example, "the password is the employee ID plus 4 random digits") and make sure the generated passwords are recorded in the distribution ledger — once a random number is lost, the file can no longer be opened. Before distributing, try opening one payslip using a record from the ledger to verify.
Getting a SpireToken Key
- Contact sales@e-iceblue.com or visit https://www.e-iceblue.com/TemLicense.html to obtain a trial/commercial API key
Configure it in your code:
AIOptions options = new AIOptions();
options.SpireToken = key;
Add Error Bars to Excel Charts in React with JavaScript
A chart plots averages, and an average says nothing about how steady the underlying readings were. The same rising line can sit on top of six near-identical measurements or six wildly scattered ones -- the curve alone will not tell you which. Error bars supply that missing layer: a short segment drawn at each data point marks the spread or uncertainty around it, so the reader can see how much confidence each turn of the line deserves. Percentage error bars derive their range from a fixed proportion of the value, while standard error bars derive theirs from the data itself, and the two suit different situations. Spire.XLS for JavaScript performs both directly in the browser through WebAssembly, managing input and output files with a virtual file system (VFS) and requiring no backend service.
This article covers two key features:
For installation and project setup, see Integrating Spire.XLS for JavaScript in a React Project. The examples below assume Spire.XLS is installed and the WebAssembly module has been initialised.
Add percentage error bars to a line chart
A percentage error bar takes the value of each data point as its base and works out the range from the given percentage. Set it to 10, and a point valued at 4.0 gets an error amount of 0.4; which side of the data point that length is drawn on is decided by a separate parameter. This kind of error bar expresses a tolerance -- a production target allowed to drift by a tenth, or an instrument reading with a fixed relative precision. Error bars belong to a series, so the series object has to be fetched first and its ErrorBar method called on it. The steps are:
- Load the font and the test data file into the VFS.
- Load the workbook and get the first worksheet.
- Add a line chart whose data range is the planned output column.
- Use the month column as the category labels.
- Add a percentage error bar to the series, setting its direction and amount, then save the workbook.
The complete code example below shows how to add percentage error bars to a line chart in React:
function App() {
  const addPercentageErrorBar = async () => {
    // Get the Spire.XLS WASM module
    const xlsModule = window.wasmModule?.spirexls;

    // Check if the module is ready
    if (!xlsModule) {
      alert('Spire.Xls is not ready yet');
      return;
    }

    // Load the font and the test data file into the VFS
    await window.spire.FetchFileToVFS('ARIAL.TTF', '/Library/Fonts/', `${process.env.PUBLIC_URL}/font/`);
    const inputFileName = 'ErrorBarChartData.xlsx';
    await window.spire.FetchFileToVFS(inputFileName, '', `${process.env.PUBLIC_URL}data/`);

    // Load the workbook and get the first worksheet
    const workbook = new xlsModule.Workbook();
    workbook.LoadFromFile({ fileName: inputFileName });
    const sheet = workbook.Worksheets.get(0);

    // Add a line chart whose data range is the planned output column
    const chart = sheet.Charts.Add({ chartType: xlsModule.ExcelChartType.Line });
    chart.ChartTitle = "Planned Output";
    chart.ChartTitleArea.IsBold = true;
    chart.ChartTitleArea.Size = 12;
    chart.DataRange = sheet.Range.get("B1:B7");
    chart.SeriesDataFromRange = false;

    // Set the chart position on the worksheet
    chart.TopRow = 9;
    chart.BottomRow = 26;
    chart.LeftColumn = 1;
    chart.RightColumn = 9;

    // Get the series and use the month column as its category labels
    const serie = chart.Series.get(0);
    serie.CategoryLabels = sheet.Range.get("A2:A7");

    // Add a percentage error bar to the series: plus direction, 10% of the value
    serie.ErrorBar({
      bIsY: true,
      include: xlsModule.ErrorBarIncludeType.Plus,
      type: xlsModule.ErrorBarType.Percentage,
      numberValue: 10.0,
    });

    // Save the workbook
    const outputFileName = "PercentageErrorBar.xlsx";
    workbook.SaveToFile({ fileName: outputFileName });

    // Dispose of the workbook object to free resources
    workbook.Dispose();

    // Read the result file from the VFS and trigger the download
    const fileArray = window.dotnetRuntime.Module.FS.readFile(outputFileName);
    const blob = new Blob([fileArray], { type: 'application/vnd.openxmlformats-officedocument.spreadsheetml.sheet' });
    const url = URL.createObjectURL(blob);
    const a = document.createElement('a');
    a.href = url;
    a.download = outputFileName;
    a.click();
    URL.revokeObjectURL(url);
  };

  return (
    <div style={{ textAlign: 'center', height: '300px' }}>
      <h1>Percentage Error Bars</h1>
      <button onClick={addPercentageErrorBar}>Start</button>
    </div>
  );
}

export default App;
After running, the effect of adding percentage error bars to a line chart:
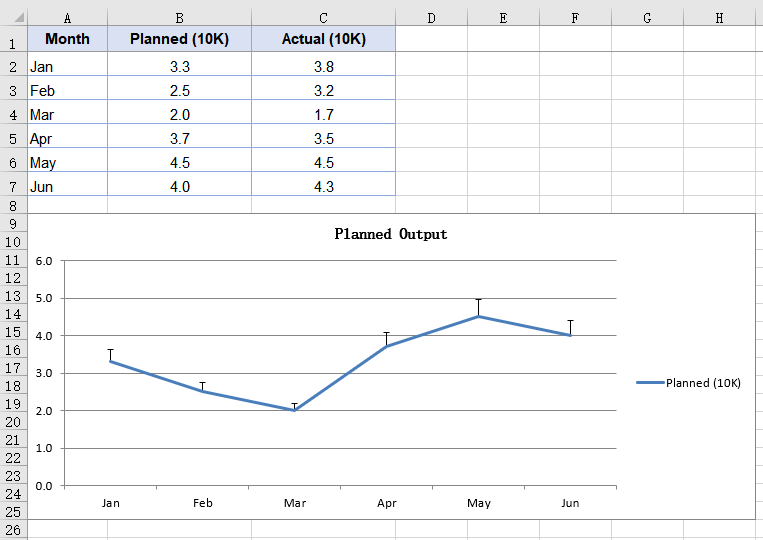
Add standard error bars to a column chart
A standard error bar takes no percentage from you; it computes the standard error of the series itself, so a series with scattered values automatically gets longer error bars. That is the division of labour between the two kinds: the standard error bar describes how steady the data is, the percentage one describes how far you are willing to let it drift. Column charts are usually there to compare several groups side by side, and hanging a standard error bar on each group shows at a glance which one's readings cluster more tightly. The steps are:
- Load the font and the test data file into the VFS.
- Load the workbook and get the first worksheet.
- Add a column chart covering both the planned and the actual output columns.
- Add a standard error bar to each of the two series.
- Save the workbook.
The complete code example below shows how to add standard error bars to a column chart in React:
function App() {
  const addStandardErrorBar = async () => {
    // Get the Spire.XLS WASM module
    const xlsModule = window.wasmModule?.spirexls;

    // Check if the module is ready
    if (!xlsModule) {
      alert('Spire.Xls is not ready yet');
      return;
    }

    // Load the font and the test data file into the VFS
    await window.spire.FetchFileToVFS('ARIAL.TTF', '/Library/Fonts/', `${process.env.PUBLIC_URL}/font/`);
    const inputFileName = 'ErrorBarChartData.xlsx';
    await window.spire.FetchFileToVFS(inputFileName, '', `${process.env.PUBLIC_URL}data/`);

    // Load the workbook and get the first worksheet
    const workbook = new xlsModule.Workbook();
    workbook.LoadFromFile({ fileName: inputFileName });
    const sheet = workbook.Worksheets.get(0);

    // Add a column chart covering both the planned and the actual output columns
    const chart = sheet.Charts.Add({ chartType: xlsModule.ExcelChartType.ColumnClustered });
    chart.ChartTitle = "Planned vs. Actual Output";
    chart.ChartTitleArea.IsBold = true;
    chart.ChartTitleArea.Size = 12;
    chart.DataRange = sheet.Range.get("B1:C7");
    chart.SeriesDataFromRange = false;

    // Set the chart position on the worksheet
    chart.TopRow = 9;
    chart.BottomRow = 26;
    chart.LeftColumn = 1;
    chart.RightColumn = 9;

    // Get the first series and use the month column as its category labels
    const serie = chart.Series.get(0);
    serie.CategoryLabels = sheet.Range.get("A2:A7");

    // Draw a standard error bar on the first series, minus direction
    serie.ErrorBar({
      bIsY: true,
      include: xlsModule.ErrorBarIncludeType.Minus,
      type: xlsModule.ErrorBarType.StandardError,
      numberValue: 0.3,
    });

    // Draw a standard error bar on the second series as well, both directions
    const serie2 = chart.Series.get(1);
    serie2.ErrorBar({
      bIsY: true,
      include: xlsModule.ErrorBarIncludeType.Both,
      type: xlsModule.ErrorBarType.StandardError,
      numberValue: 0.5,
    });

    // Save the workbook
    const outputFileName = "StandardErrorBar.xlsx";
    workbook.SaveToFile({ fileName: outputFileName });

    // Dispose of the workbook object to free resources
    workbook.Dispose();

    // Read the result file from the VFS and trigger the download
    const fileArray = window.dotnetRuntime.Module.FS.readFile(outputFileName);
    const blob = new Blob([fileArray], { type: 'application/vnd.openxmlformats-officedocument.spreadsheetml.sheet' });
    const url = URL.createObjectURL(blob);
    const a = document.createElement('a');
    a.href = url;
    a.download = outputFileName;
    a.click();
    URL.revokeObjectURL(url);
  };

  return (
    <div style={{ textAlign: 'center', height: '300px' }}>
      <h1>Standard Error Bars</h1>
      <button onClick={addStandardErrorBar}>Start</button>
    </div>
  );
}

export default App;
After running, the effect of adding standard error bars to a column chart:
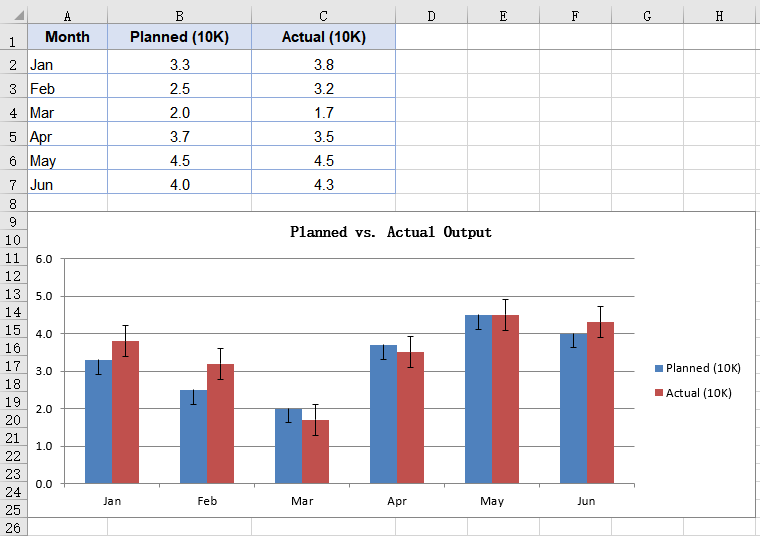
FAQ
Which directions do error bars support?
The direction comes from the include parameter of ErrorBar, which takes three values from ErrorBarIncludeType:
| Value | Effect |
|---|---|
Both |
Both directions, a segment drawn above and below the data point |
Minus |
Negative only, drawn below the data point |
Plus |
Positive only, drawn above the data point |
// Draw it in both directions
serie.ErrorBar({
  bIsY: true,
  include: xlsModule.ErrorBarIncludeType.Both,
  type: xlsModule.ErrorBarType.Percentage,
  numberValue: 10.0,
});
Direction only decides which side of the data point the error bar is drawn on, and does not change its length. The same parameters give the same error amount in all three directions.
Which error amount types are supported?
The error amount type comes from the type parameter of ErrorBar, which takes five values from ErrorBarType:
| Type | Description |
|---|---|
Fixed |
A fixed value, given by numberValue |
Percentage |
A percentage of each data point's value |
StandardDeviation |
A standard deviation, given by numberValue |
StandardError |
A standard error, computed from the series data; numberValue plays no part |
Custom |
Custom ranges,needs a different overload |
The first four take their amount in numberValue:
serie.ErrorBar({
  bIsY: true,
  include: xlsModule.ErrorBarIncludeType.Both,
  type: xlsModule.ErrorBarType.StandardDeviation,
  numberValue: 2,
});
Get a Free License
Spire.XLS for JavaScript offers a 30-day full-featured free trial license with no functional limitations. Apply here to evaluate before purchasing.
Multi-Level Labels with a Secondary Axis in React with JavaScript
When the categories in a chart are themselves layered -- a region that contains months, or a year that contains quarters -- squeezing both columns into a single row of labels leaves the reader guessing which region or which month a data point belongs to. Layered data brings a second problem with it: sales run into the millions while a growth rate sits in the low teens, and on one shared value axis the growth rate flattens into a line pinned to the baseline. Multi-level category labels and the secondary axis solve these two problems respectively. Spire.XLS for JavaScript performs both directly in the browser through WebAssembly, managing input and output files with a virtual file system (VFS) and requiring no backend service.
This article covers two key features:
For installation and project setup, see Integrating Spire.XLS for JavaScript in a React Project. The examples below assume Spire.XLS is installed and the WebAssembly module has been initialised.
Create a Chart with Multi-Level Category Labels
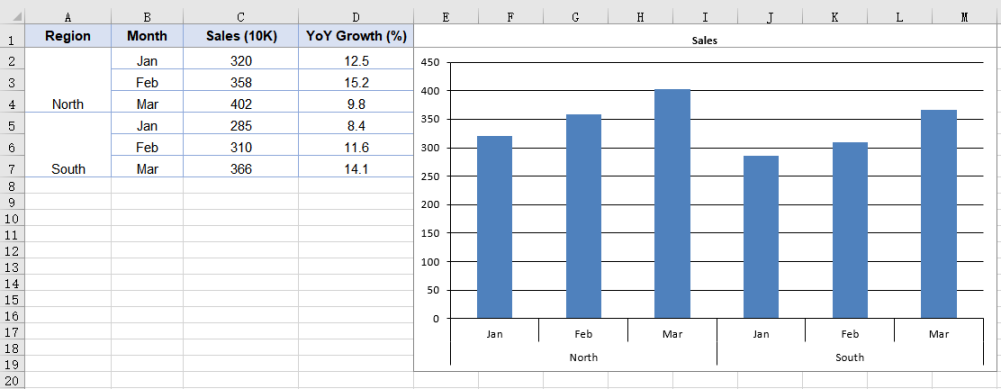
Multi-level category labels are drawn by the category axis, and how many levels that axis has depends on how many columns the series' category labels point at. In the test data the outer labels are already merged by region, so the code only has to make the category labels span both the outer and the inner column. The steps are:
- Load the font and the test data file into the VFS.
- Load the workbook and get the worksheet.
- Add a column chart and add a named sales series.
- Point the category labels at both the region and the month column.
- Turn on multi-level labels for the category axis and save the workbook.
The complete code example below creates a chart with multi-level category labels in React:
function App() {
  const createMultiLevelChart = async () => {
    // Get the Spire.XLS WASM module
    const xlsModule = window.wasmModule?.spirexls;

    // Check if the module is ready
    if (!xlsModule) {
      alert('Spire.Xls is not ready yet');
      return;
    }

    // Load the font and the test data file into the VFS
    await window.spire.FetchFileToVFS('ARIAL.TTF', '/Library/Fonts/', `${process.env.PUBLIC_URL}/font/`);
    const inputFileName = 'MultiLevelChartData.xlsx';
    await window.spire.FetchFileToVFS(inputFileName, '', `${process.env.PUBLIC_URL}data/`);

    // Load the workbook and get the first worksheet
    const workbook = new xlsModule.Workbook();
    workbook.LoadFromFile({ fileName: inputFileName });
    const sheet = workbook.Worksheets.get(0);

    // Add a column chart
    const chart = sheet.Charts.Add({ chartType: xlsModule.ExcelChartType.ColumnClustered });
    chart.ChartTitle = "Sales";
    chart.Legend.Delete();

    // Add the sales series and give it a name
    const serie = chart.Series.Add({ name: "Sales", serieType: xlsModule.ExcelChartType.ColumnClustered });
    serie.Values = sheet.Range.get("C2:C7");

    // Point the category labels at both the region and the month column
    serie.CategoryLabels = sheet.Range.get("A2:B7");

    // Turn on multi-level category labels so each level gets its own row
    chart.PrimaryCategoryAxis.MultiLevelLable = true;

    // Place the chart on the worksheet
    chart.LeftColumn = 5;
    chart.TopRow = 1;
    chart.RightColumn = 14;

    // Save the workbook
    const outputFileName = "MultiLevelLabels.xlsx";
    workbook.SaveToFile({ fileName: outputFileName });

    // Dispose of the workbook object to free resources
    workbook.Dispose();

    // Read the result file from the VFS and trigger the download
    const fileArray = window.dotnetRuntime.Module.FS.readFile(outputFileName);
    const blob = new Blob([fileArray], { type: 'application/vnd.openxmlformats-officedocument.spreadsheetml.sheet' });
    const url = URL.createObjectURL(blob);
    const a = document.createElement('a');
    a.href = url;
    a.download = outputFileName;
    a.click();
    URL.revokeObjectURL(url);
  };

  return (
    <div style={{ textAlign: 'center', height: '300px' }}>
      <h1>Multi-Level Labels</h1>
      <button onClick={createMultiLevelChart}>Start</button>
    </div>
  );
}

export default App;
How many levels the category axis has is decided by how many columns CategoryLabels points at, so binding a single-column range still yields a single level of labels; MultiLevelLable controls whether those levels are laid out as multiple rows.
After running, the effect of creating a chart with multi-level category labels:
Add a Secondary Axis to the Chart
When two series in the same chart differ sharply in magnitude, sharing one value axis squashes the smaller of the two into a line pinned to the baseline, and its movement can no longer be read. A secondary axis is meant for exactly that case: it gives the series a value axis of its own, so each scale spreads across its own range without interfering with the other. The way to do it is to move the series off the primary axis and draw it as a line -- a line takes up no bar width, so it reads clearly against the column series sharing the same categories. The steps are:
- Load the font and the test data file into the VFS.
- Load the workbook and get the worksheet.
- Add a column chart and add a named sales series.
- Add the growth series as a line.
- Move the growth series to the secondary axis and save the workbook.
The complete code example below adds a secondary axis to the chart in React:
function App() {
  const addSecondaryAxis = async () => {
    // Get the Spire.XLS WASM module
    const xlsModule = window.wasmModule?.spirexls;

    // Check if the module is ready
    if (!xlsModule) {
      alert('Spire.Xls is not ready yet');
      return;
    }

    // Load the font and the test data file into the VFS
    await window.spire.FetchFileToVFS('ARIAL.TTF', '/Library/Fonts/', `${process.env.PUBLIC_URL}/font/`);
    const inputFileName = 'MultiLevelChartData.xlsx';
    await window.spire.FetchFileToVFS(inputFileName, '', `${process.env.PUBLIC_URL}data/`);

    // Load the workbook and get the first worksheet
    const workbook = new xlsModule.Workbook();
    workbook.LoadFromFile({ fileName: inputFileName });
    const sheet = workbook.Worksheets.get(0);

    // Add a column chart
    const chart = sheet.Charts.Add({ chartType: xlsModule.ExcelChartType.ColumnClustered });
    chart.ChartTitle = "Sales and YoY Growth";

    // Add the sales series, which stays on the primary axis
    const salesSerie = chart.Series.Add({ name: "Sales", serieType: xlsModule.ExcelChartType.ColumnClustered });
    salesSerie.Values = sheet.Range.get("C2:C7");

    // Point the category labels at both the region and the month column
    salesSerie.CategoryLabels = sheet.Range.get("A2:B7");

    // Add the growth series as a line
    const growthSerie = chart.Series.Add({ name: "YoY Growth", serieType: xlsModule.ExcelChartType.Line });
    growthSerie.Values = sheet.Range.get("D2:D7");

    // Move the growth series to the secondary axis so it plots on its own percentage scale
    growthSerie.UsePrimaryAxis = false;

    // Turn on multi-level category labels
    chart.PrimaryCategoryAxis.MultiLevelLable = true;

    // Place the chart on the worksheet
    chart.LeftColumn = 5;
    chart.TopRow = 1;
    chart.RightColumn = 14;

    // Save the workbook
    const outputFileName = "SecondaryAxis.xlsx";
    workbook.SaveToFile({ fileName: outputFileName });

    // Dispose of the workbook object to free resources
    workbook.Dispose();

    // Read the result file from the VFS and trigger the download
    const fileArray = window.dotnetRuntime.Module.FS.readFile(outputFileName);
    const blob = new Blob([fileArray], { type: 'application/vnd.openxmlformats-officedocument.spreadsheetml.sheet' });
    const url = URL.createObjectURL(blob);
    const a = document.createElement('a');
    a.href = url;
    a.download = outputFileName;
    a.click();
    URL.revokeObjectURL(url);
  };

  return (
    <div style={{ textAlign: 'center', height: '300px' }}>
      <h1>Secondary Axis</h1>
      <button onClick={addSecondaryAxis}>Start</button>
    </div>
  );
}

export default App;
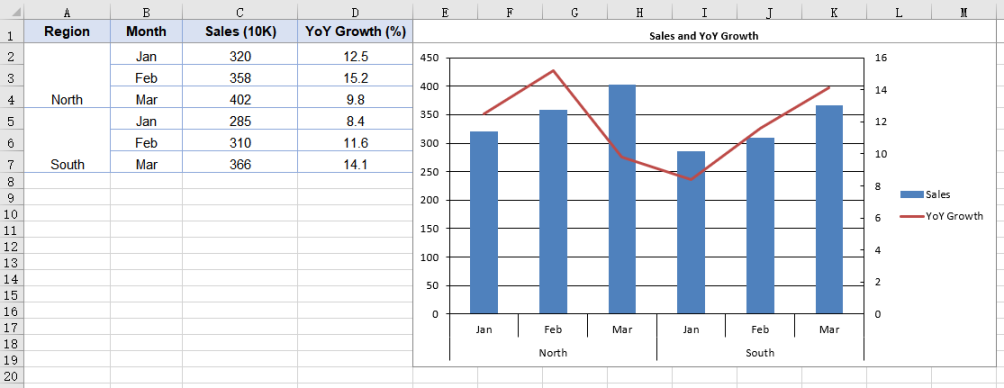
UsePrimaryAxis = false affects only the series it is set on; the other series stay on the primary axis. The chart gains a second pair of value and category axes as a result, giving it two separate scale ranges. Series.Add takes the series name at the same time, so the legend shows the name passed in rather than an auto-generated "Series 1".
After running, the effect of adding a secondary axis to the chart:
Frequently Asked Questions
Why does the category axis show only one level of labels?
Cause: How many levels the category axis has is decided by the range CategoryLabels points at. If that is a single-column range such as B2:B7, the range holds only one level of category information, and setting PrimaryCategoryAxis.MultiLevelLable to true will still give you one level of labels -- the property controls whether multiple levels are expanded, not whether a level of data is created.
Solution: Point CategoryLabels at a multi-column range that includes the outer labels; the cells the outer labels occupy then need to be merged in the data:
// Cover both columns with the category labels; the outer label cells need merging in the data
serie.CategoryLabels = sheet.Range.get("A2:B7");
Why do the two value axes have different scales?
Cause: The primary and secondary value axes work out their scales independently of each other, and MinValue, MaxValue and MajorUnit on PrimaryValueAxis apply to the primary axis only -- changing them leaves the secondary axis untouched. When the two series differ sharply in magnitude, the range the secondary axis picks for itself is often not a good fit.
Solution: Give the secondary axis its own scale through chart.SecondaryValueAxis:
// Give the secondary axis a 0-20 scale with a major unit of 5
chart.SecondaryValueAxis.MinValue = 0;
chart.SecondaryValueAxis.MaxValue = 20;
chart.SecondaryValueAxis.MajorUnit = 5;
Set the scale after the series has been moved to the secondary axis: while no series uses the secondary axis, the assignment is accepted but never written to the file.
Get a Free License
Spire.XLS for JavaScript offers a 30-day full-featured free trial license with no functional limitations. Apply here to evaluate before purchasing.
Apply Color Scales & Icon Sets in Excel in React with JavaScript
In a sales report, a grade sheet, or a metrics dashboard, how values compare matters more than the values themselves. Inserting a chart for every column makes the worksheet crowded, while data bars, color scales, and icon sets show magnitude right inside the cells—through bar length, color intensity, and icon shape—without consuming extra rows or columns. All three belong to Excel conditional formatting, found under Home → Conditional Formatting in the Excel UI.Spire.XLS for JavaScript performs this work directly in the browser through WebAssembly, managing input and output files with a virtual file system (VFS) and requiring no backend service.
This article covers three key features:
For installation and project setup, see Integrating Spire.XLS for JavaScript in a React Project. The examples below assume Spire.XLS is already installed and the WebAssembly module has been initialized.
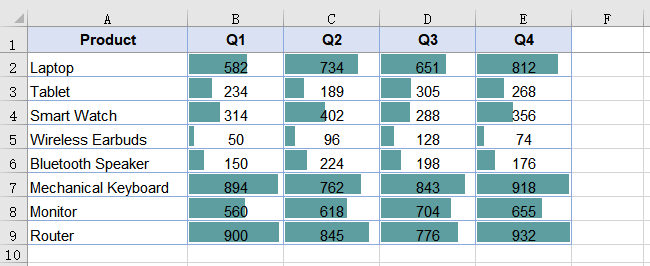
Apply Data Bars to a Cell Range
Data bars draw a horizontal colored band inside each cell, and the length of the band is proportional to how large the value is compared with the rest of the selected range. With Spire.XLS for JavaScript, ConditionalFormats.Add creates a conditional format collection, AddRange binds it to a range, and AddCondition returns the condition object; setting FormatType to ConditionalFormatType.DataBar produces data bars, whose fill color is controlled by DataBar.BarColor. The steps are as follows:
- Load the font and the test data file into the VFS.
- Load the workbook and get the worksheet.
- Call
ConditionalFormats.Addto create a conditional format, and bind the data range withAddRange. - Call
AddConditionto add a condition, setFormatTypetoDataBar, and set the bar color. - Save the workbook.
The complete code example below applies data bars to a sales figures table in React:
function App() {
  const applyDataBars = async () => {
    // Get the Spire.XLS WASM module
    const xlsModule = window.wasmModule?.spirexls;

    // Check whether the module is ready
    if (!xlsModule) {
      alert('Spire.Xls is not ready yet');
      return;
    }

    // Load the font and the test data file into the VFS
    await window.spire.FetchFileToVFS('ARIAL.TTF', '/Library/Fonts/', `${process.env.PUBLIC_URL}/font/`);
    const inputFileName = 'SalesData.xlsx';
    await window.spire.FetchFileToVFS(inputFileName, '', `${process.env.PUBLIC_URL}data/`);

    // Load the workbook and get the first worksheet
    const workbook = new xlsModule.Workbook();
    workbook.LoadFromFile({ fileName: inputFileName });
    const sheet = workbook.Worksheets.get(0);

    // Select the data range that receives the data bars
    const dataRange = sheet.Range.get("B2:E9");

    // Create a conditional format and bind it to that range
    const xcfs = sheet.ConditionalFormats.Add();
    xcfs.AddRange(dataRange);

    // Add a data bar condition and set the bar color
    const format = xcfs.AddCondition();
    format.FormatType = xlsModule.ConditionalFormatType.DataBar;
    format.DataBar.BarColor = xlsModule.Color.get_CadetBlue();

    // Save the workbook
    const outputFileName = "ApplyDataBars.xlsx";
    workbook.SaveToFile({ fileName: outputFileName, version: xlsModule.ExcelVersion.Version2010 });

    // Dispose of the workbook object to free resources
    workbook.Dispose();

    // Read the result file from the VFS and trigger the download
    const fileArray = window.dotnetRuntime.Module.FS.readFile(outputFileName);
    const blob = new Blob([fileArray], { type: 'application/vnd.openxmlformats-officedocument.spreadsheetml.sheet' });
    const url = URL.createObjectURL(blob);
    const a = document.createElement('a');
    a.href = url;
    a.download = outputFileName;
    a.click();
    URL.revokeObjectURL(url);
  };

  return (
    <div style={{ textAlign: 'center', height: '300px' }}>
      <h1>Apply Data Bars</h1>
      <button onClick={applyDataBars}>Start</button>
    </div>
  );
}

export default App;
After running, the effect of applying data bars to a cell range:
Apply Color Scales to a Cell Range
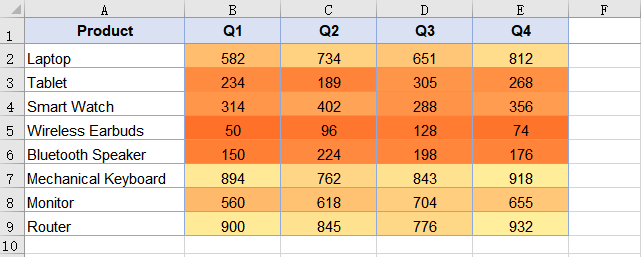
A color scale uses shading to express magnitude: the larger a cell's value is within the range, the closer its color sits to the high end of the scale. Color scales are added through the same ConditionalFormats API as data bars—the only difference is setting FormatType to ConditionalFormatType.ColorScale. No color arguments are required; when none are specified, the result is a two-color scale that takes orange at the range minimum and pale yellow at the maximum, with intermediate values shaded proportionally between the two. The steps are as follows:
- Load the font and the test data file into the VFS.
- Load the workbook and get the worksheet.
- Call
ConditionalFormats.Addto create a conditional format, and bind the data range withAddRange. - Call
AddConditionto add a condition, and setFormatTypetoColorScale. - Save the workbook.
The complete code example below applies color scales to a sales figures table in React:
function App() {
  const applyColorScales = async () => {
    // Get the Spire.XLS WASM module
    const xlsModule = window.wasmModule?.spirexls;

    // Check whether the module is ready
    if (!xlsModule) {
      alert('Spire.Xls is not ready yet');
      return;
    }

    // Load the font and the test data file into the VFS
    await window.spire.FetchFileToVFS('ARIAL.TTF', '/Library/Fonts/', `${process.env.PUBLIC_URL}/font/`);
    const inputFileName = 'SalesData.xlsx';
    await window.spire.FetchFileToVFS(inputFileName, '', `${process.env.PUBLIC_URL}data/`);

    // Load the workbook and get the first worksheet
    const workbook = new xlsModule.Workbook();
    workbook.LoadFromFile({ fileName: inputFileName });
    const sheet = workbook.Worksheets.get(0);

    // Select the data range that receives the color scales
    const dataRange = sheet.Range.get("B2:E9");

    // Create a conditional format and bind it to that range
    const xcfs = sheet.ConditionalFormats.Add();
    xcfs.AddRange(dataRange);

    // Add a color scale condition; colors transition with the values
    const format = xcfs.AddCondition();
    format.FormatType = xlsModule.ConditionalFormatType.ColorScale;

    // Save the workbook
    const outputFileName = "ApplyColorScales.xlsx";
    workbook.SaveToFile({ fileName: outputFileName, version: xlsModule.ExcelVersion.Version2010 });

    // Dispose of the workbook object to free resources
    workbook.Dispose();

    // Read the result file from the VFS and trigger the download
    const fileArray = window.dotnetRuntime.Module.FS.readFile(outputFileName);
    const blob = new Blob([fileArray], { type: 'application/vnd.openxmlformats-officedocument.spreadsheetml.sheet' });
    const url = URL.createObjectURL(blob);
    const a = document.createElement('a');
    a.href = url;
    a.download = outputFileName;
    a.click();
    URL.revokeObjectURL(url);
  };

  return (
    <div style={{ textAlign: 'center', height: '300px' }}>
      <h1>Apply Color Scales</h1>
      <button onClick={applyColorScales}>Start</button>
    </div>
  );
}

export default App;
After running, the effect of applying color scales to a cell range:
Apply Icon Sets to a Cell Range
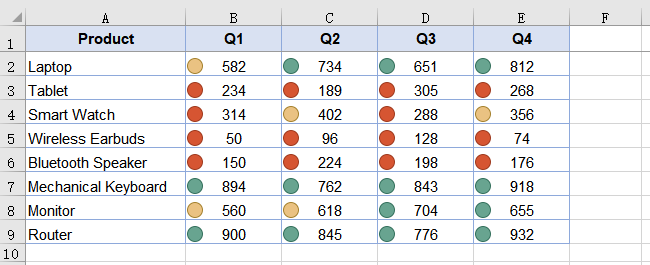
An icon set places a different icon in each cell according to the band its value falls into—for example, red, yellow, and green traffic lights for low, medium, and high. It uses the same API: set FormatType to ConditionalFormatType.IconSet and pick an icon style with IconSet.IconSetType; the example uses IconSetType.ThreeTrafficLights1. The steps are as follows:
- Load the font and the test data file into the VFS.
- Load the workbook and get the worksheet.
- Call
ConditionalFormats.Addto create a conditional format, and bind the data range withAddRange. - Call
AddConditionto add a condition, setFormatTypetoIconSet, and specify the icon set type. - Save the workbook.
The complete code example below applies icon sets to a sales figures table in React:
function App() {
  const applyIconSets = async () => {
    // Get the Spire.XLS WASM module
    const xlsModule = window.wasmModule?.spirexls;

    // Check whether the module is ready
    if (!xlsModule) {
      alert('Spire.Xls is not ready yet');
      return;
    }

    // Load the font and the test data file into the VFS
    await window.spire.FetchFileToVFS('ARIAL.TTF', '/Library/Fonts/', `${process.env.PUBLIC_URL}/font/`);
    const inputFileName = 'SalesData.xlsx';
    await window.spire.FetchFileToVFS(inputFileName, '', `${process.env.PUBLIC_URL}data/`);

    // Load the workbook and get the first worksheet
    const workbook = new xlsModule.Workbook();
    workbook.LoadFromFile({ fileName: inputFileName });
    const sheet = workbook.Worksheets.get(0);

    // Select the data range that receives the icon sets
    const dataRange = sheet.Range.get("B2:E9");

    // Create a conditional format and bind it to that range
    const xcfs = sheet.ConditionalFormats.Add();
    xcfs.AddRange(dataRange);

    // Add an icon set condition and set the icon style to three traffic lights
    const format = xcfs.AddCondition();
    format.FormatType = xlsModule.ConditionalFormatType.IconSet;
    format.IconSet.IconSetType = xlsModule.IconSetType.ThreeTrafficLights1;

    // Save the workbook
    const outputFileName = "ApplyIconSets.xlsx";
    workbook.SaveToFile({ fileName: outputFileName, version: xlsModule.ExcelVersion.Version2010 });

    // Dispose of the workbook object to free resources
    workbook.Dispose();

    // Read the result file from the VFS and trigger the download
    const fileArray = window.dotnetRuntime.Module.FS.readFile(outputFileName);
    const blob = new Blob([fileArray], { type: 'application/vnd.openxmlformats-officedocument.spreadsheetml.sheet' });
    const url = URL.createObjectURL(blob);
    const a = document.createElement('a');
    a.href = url;
    a.download = outputFileName;
    a.click();
    URL.revokeObjectURL(url);
  };

  return (
    <div style={{ textAlign: 'center', height: '300px' }}>
      <h1>Apply Icon Sets</h1>
      <button onClick={applyIconSets}>Start</button>
    </div>
  );
}

export default App;
An icon set divides the range into bands, so the same icon covers a different span of values in different ranges.
After running, the effect of applying icon sets to a cell range:
FAQ
Why do the text cells in the target range get no data bars?
Cause: A data bar expresses how large a value is relative to the rest of the range, so only numeric cells are shaded and text cells inside the range are skipped. Even when the range covers the product-name column or the header row, those cells show no bars—the result still covers the numeric area alone.
Solution: This is the expected behavior and needs no workaround; just keep the range limited to the numeric area. If the numeric area itself shows no bars either, check that the range passed to AddRange matches where the data actually is.
Can the color and border of a data bar be customized?
Cause: A data bar's appearance is controlled by the DataBar property of the condition object. The fill color comes from DataBar.BarColor; setting only FormatType without BarColor yields the default blue bars. Data bars have no border by default, so assigning BarBorder.Color on its own has no effect.
Solution: Set the border type through DataBar.BarBorder.Type first, then set the border color—the two go together:
// Set the border type first so that the border color takes effect
format.DataBar.BarBorder.Type = xlsModule.DataBarBorderType.DataBarBorderSolid;
format.DataBar.BarBorder.Color = xlsModule.Color.get_Red();

// Fill color of the bar
format.DataBar.BarColor = xlsModule.Color.get_GreenYellow();
Get a Free License
Spire.XLS for JavaScript offers a 30-day full-featured free trial license with no functional limitations. Apply here to evaluate before purchasing.
Insert OLE Objects in Excel in React with JavaScript
Besides holding cell data, an Excel workbook is often used as a container for files: a quotation carries a Word version of the contract terms, a product sheet carries a PDF datasheet, and double-clicking the object opens the source file directly. Files embedded into a worksheet like this are OLE objects (Object Linking and Embedding). Inserting one by hand takes two steps in the Excel UI—Insert → Object—but doing it from code in the browser needs a dedicated API.Spire.XLS for JavaScript performs this work directly in the browser through WebAssembly, managing input and output files with a virtual file system (VFS) and requiring no backend service.
This article covers two key features:
For installation and project setup, see Integrating Spire.XLS for JavaScript in a React Project. The examples below assume Spire.XLS is already installed and the WebAssembly module has been initialized.
Insert an OLE Object in Excel
OleObjects.Add inserts an external file into a worksheet. It takes three arguments: the file to embed, the icon the object shows on the sheet, and the link type—OleLinkType.Embed embeds the file into the workbook, OleLinkType.Link inserts it as a link. After the object is in place, Location decides which cell it is anchored to and ObjectType declares what was embedded, which is how Excel knows which program to use when the object is double-clicked. The steps are:
- Create a new workbook and write a caption into a cell.
- Open the workbook to be embedded and render its worksheet to an image, to use as the display icon.
- Embed that Excel file into the worksheet with
OleObjects.Add. - Set
LocationandObjectType. - Save the workbook.
Here is a complete code example that inserts an Excel file into a worksheet as an OLE object in React:
function App() {
  const insertOleObject = async () => {
    // Get the Spire.XLS WASM module
    const xlsModule = window.wasmModule?.spirexls;

    // Check if the module is ready
    if (!xlsModule) {
      alert('Spire.Xls is not ready yet');
      return;
    }

    // Load the font into VFS
    await window.spire.FetchFileToVFS('ARIAL.TTF', '/Library/Fonts/', `${process.env.PUBLIC_URL}/font/`);

    // Load the Excel file to be embedded into VFS
    const embeddedFileName = 'OLEObjects.xlsx';
    await window.spire.FetchFileToVFS(embeddedFileName, '', `${process.env.PUBLIC_URL}/static/data/`);

    // Create a new workbook and write the caption
    const workbook = new xlsModule.Workbook();
    const sheet = workbook.Worksheets.get(0);
    sheet.Range.get("A1").Text = "Here is an OLE object.";

    // Open the embedded workbook and render its worksheet to an image as the display icon
    const embeddedBook = new xlsModule.Workbook();
    embeddedBook.LoadFromFile(embeddedFileName);
    const embeddedSheet = embeddedBook.Worksheets.get(0);
    embeddedSheet.PageSetup.LeftMargin = 0;
    embeddedSheet.PageSetup.RightMargin = 0;
    embeddedSheet.PageSetup.TopMargin = 0;
    embeddedSheet.PageSetup.BottomMargin = 0;
    const image = embeddedSheet.ToImage(1, 1, 19, 5);
    embeddedBook.Dispose();

    // Embed the Excel file into the worksheet; the file data is stored with the workbook
    const oleObject = sheet.OleObjects.Add(
      embeddedFileName,
      image,
      xlsModule.OleLinkType.Embed
    );

    // Anchor the object at cell B4 and declare it as an Excel worksheet
    oleObject.Location = sheet.Range.get("B4");
    oleObject.ObjectType = xlsModule.OleObjectType.ExcelWorksheet;

    // Save the workbook
    const outputFileName = "InsertOLEObject.xlsx";
    workbook.SaveToFile({ fileName: outputFileName, version: xlsModule.ExcelVersion.Version2010 });

    // Release resources
    workbook.Dispose();

    // Read the result file from VFS and trigger the download
    const fileArray = window.dotnetRuntime.Module.FS.readFile(outputFileName);
    const blob = new Blob([fileArray], { type: 'application/vnd.openxmlformats-officedocument.spreadsheetml.sheet' });
    const url = URL.createObjectURL(blob);
    const a = document.createElement('a');
    a.href = url;
    a.download = outputFileName;
    a.click();
    URL.revokeObjectURL(url);
  };

  return (
    <div style={{ textAlign: 'center', height: '300px' }}>
      <h1>Insert an OLE Object</h1>
      <button onClick={insertOleObject}>Start</button>
    </div>
  );
}

export default App;
The icon here is taken directly from the rendered embedded worksheet, so the OLE object shows its own content on the sheet. Switching ObjectType to values such as OleObjectType.WordDocument or OleObjectType.AdobeAcrobatDocument declares other kinds of embedded files.
Running it, the effect of inserting a workbook as an OLE object:
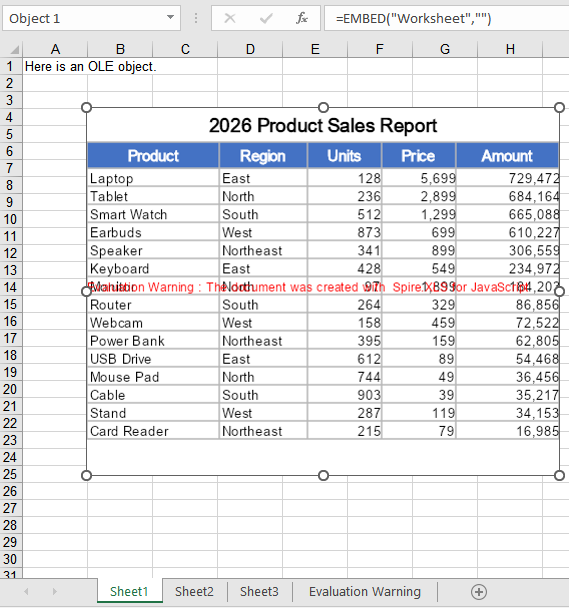
Insert an OLE Object with a Custom Icon
ToImage has to open a workbook and render a row/column range every time, which suits cases where the object should present its own content; when a single icon should be applied to every attachment, reading a ready-made picture is simpler, and the same picture can be reused across attachments. The second argument of OleObjects.Add accepts both kinds of input. The steps are:
- Load the icon image and the attachment file into VFS.
- Create a new workbook and read the icon image into a stream with
new xlsModule.Stream. - Insert the attachment as an embedded object with
OleObjects.Add, passing the icon stream. - Set
LocationandObjectType. - Save the workbook.
Here is a complete code example that inserts a PDF attachment with a custom icon in React:
function App() {
  const insertOleObjectWithIcon = async () => {
    // Get the Spire.XLS WASM module
    const xlsModule = window.wasmModule?.spirexls;

    // Check if the module is ready
    if (!xlsModule) {
      alert('Spire.Xls is not ready yet');
      return;
    }

    // Load the font into VFS
    await window.spire.FetchFileToVFS('ARIAL.TTF', '/Library/Fonts/', `${process.env.PUBLIC_URL}/font/`);

    // Load the icon image and the attachment into VFS
    const iconFileName = 'OLEIcon.png';
    const attachmentFileName = 'Attachment.pdf';
    await window.spire.FetchFileToVFS(iconFileName, '', `${process.env.PUBLIC_URL}/static/data/`);
    await window.spire.FetchFileToVFS(attachmentFileName, '', `${process.env.PUBLIC_URL}/static/data/`);

    // Create a new workbook
    const workbook = new xlsModule.Workbook();
    const sheet = workbook.Worksheets.get(0);

    // Read the icon image as a stream to use as the display icon of the OLE object
    const iconStream = new xlsModule.Stream(iconFileName);

    // Embed the PDF attachment into the worksheet
    const oleObject = sheet.OleObjects.Add(
      attachmentFileName,
      iconStream,
      xlsModule.OleLinkType.Embed
    );

    // Anchor the object at cell B4 and declare it as a PDF document
    oleObject.Location = sheet.Range.get("B4");
    oleObject.ObjectType = xlsModule.OleObjectType.AdobeAcrobatDocument;

    // Save the workbook
    const outputFileName = "InsertOLEObjectWithIcon.xlsx";
    workbook.SaveToFile({ fileName: outputFileName, version: xlsModule.ExcelVersion.Version2010 });

    // Release resources
    workbook.Dispose();

    // Read the result file from VFS and trigger the download
    const fileArray = window.dotnetRuntime.Module.FS.readFile(outputFileName);
    const blob = new Blob([fileArray], { type: 'application/vnd.openxmlformats-officedocument.spreadsheetml.sheet' });
    const url = URL.createObjectURL(blob);
    const a = document.createElement('a');
    a.href = url;
    a.download = outputFileName;
    a.click();
    URL.revokeObjectURL(url);
  };

  return (
    <div style={{ textAlign: 'center', height: '300px' }}>
      <h1>Insert an OLE Object with a Custom Icon</h1>
      <button onClick={insertOleObjectWithIcon}>Start</button>
    </div>
  );
}

export default App;
Running it, the effect of inserting a PDF attachment with a custom icon as an OLE object:
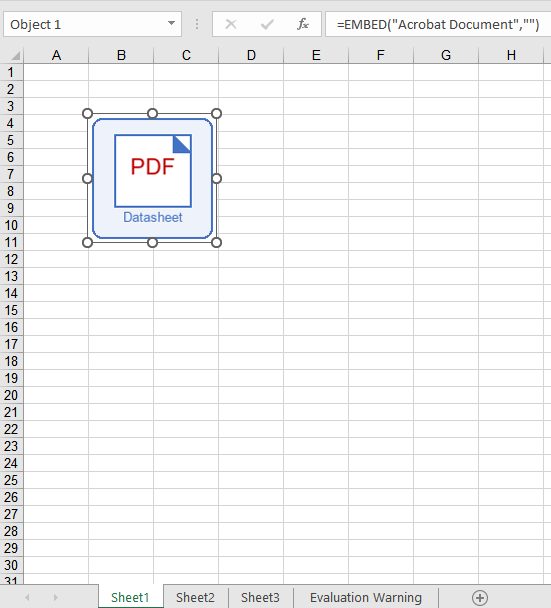
FAQ
Only a blank icon shows up on the sheet after inserting?
Cause: The second argument of OleObjects.Add decides the icon an OLE object shows on the sheet. When the image comes from ToImage, a region that falls outside the used range of the worksheet yields a blank picture, so the inserted object also shows only blank space.
Solution: Keep the region inside the part of the sheet that actually has content, or use a ready-made image file instead:
// Use a fixed picture as the icon, independent of the worksheet content
const iconStream = new xlsModule.Stream('OLEIcon.png');
const oleObject = sheet.OleObjects.Add('Attachment.pdf', iconStream, xlsModule.OleLinkType.Embed);
oleObject.Location = sheet.Range.get("B4");
oleObject.ObjectType = xlsModule.OleObjectType.AdobeAcrobatDocument;
What happens if ObjectType is set to something else?
Cause: ObjectType is not merely a comment—its value is written into the progId field of the workbook, and Excel uses that identifier to find the right program when the object is double-clicked. The same PDF attachment declares a progId of Acrobat Document under OleObjectType.AdobeAcrobatDocument; declare it as OleObjectType.ExcelWorksheet and the progId becomes Worksheet, so Excel attempts to open the PDF with Excel itself, and the object will not open.
Solution: Set ObjectType to the real type of the embedded file. The common values are:
| Embedded file | ObjectType |
|---|---|
| Excel workbook | OleObjectType.ExcelWorksheet |
| Word document | OleObjectType.WordDocument |
| PowerPoint presentation | OleObjectType.PowerPointSlide |
| PDF document | OleObjectType.AdobeAcrobatDocument |
// Declare the real file type so Excel opens it with the right program
oleObject.ObjectType = xlsModule.OleObjectType.AdobeAcrobatDocument;
Get a Free License
Spire.XLS for JavaScript offers a 30-day full-featured free trial license with no functional limitations. Apply here to evaluate before purchasing.
Autofit Row Heights and Column Widths in React with JavaScript
Once the data is in, a table usually needs one last pass before it is usable: a product name squeezed into a sliver of a column, a paragraph of remarks running along a single line until the next non-empty cell cuts it off. Dragging column borders and row dividers by hand is slow, and once there are enough columns it is easy to miss a few. Spire.XLS for JavaScript performs this work directly in the browser through WebAssembly, managing input and output files with a virtual file system (VFS) and requiring no backend service.
This article covers two key features:
- Autofit the Height of a Single Row and the Width of a Single Column
- Autofit the Heights of Multiple Rows and the Widths of Multiple Columns
For installation and project setup, see Integrating Spire.XLS for JavaScript in a React Project. The examples below assume Spire.XLS is already installed and the WebAssembly module has been initialized.
Autofit the Height of a Single Row and the Width of a Single Column
AutoFitRow works out the height of the given row from its content, and AutoFitColumn works out the width of the given column the same way. Each one affects only the row or the column it is pointed at and leaves the rest of the table untouched, which is what you want when a single overflow is the only thing in the way.
Note that row height autofit only means anything for content that needs to wrap: with wrapping turned off the text always sits on one line and the height simply follows the font size, so there is no taller value to calculate. The steps are:
- Load the workbook and get the first worksheet.
- Autofit the height of that row with
AutoFitRow. - Autofit the width of that column with
AutoFitColumn. - Save the workbook.
Here is a complete code example that autofits the height of a single row and the width of a single column in React:
function App() {
  const autoFitSingleRowColumn = async () => {
    // Get the Spire.XLS WASM module
    const xlsModule = window.wasmModule?.spirexls;

    // Check whether the module is ready
    if (!xlsModule) {
      alert('Spire.Xls is not ready yet');
      return;
    }

    // Load the font into the VFS
    await window.spire.FetchFileToVFS('ARIAL.TTF', '/Library/Fonts/', `${process.env.PUBLIC_URL}/font/`);

    // Load the Excel file into the VFS
    const inputFileName = 'AutoFitRowsAndColumns.xlsx';
    await window.spire.FetchFileToVFS(inputFileName, '', `${process.env.PUBLIC_URL}/static/data/`);

    // Load the workbook
    const workbook = new xlsModule.Workbook();
    workbook.LoadFromFile(inputFileName);

    // Get the first worksheet
    const sheet = workbook.Worksheets.get(0);

    // Autofit the height of row 2
    sheet.AutoFitRow(2);

    // Autofit the width of column 4
    sheet.AutoFitColumn(4);

    // Save the workbook
    const outputFileName = "AutoFitSingleRowColumn.xlsx";
    workbook.SaveToFile(outputFileName);

    // Dispose of the workbook object to free resources
    workbook.Dispose();

    // Read the result file from the VFS and trigger the download
    const fileArray = window.dotnetRuntime.Module.FS.readFile(outputFileName);
    const blob = new Blob([fileArray], { type: "application/vnd.openxmlformats-officedocument.spreadsheetml.sheet" });
    const url = URL.createObjectURL(blob);
    const a = document.createElement('a');
    a.href = url;
    a.download = outputFileName;
    a.click();
    URL.revokeObjectURL(url);
  };

  return (
    <div style={{ textAlign: 'center', height: '300px' }}>
      <h1>Autofit Row Height and Column Width</h1>
      <button onClick={autoFitSingleRowColumn}>Start</button>
    </div>
  );
}

export default App;
After running, the effect of autofitting a single row height and a single column width:
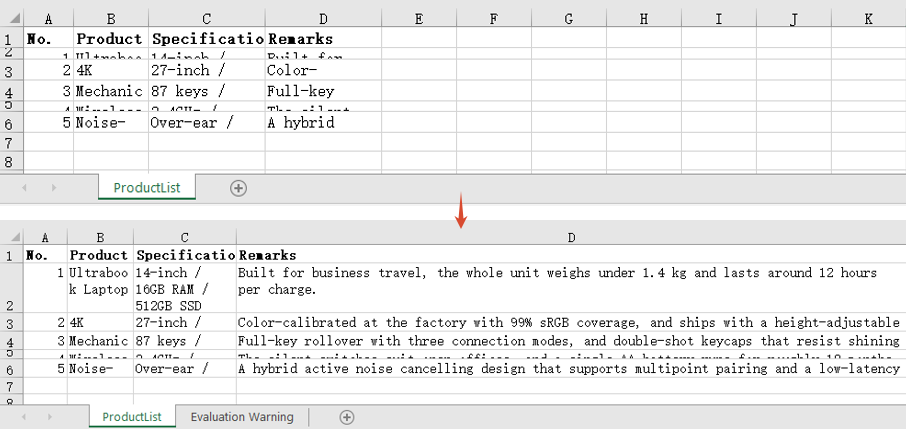
Autofit the Heights of Multiple Rows and the Widths of Multiple Columns
When the whole table needs tidying, calling the methods row by row is not realistic. Calling AutoFitRows or AutoFitColumns on a range recalculates every row and every column the range covers from its own content, so a single call lines up the whole block — the kind of pass you want before exporting a report. The steps are:
- Load the workbook and get the first worksheet.
- Autofit the heights of the rows with
AutoFitRows. - Autofit the widths of the columns with
AutoFitColumns. - Save the workbook.
Here is a complete code example that autofits the heights of multiple rows and the widths of multiple columns in React:
function App() {
  const autoFitMultipleRowsColumns = async () => {
    // Get the Spire.XLS WASM module
    const xlsModule = window.wasmModule?.spirexls;

    // Check whether the module is ready
    if (!xlsModule) {
      alert('Spire.Xls is not ready yet');
      return;
    }

    // Load the font into the VFS
    await window.spire.FetchFileToVFS('ARIAL.TTF', '/Library/Fonts/', `${process.env.PUBLIC_URL}/font/`);

    // Load the Excel file into the VFS
    const inputFileName = 'AutoFitRowsAndColumns.xlsx';
    await window.spire.FetchFileToVFS(inputFileName, '', `${process.env.PUBLIC_URL}/static/data/`);

    // Load the workbook
    const workbook = new xlsModule.Workbook();
    workbook.LoadFromFile(inputFileName);

    // Get the first worksheet
    const sheet = workbook.Worksheets.get(0);

    // Get the used range of the worksheet
    const range = sheet.AllocatedRange;

    // Autofit the height of every row in the range
    range.AutoFitRows();

    // Autofit the width of every column in the range
    range.AutoFitColumns();

    // Save the workbook
    const outputFileName = "AutoFitMultipleRowsColumns.xlsx";
    workbook.SaveToFile(outputFileName);

    // Dispose of the workbook object to free resources
    workbook.Dispose();

    // Read the result file from the VFS and trigger the download
    const fileArray = window.dotnetRuntime.Module.FS.readFile(outputFileName);
    const blob = new Blob([fileArray], { type: "application/vnd.openxmlformats-officedocument.spreadsheetml.sheet" });
    const url = URL.createObjectURL(blob);
    const a = document.createElement('a');
    a.href = url;
    a.download = outputFileName;
    a.click();
    URL.revokeObjectURL(url);
  };

  return (
    <div style={{ textAlign: 'center', height: '300px' }}>
      <h1>Autofit Row Height and Column Width</h1>
      <button onClick={autoFitMultipleRowsColumns}>Start</button>
    </div>
  );
}

export default App;
After running, the effect of autofitting multiple row heights and multiple column widths:
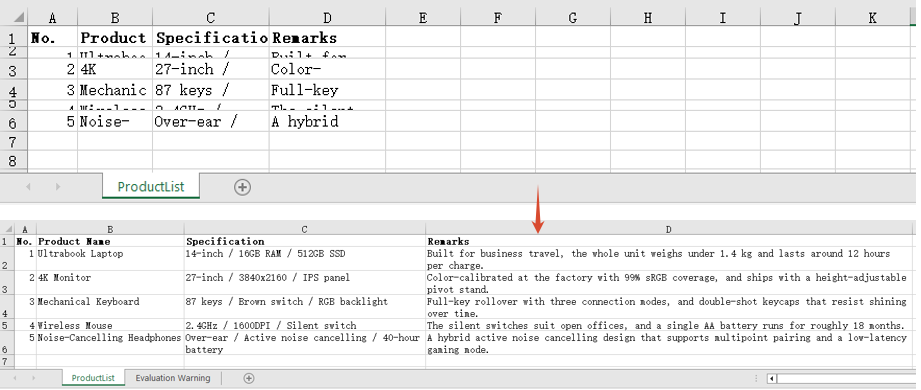
FAQ
I called AutoFitRow() and the row height did not change at all?
Cause: Row height autofit only applies to content that needs to wrap. With wrapping turned off the text stays on a single line and the height follows the font size, so autofit arrives at the same value as the existing height and appears to have done nothing.
Solution: Set WrapText to true first, then autofit the row height:
// With wrapping off, autofitting the row height changes nothing
sheet.Range.get("D2").Style.WrapText = false;
sheet.AutoFitRow(2);

// With wrapping on, the height is recalculated from the wrapped line count
sheet.Range.get("D2").Style.WrapText = true;
sheet.AutoFitRow(2);
AutoFitColumns() has no effect on merged cells?
Cause: Column width autofit measures the content of individual cells. In a merged range only the top-left cell actually holds text and every other position in the range is empty, so the width it works out is only enough for that top-left content.
Solution: Set the width of a merged range by hand with ColumnWidth:
// A7:D7 is a merged range, so autofit cannot work out its combined width
sheet.Range.get("A7:D7").Merge();
sheet.Range.get("A7:D7").AutoFitColumns();

// Set the column width by hand so the merged text fits
sheet.Range.get("A7").ColumnWidth = 40;
Get a Free License
Spire.XLS for JavaScript offers a 30-day full-featured free trial license with no functional limitations. Apply here to evaluate before purchasing.
Modify, Hide and Delete Named Ranges in React with JavaScript
A named range is not something you set up once and forget. As the data table is restructured, the original name may no longer fit, and the referred range can go stale when rows are added or removed. Some named ranges exist only as an intermediate helper for a formula and have no business showing up in the Name Manager. And named ranges that are no longer used, if kept forever, turn the name list into something long and hard to search. Modifying, hiding and deleting are therefore just as much a part of working with named ranges as creating them. Spire.XLS for JavaScript provides a complete named range management API and can perform all of the above in the browser through WebAssembly, with no backend service required.
This article covers three key features:
For installation and project setup, see Integrating Spire.XLS for JavaScript in a React Project. The examples below assume Spire.XLS is already installed and the WebAssembly module has been initialized.
Modify a Named Range
Modifying covers two independent aspects: the name itself and the referred range. The name is reassigned through the Name property and the referred range through the RefersToRange property. The two can be changed separately, or together as in the example below. The steps are:
- Load the workbook and get the first worksheet.
- Take the named range to modify with
workbook.NameRanges.get(0). - Set
Nameto the new name. - Point
RefersToRangeat the new cell range. - Save the workbook.
The following is a complete code example that shows how to modify a named range in React:
function App() {
  const modifyNamedRange = async () => {
    // Get the Spire.XLS WASM module
    const xlsModule = window.wasmModule?.spirexls;

    // Check if the module is ready
    if (!xlsModule) {
      alert('Spire.Xls is not ready yet');
      return;
    }

    // Load the font into VFS
    await window.spire.FetchFileToVFS('ARIAL.TTF', '/Library/Fonts/', `${process.env.PUBLIC_URL}/font/`);

    // Load the Excel file into VFS
    const inputFileName = 'AllNamedRanges.xlsx';
    await window.spire.FetchFileToVFS(inputFileName, '', `${process.env.PUBLIC_URL}/static/data/`);

    // Load the workbook
    const workbook = new xlsModule.Workbook();
    workbook.LoadFromFile(inputFileName);

    // Get the first worksheet
    let sheet = workbook.Worksheets.get(0);

    // Change the name of the named range
    workbook.NameRanges.get(0).Name = "RegionData";

    // Change the cell range the named range refers to
    workbook.NameRanges.get(0).RefersToRange = sheet.Range.get("B2:C4");

    // Save the workbook
    const outputFileName = 'ModifyNamedRange.xlsx';
    workbook.SaveToFile(outputFileName);

    // Release resources
    workbook.Dispose();

    // Read the result file from VFS and trigger the download
    const fileArray = window.dotnetRuntime.Module.FS.readFile(outputFileName);
    const blob = new Blob([fileArray], { type: "application/vnd.openxmlformats-officedocument.spreadsheetml.sheet" });
    const url = URL.createObjectURL(blob);
    const a = document.createElement('a');
    a.href = url;
    a.download = outputFileName;
    a.click();
    URL.revokeObjectURL(url);
  };

  return (
    <div style={{ textAlign: 'center', height: '300px' }}>
      <h1>Modify Named Range</h1>
      <button onClick={modifyNamedRange}>Start</button>
    </div>
  );
}

export default App;
After running, the effect of modifying a named range:
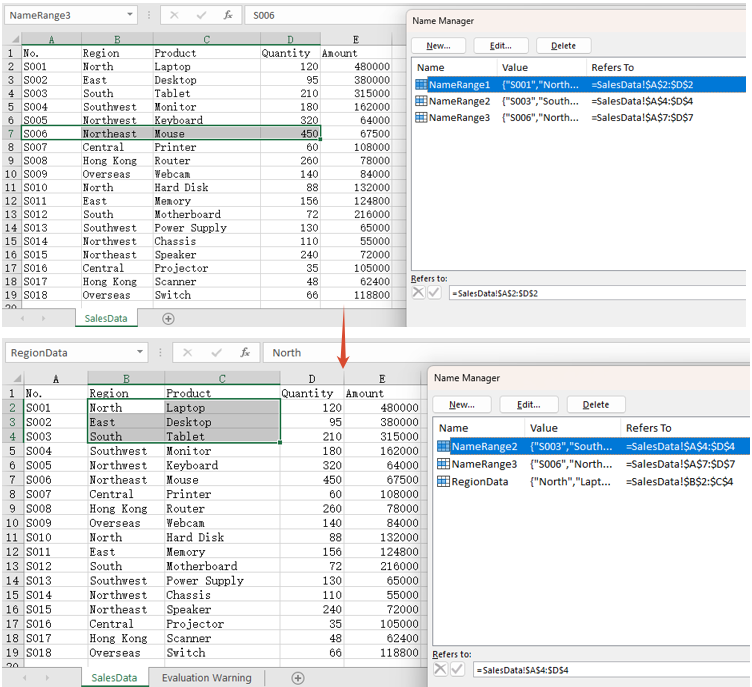
Hide a Named Range
Set the Visible property to false and the named range is hidden. A hidden named range is still stored in the workbook and formulas that refer to it are unaffected — it simply no longer appears in Excel's Name Manager and name box, which keeps the name list tidy. After hiding it, the example below also writes the formula =SUM(NameRange1) into cell F2: the formula still calculates normally, which is exactly what shows that the named range is only hidden, not deleted. The steps are:
- Load the workbook and get the first worksheet.
- Take the named range to hide.
- Set
Visibletofalse. - Write a formula that refers to the named range into a cell, to confirm it still works.
- Save the workbook.
The following is a complete code example that shows how to hide a named range in React:
function App() {
  const hideNamedRange = async () => {
    // Get the Spire.XLS WASM module
    const xlsModule = window.wasmModule?.spirexls;

    // Check if the module is ready
    if (!xlsModule) {
      alert('Spire.Xls is not ready yet');
      return;
    }

    // Load the font into VFS
    await window.spire.FetchFileToVFS('ARIAL.TTF', '/Library/Fonts/', `${process.env.PUBLIC_URL}/font/`);

    // Load the Excel file into VFS
    const inputFileName = 'AllNamedRanges.xlsx';
    await window.spire.FetchFileToVFS(inputFileName, '', `${process.env.PUBLIC_URL}/static/data/`);

    // Load the workbook
    const workbook = new xlsModule.Workbook();
    workbook.LoadFromFile(inputFileName);

    // Get the first worksheet
    let sheet = workbook.Worksheets.get(0);

    // Hide the first named range
    workbook.NameRanges.get(0).Visible = false;

    // Write a formula that refers to the hidden named range, proving it still exists and works
    sheet.Range.get("F1").Text = "Sum After Hiding";
    sheet.Range.get("F2").Formula = "=SUM(NameRange1)";

    // Calculate the formulas so the saved file shows the result as soon as it is opened
    workbook.CalculateAllValue();

    // Save the workbook
    const outputFileName = 'HideNamedRange.xlsx';
    workbook.SaveToFile(outputFileName);

    // Release resources
    workbook.Dispose();

    // Read the result file from VFS and trigger the download
    const fileArray = window.dotnetRuntime.Module.FS.readFile(outputFileName);
    const blob = new Blob([fileArray], { type: "application/vnd.openxmlformats-officedocument.spreadsheetml.sheet" });
    const url = URL.createObjectURL(blob);
    const a = document.createElement('a');
    a.href = url;
    a.download = outputFileName;
    a.click();
    URL.revokeObjectURL(url);
  };

  return (
    <div style={{ textAlign: 'center', height: '300px' }}>
      <h1>Hide Named Range</h1>
      <button onClick={hideNamedRange}>Start</button>
    </div>
  );
}

export default App;
After running, the effect of hiding a named range:
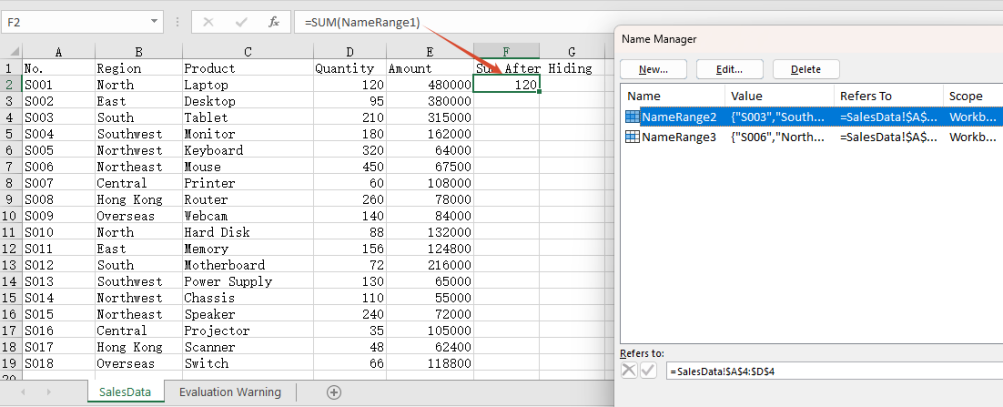
Note: The formula in cell F2 refers to the hidden NameRange1, and it still calculates 120. That shows the named range has only been hidden from view, not removed from the workbook.
Delete a Named Range
There are two ways to delete a named range: call Remove() when the name is known, or RemoveAt() when the position is known. Both remove the named range from the workbook entirely. The steps are:
- Load the workbook.
- Call
Remove()to delete a named range by name. - Call
RemoveAt()to delete a named range by index. - Save the workbook.
The following is a complete code example that shows how to delete a named range in React:
function App() {
  const deleteNamedRange = async () => {
    // Get the Spire.XLS WASM module
    const xlsModule = window.wasmModule?.spirexls;

    // Check if the module is ready
    if (!xlsModule) {
      alert('Spire.Xls is not ready yet');
      return;
    }

    // Load the font into VFS
    await window.spire.FetchFileToVFS('ARIAL.TTF', '/Library/Fonts/', `${process.env.PUBLIC_URL}/font/`);

    // Load the Excel file into VFS
    const inputFileName = 'AllNamedRanges.xlsx';
    await window.spire.FetchFileToVFS(inputFileName, '', `${process.env.PUBLIC_URL}/static/data/`);

    // Load the workbook
    const workbook = new xlsModule.Workbook();
    workbook.LoadFromFile(inputFileName);

    // Delete a named range by name
    workbook.NameRanges.Remove("NameRange2");

    // Delete a named range by index
    workbook.NameRanges.RemoveAt(0);

    // Save the workbook
    const outputFileName = 'DeleteNamedRange.xlsx';
    workbook.SaveToFile(outputFileName);

    // Release resources
    workbook.Dispose();

    // Read the result file from VFS and trigger the download
    const fileArray = window.dotnetRuntime.Module.FS.readFile(outputFileName);
    const blob = new Blob([fileArray], { type: "application/vnd.openxmlformats-officedocument.spreadsheetml.sheet" });
    const url = URL.createObjectURL(blob);
    const a = document.createElement('a');
    a.href = url;
    a.download = outputFileName;
    a.click();
    URL.revokeObjectURL(url);
  };

  return (
    <div style={{ textAlign: 'center', height: '300px' }}>
      <h1>Delete Named Range</h1>
      <button onClick={deleteNamedRange}>Start</button>
    </div>
  );
}

export default App;
After running, the effect of deleting a named range:
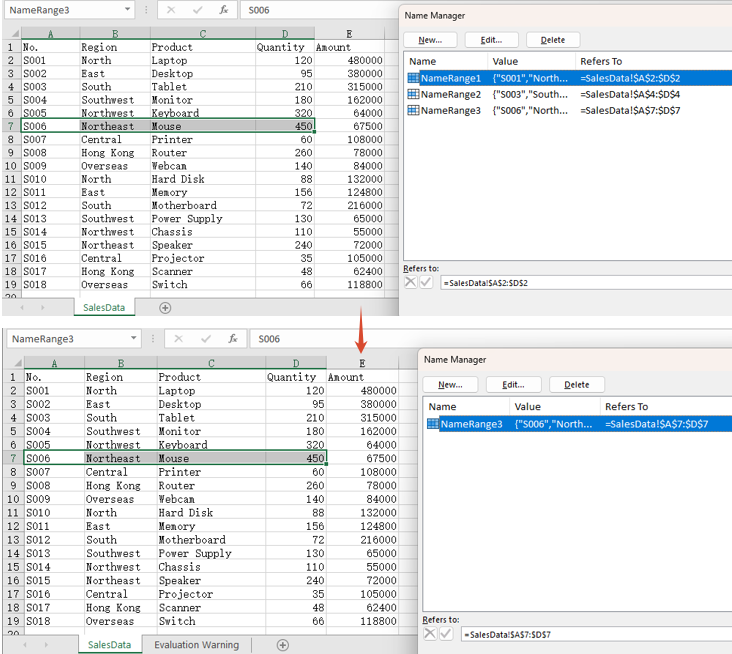
FAQ
Why is the result of a formula missing when the saved file is opened?
Cause: Setting only the Formula property of a cell does not make Spire calculate it. The saved file then contains the formula itself but no calculated result value, so the cell comes up blank when the file is opened.
Solution: Call workbook.CalculateAllValue() before saving, to evaluate the formulas first:
// Calculate all formulas so the result value is written into the saved file
workbook.CalculateAllValue();
Can I pass a named range object to the delete API?
Cause: Remove() takes a name string. Passing a NameRange object does not match the expected type and throws Assert failed: Value is not a String, and nothing is deleted.
Solution: Pass the name when it is known, or the index when the position is known:
// Delete by name
workbook.NameRanges.Remove("NameRange2");

// Delete by index
workbook.NameRanges.RemoveAt(0);
Get a Free License
Spire.XLS for JavaScript offers a 30-day full-featured free trial license with no functional limitations. Apply here to evaluate before purchasing.