
JavaScript (102)
Add, Preview, and Remove Excel Page Breaks with JavaScript in React
2026-08-12 06:20:20 Written by Lisa LiPage breaks are an important tool for controlling the print layout of Excel. They determine where data is divided across printed pages. Setting page breaks properly prevents data from being broken apart pointlessly when printing, resulting in clean, readable paper or PDF reports. Spire.XLS for JavaScript uses WebAssembly to add, preview, and remove page breaks directly in the browser, managing input and output files through a virtual file system (VFS) — no backend server required.
This article covers three core features:
For installation and project configuration, refer to Integrating Spire.XLS for JavaScript in a React Project. The examples below assume Spire.XLS is installed and the WebAssembly module is initialized.
Add Page Breaks
When printing reports, we often want to split data by a fixed number of rows and columns, for example printing a fixed number of data rows per page. Spire.XLS for JavaScript adds horizontal page breaks using the HPageBreaks.Add method and vertical page breaks using the VPageBreaks.Add method, enabling precise page break control.
function App() {
  const sheetToSVG = async () => {
    // Get the Spire.XLS WASM module
    const xlsModule = window.wasmModule?.spirexls;

    // Check if the module is ready
    if (!xlsModule) {
      alert('Spire.Xls is not ready yet');
      return;
    }

    // Load fonts and the Excel file into VFS
    await window.spire.FetchFileToVFS('ARIAL.TTF', '/Library/Fonts/', `${process.env.PUBLIC_URL}/font/`);
    const inputFileName = 'Template_Xls_4.xlsx';
    await window.spire.FetchFileToVFS(inputFileName, '', `${process.env.PUBLIC_URL}/static/data/`);

    // Load the workbook
    const workbook = new xlsModule.Workbook();
    workbook.LoadFromFile({ fileName: inputFileName });

    // Get the first worksheet
    const sheet = workbook.Worksheets.get(0);

    // Add a horizontal page break at row E4
    sheet.HPageBreaks.Add(sheet.Range.get("E4"));
    // Add a vertical page break at column C4
    sheet.VPageBreaks.Add(sheet.Range.get("C4"));

    const outputFileName = "AddPageBreakInXlsFile.xlsx";
    workbook.SaveToFile({ fileName: outputFileName });

    // Release the workbook object to free resources
    workbook.Dispose();

    // Read the converted file from VFS and trigger download
    const fileArray = window.dotnetRuntime.Module.FS.readFile(outputFileName);
    const blob = new Blob([fileArray], { type: "application/vnd.openxmlformats-officedocument.spreadsheetml.sheet" });
    const url = URL.createObjectURL(blob);
    const a = document.createElement('a');
    a.href = url;
    a.download = outputFileName;
    a.click();
    URL.revokeObjectURL(url);
  };

  return (
    <div style={{ textAlign: 'center', height: '300px' }}>
      <h1>Add Page Break</h1>
      <button onClick={sheetToSVG}>
        Start
      </button>
    </div>
  );
}

export default App;
Original document 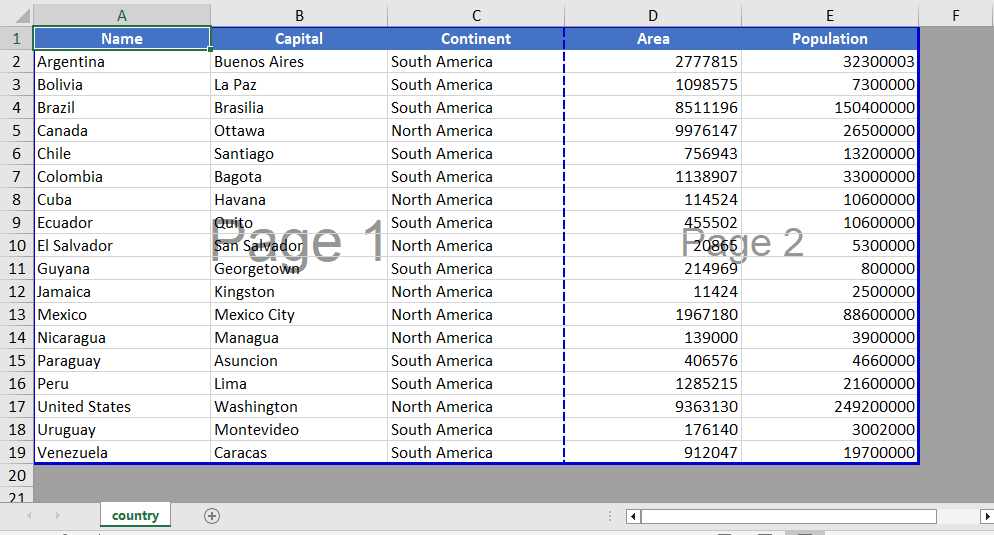 Add page break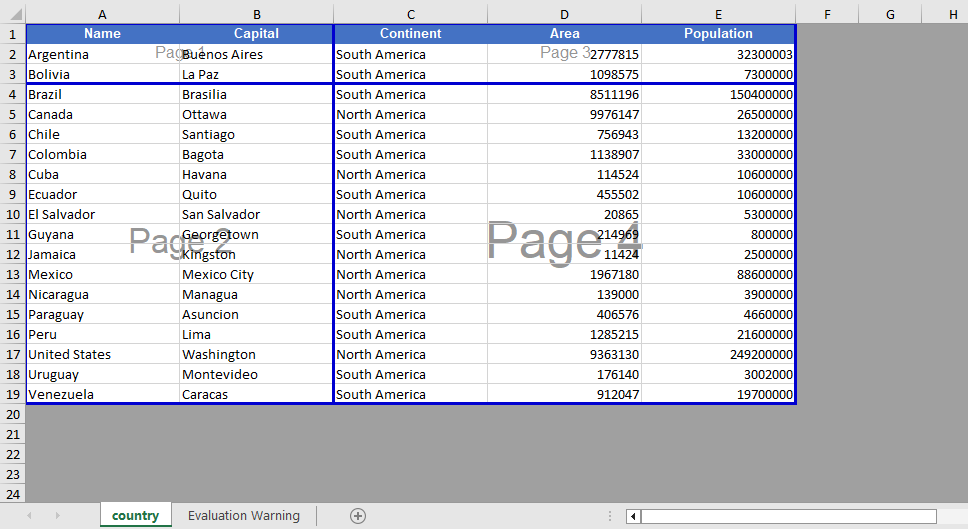
Page Break View Zoom Scale Setting
When viewing page break positions in the view mode, Spire.XLS for JavaScript supports setting the zoom scale of the page break preview view through the ZoomScalePageBreakView property.
function App() {
  const sheetToSVG = async () => {
    // Get the Spire.XLS WASM module
    const xlsModule = window.wasmModule?.spirexls;

    // Check if the module is ready
    if (!xlsModule) {
      alert('Spire.Xls is not ready yet');
      return;
    }

    // Load fonts and the Excel file into VFS
    await window.spire.FetchFileToVFS('ARIAL.TTF', '/Library/Fonts/', `${process.env.PUBLIC_URL}/font/`);
    const inputFileName = 'Template_Xls_4.xlsx';
    await window.spire.FetchFileToVFS(inputFileName, '', `${process.env.PUBLIC_URL}/static/data/`);

    // Load the workbook
    const workbook = new xlsModule.Workbook();
    workbook.LoadFromFile({ fileName: inputFileName });

    // Get the first worksheet
    const sheet = workbook.Worksheets.get(0);

    // Set the zoom scale of the page break preview view
    sheet.ZoomScalePageBreakView = 80;

    const outputFileName = "PageBreakPreview.xlsx";
    workbook.SaveToFile({ fileName: outputFileName });

    // Release the workbook object to free resources
    workbook.Dispose();

    // Read the converted file from VFS and trigger download
    const fileArray = window.dotnetRuntime.Module.FS.readFile(outputFileName);
    const blob = new Blob([fileArray], { type: "application/vnd.openxmlformats-officedocument.spreadsheetml.sheet" });
    const url = URL.createObjectURL(blob);
    const a = document.createElement('a');
    a.href = url;
    a.download = outputFileName;
    a.click();
    URL.revokeObjectURL(url);
  };

  return (
    <div style={{ textAlign: 'center', height: '300px' }}>
      <h1>Page Break Preview</h1>
      <button onClick={sheetToSVG}>
        Start
      </button>
    </div>
  );
}

export default App;
Before setting the zoom scale 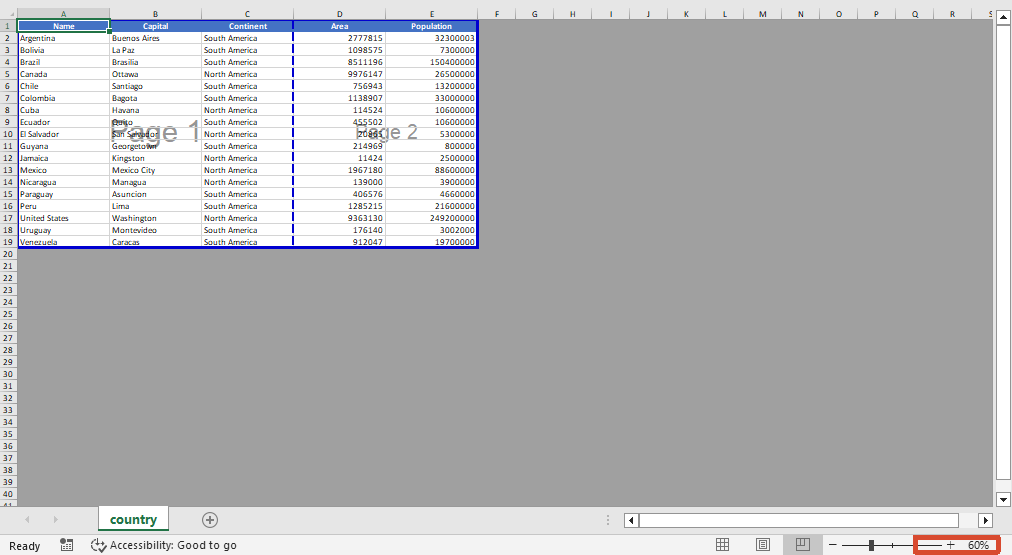 After setting the zoom scale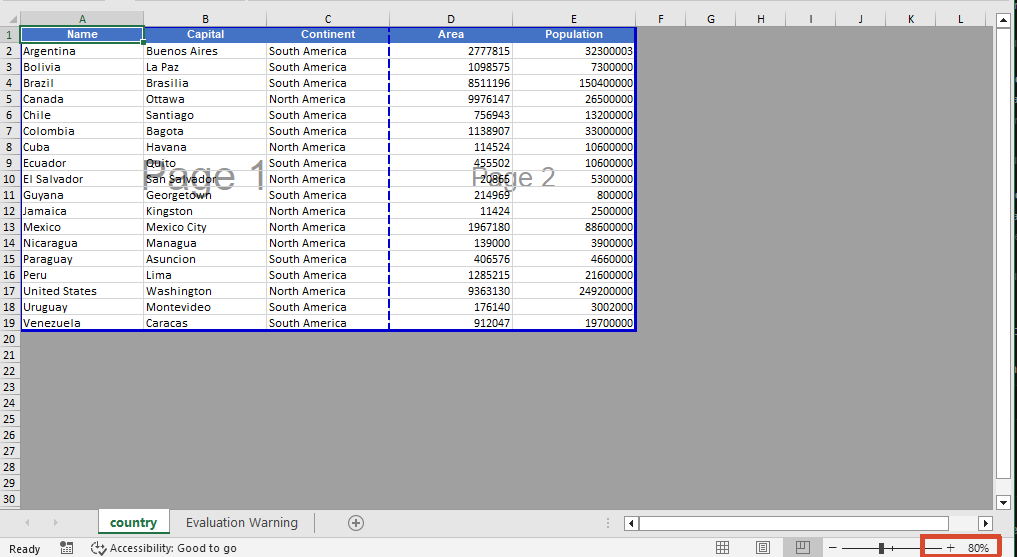
Remove Page Breaks
When page breaks are no longer needed, you can clear all page breaks in a specific direction using the Clear method, or delete the page break at a specific position by index using the RemoveAt method. After removal, you can also switch the worksheet to the page break preview view via the ViewMode property to visually confirm the page break effect.
function App() {
  const sheetToSVG = async () => {
    // Get the Spire.XLS WASM module
    const xlsModule = window.wasmModule?.spirexls;

    // Check if the module is ready
    if (!xlsModule) {
      alert('Spire.Xls is not ready yet');
      return;
    }

    // Load fonts and the Excel file into VFS
    await window.spire.FetchFileToVFS('ARIAL.TTF', '/Library/Fonts/', `${process.env.PUBLIC_URL}/font/`);
    const inputFileName = 'PageBreak.xlsx';
    await window.spire.FetchFileToVFS(inputFileName, '', `${process.env.PUBLIC_URL}/static/data/`);

    // Load the workbook
    const workbook = new xlsModule.Workbook();
    workbook.LoadFromFile({ fileName: inputFileName });

    // Get the first worksheet
    const sheet = workbook.Worksheets.get(0);

    // Clear all vertical page breaks
    sheet.VPageBreaks.Clear();

    // Remove the first horizontal page break
    sheet.HPageBreaks.RemoveAt(0);

    // Set the view mode to page break preview to check the page break effect
    sheet.ViewMode = xlsModule.ViewMode.Preview;

    const outputFileName = "RemovePageBreak_output.xlsx";
    workbook.SaveToFile({ fileName: outputFileName });

    // Release the workbook object to free resources
    workbook.Dispose();

    // Read the converted file from VFS and trigger download
    const fileArray = window.dotnetRuntime.Module.FS.readFile(outputFileName);
    const blob = new Blob([fileArray], { type: "application/vnd.openxmlformats-officedocument.spreadsheetml.sheet" });
    const url = URL.createObjectURL(blob);
    const a = document.createElement('a');
    a.href = url;
    a.download = outputFileName;
    a.click();
    URL.revokeObjectURL(url);
  };

  return (
    <div style={{ textAlign: 'center', height: '300px' }}>
      <h1>Remove Page Break</h1>
      <button onClick={sheetToSVG}>
        Start
      </button>
    </div>
  );
}

export default App;
Before removing the page break 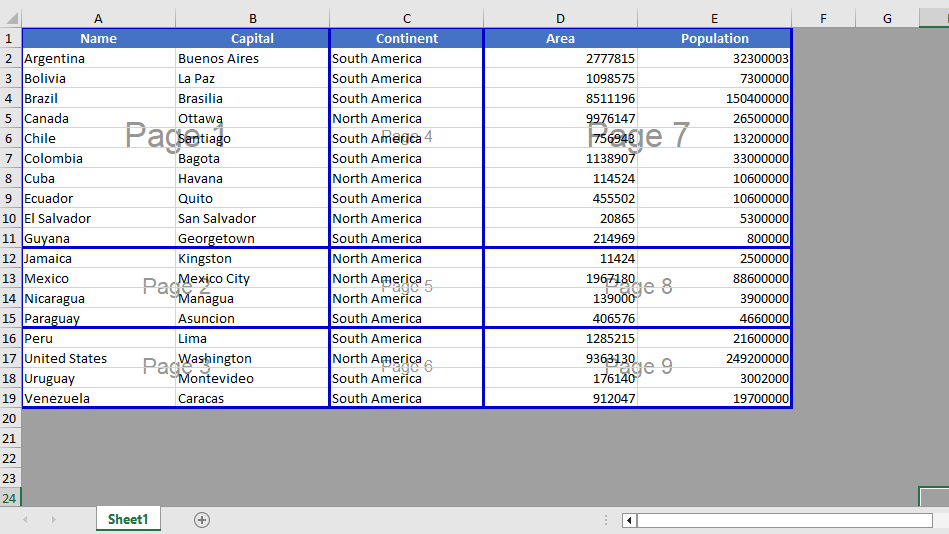 After removing the page break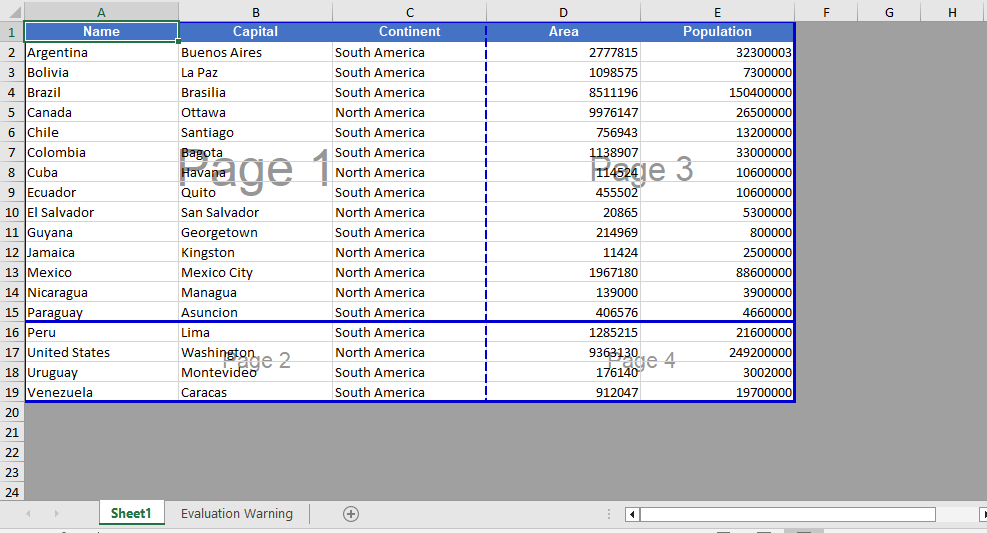
FAQ
Page breaks do not take effect when printing after being added
Cause: The page break was added to a blank area, or the worksheet has a fixed print zoom scale set, causing the actual page break positions during printing to differ from what was expected.
Solution: Confirm that the page break is added on the row or column of a cell containing data, and check the worksheet's print zoom settings. If necessary, adjust the zoom scale through properties such as ZoomScalePageBreakView so the page breaks take effect as expected.
Page break lines still display after removal
Cause: The worksheet is still in page break preview view mode, or there are automatic page breaks that are generated automatically based on the amount of data.
Solution: Automatic page breaks cannot be removed directly by programming; automatic page breaks are determined by the number of data rows, columns, and the page size. They can be eliminated by adjusting row heights, column widths, or the print zoom scale.
Get a Free License
If you want to remove the evaluation messages in the resulting documents, or get rid of functional limitations, please contact sales to obtain a temporary license valid for 30 days.
A pivot chart is a graphical representation of the summarized results of a pivot table, making data comparisons and trends immediately visible. It is an essential tool for data analysis and report presentation. Spire.XLS for JavaScript runs entirely in the browser via WebAssembly, using a virtual file system (VFS) to manage input and output files — no backend server required. It provides a complete API for creating pivot charts based on pivot tables, controlling the display of pivot chart field buttons, and customizing the appearance of pivot chart series.
This article covers three core features:
- Create a Pivot Chart in Excel
- Show or Hide Field Buttons of an Excel Pivot Chart
- Set the Format of Excel Pivot Chart Series
For installation and project setup, refer to Integrating Spire.XLS for JavaScript in a React Project. The examples below assume Spire.XLS is installed and the WebAssembly module is initialized.
Create a Pivot Chart in Excel
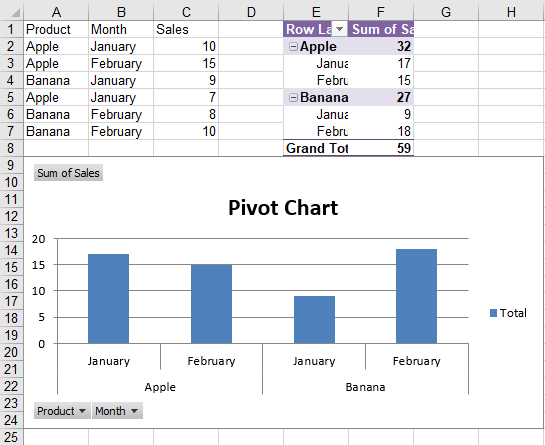
A pivot chart must be created based on a pivot table. With Spire.XLS for JavaScript, you can first create a pivot table in a worksheet, and then use the Charts.Add() method with the pivotChartType and pivotTable parameters to generate a corresponding pivot chart directly from the pivot table. The steps are as follows:
- Create a
Workbookobject and get the default worksheet. - Populate the worksheet with the source data required for the pivot table.
- Create a pivot table cache using
PivotCaches.Add(). - Add a pivot table using
PivotTables.Add(), and drag fields to the row area and the data area. - Add a chart using
sheet.Charts.Add(), and create a pivot chart based on the pivot table via thepivotChartTypeandpivotTableparameters. - Set the position and title of the pivot chart.
- Save the workbook to an Excel file using
SaveToFile().
Below is a complete code example demonstrating how to create a pivot chart based on a pivot table in React:
function App() {
  const createPivotChart = async () => {
    // Get the Spire.XLS WASM module
    const xlsModule = window.wasmModule?.spirexls;

    // Check if the module is ready
    if (!xlsModule) {
      alert('Spire.Xls is not ready yet');
      return;
    }

    // Load the font into the virtual file system (VFS)
    await window.spire.FetchFileToVFS('ARIAL.TTF', '/Library/Fonts/', `${process.env.PUBLIC_URL}/font/`);

    // Create a new workbook and get the default worksheet
    const workbook = new xlsModule.Workbook();
    let sheet = workbook.Worksheets.get(0);

    // Populate the source data for the pivot table
    sheet.Range.get('A1').Value = 'Product';
    sheet.Range.get('B1').Value = 'Month';
    sheet.Range.get('C1').Value = 'Sales';

    sheet.Range.get('A2').Value = 'Apple';
    sheet.Range.get('A3').Value = 'Apple';
    sheet.Range.get('A4').Value = 'Banana';
    sheet.Range.get('A5').Value = 'Apple';
    sheet.Range.get('A6').Value = 'Banana';
    sheet.Range.get('A7').Value = 'Banana';

    sheet.Range.get('B2').Value = 'January';
    sheet.Range.get('B3').Value = 'February';
    sheet.Range.get('B4').Value = 'January';
    sheet.Range.get('B5').Value = 'January';
    sheet.Range.get('B6').Value = 'February';
    sheet.Range.get('B7').Value = 'February';

    sheet.Range.get('C2').Value = '10';
    sheet.Range.get('C3').Value = '15';
    sheet.Range.get('C4').Value = '9';
    sheet.Range.get('C5').Value = '7';
    sheet.Range.get('C6').Value = '8';
    sheet.Range.get('C7').Value = '10';

    // Create a pivot table
    let dataRange = sheet.Range.get('A1:C7');
    let cache = workbook.PivotCaches.Add({ range: dataRange });
    let pivotTable = sheet.PivotTables.Add('Pivot Table', sheet.Range.get({ row: 1, column: 5 }), cache);

    // Drag fields to the row area
    let pf = pivotTable.PivotFields.get_Item('Product');
    pf.Axis = xlsModule.AxisTypes.Row;
    let pf2 = pivotTable.PivotFields.get_Item('Month');
    pf2.Axis = xlsModule.AxisTypes.Row;

    // Drag a field to the data area
    pivotTable.DataFields.Add(pivotTable.PivotFields.get_Item('Sales'), 'Sum of Sales', xlsModule.SubtotalTypes.Sum);

    // Set the pivot table style and calculate the data
    pivotTable.BuiltInStyle = xlsModule.PivotBuiltInStyles.PivotStyleMedium12;
    pivotTable.CalculateData();

    // Create a clustered column chart based on the pivot table
    let chart = sheet.Charts.Add({ pivotChartType: xlsModule.ExcelChartType.ColumnClustered, pivotTable: pivotTable });
    // Set the pivot chart position
    chart.TopRow = 9;
    chart.LeftColumn = 1;
    chart.RightColumn = 9;
    chart.BottomRow = 25;
    // Set the pivot chart title
    chart.ChartTitle = "Pivot Chart";

    // Save the workbook
    const outputFileName = 'PivotChart.xlsx';
    workbook.SaveToFile(outputFileName);
    workbook.Dispose();

    // Read the file from VFS and trigger download
    const fileArray = window.dotnetRuntime.Module.FS.readFile(outputFileName);
    const blob = new Blob([fileArray], { type: 'application/vnd.openxmlformats-officedocument.spreadsheetml.sheet' });
    const url = URL.createObjectURL(blob);
    const a = document.createElement('a');
    a.href = url;
    a.download = outputFileName;
    a.click();
    URL.revokeObjectURL(url);
  };

  return (
    <div style={{ textAlign: 'center', height: '300px' }}>
      <h1>Create Pivot Chart</h1>
      <button onClick={createPivotChart}>
        Generate
      </button>
    </div>
  );
}

export default App;
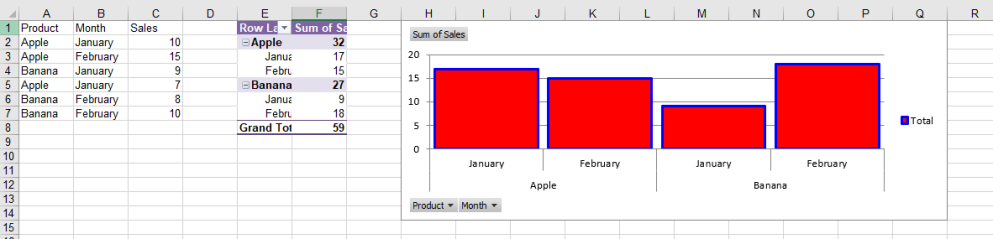
Pivot chart created in Excel with Spire.XLS for JavaScript
Show or Hide Field Buttons of an Excel Pivot Chart
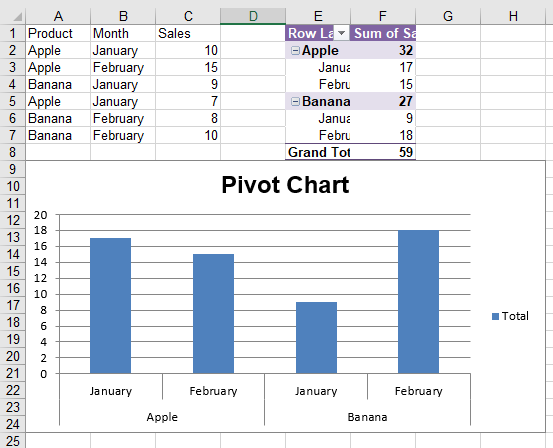
By default, a pivot chart displays field buttons, allowing users to interactively filter and switch field data. When generating reports, you may want to hide some or all of the field buttons to make the chart cleaner. Spire.XLS for JavaScript provides properties such as DisplayEntireFieldButtons, DisplayValueFieldButtons, DisplayAxisFieldButtons, DisplayLegendFieldButtons, and ShowReportFilterFieldButtons to flexibly control the display of each type of field button. The steps are as follows:
- Create a
Workbookobject and load an existing Excel file containing a pivot chart. - Get the worksheet via
workbook.Worksheets.get(). - Get the pivot chart object using
sheet.Charts.get(). - Control whether to display all field buttons via
DisplayEntireFieldButtons. - Control the display of each type of field button via
DisplayValueFieldButtons,DisplayAxisFieldButtons,DisplayLegendFieldButtons, andShowReportFilterFieldButtons. - Save the workbook to an Excel file using
SaveToFile().
Below is a complete code example demonstrating how to show or hide pivot chart field buttons in React (the example loads the PivotChart.xlsx file generated in the previous section):
function App() {
  const showHideFieldButtons = async () => {
    // Get the Spire.XLS WASM module
    const xlsModule = window.wasmModule?.spirexls;

    // Check if the module is ready
    if (!xlsModule) {
      alert('Spire.Xls is not ready yet');
      return;
    }

    // Load the sample file containing a pivot chart into the virtual file system (VFS)
    let excelFileName = 'PivotChart.xlsx';
    await window.spire.FetchFileToVFS(excelFileName, '', `${process.env.PUBLIC_URL}data/`);

    // Create a workbook object and load the existing file
    const workbook = new xlsModule.Workbook();
    workbook.LoadFromFile({ fileName: excelFileName });

    // Get the first worksheet
    let sheet = workbook.Worksheets.get(0);

    // Get the pivot chart
    let chart = sheet.Charts.get(0);

    // Control the display of all field buttons
    chart.DisplayEntireFieldButtons = true;

    // Hide the value field buttons
    chart.DisplayValueFieldButtons = false;
    // Hide the axis field buttons
    chart.DisplayAxisFieldButtons = false;
    // Hide the legend field buttons
    //chart.DisplayLegendFieldButtons = false;
    // Show the report filter field buttons
    //chart.ShowReportFilterFieldButtons = true;

    // Save the workbook
    const outputFileName = 'PivotChartFieldButtons.xlsx';
    workbook.SaveToFile(outputFileName);
    workbook.Dispose();

    // Read the file from VFS and trigger download
    const fileArray = window.dotnetRuntime.Module.FS.readFile(outputFileName);
    const blob = new Blob([fileArray], { type: 'application/vnd.openxmlformats-officedocument.spreadsheetml.sheet' });
    const url = URL.createObjectURL(blob);
    const a = document.createElement('a');
    a.href = url;
    a.download = outputFileName;
    a.click();
    URL.revokeObjectURL(url);
  };

  return (
    <div style={{ textAlign: 'center', height: '300px' }}>
      <h1>Show/Hide PivotChart Field Buttons</h1>
      <button onClick={showHideFieldButtons}>
        Generate
      </button>
    </div>
  );
}

export default App;
Pivot chart field buttons shown or hidden with Spire.XLS for JavaScript
Set the Format of Excel Pivot Chart Series
Formatting the series of a pivot chart can make the chart more visually appealing and clearly organized, conveying data information more effectively. With Spire.XLS for JavaScript, you can load an Excel file containing a pivot chart, get the pivot chart via the Charts.get() method, then set fill types, colors, and border styles via the series' DataFormat property, and set formats such as the gap width of the data bars via the format object returned by the GetCommonSerieFormat() method. The steps are as follows:
- Create a
Workbookobject. - Load an Excel file containing a pivot chart using the
LoadFromFile()method. - Get a specific worksheet in the Excel file using the
Worksheets.get()method. - Get the pivot chart in the worksheet using the
Charts.get()method. - Set the position and title of the pivot chart.
- Get the data series of the pivot chart using the
Series.get()method. - Set fill types, colors, and border styles via the
DataFormatproperty, and set formats such as the gap width of the data bars via theGetCommonSerieFormat()method. - Save the generated file using the
SaveToFile()method.
Below is a complete code example demonstrating how to set the format of pivot chart series in React (the example loads the PivotChart.xlsx file containing a pivot chart generated in the previous section):
function App() {
  const formatPivotChartSeries = async () => {
    // Get the Spire.XLS WASM module
    const xlsModule = window.wasmModule?.spirexls;

    // Check if the module is ready
    if (!xlsModule) {
      alert('Spire.Xls is not ready yet');
      return;
    }

    // Load the sample file containing a pivot table into the virtual file system (VFS)
    let excelFileName = 'PivotChart.xlsx';
    await window.spire.FetchFileToVFS(excelFileName, '', `${process.env.PUBLIC_URL}data/`);

    // Create a Workbook object
    const workbook = new xlsModule.Workbook();
    // Load the Excel file
    workbook.LoadFromFile({ fileName: excelFileName });

    // Get the first worksheet
    let sheet = workbook.Worksheets.get(0);

    // Get the pivot chart
    let chart = sheet.Charts.get(0);

    // Set the pivot chart position
    chart.TopRow = 1;
    chart.LeftColumn = 8;
    chart.RightColumn = 18;
    chart.BottomRow = 15;

    // Set the chart title
    chart.ChartTitle = "";

    // Add a series to the pivot chart
    let series = chart.Series.get(0);

    // Set the gap width of the data bars
    series.GetCommonSerieFormat().GapWidth = 10;
    // series.GetCommonSerieFormat().Overlap = 100;

    // Set the fill type, foreground color, and background color of the series
    series.DataFormat.Fill.FillType = xlsModule.ShapeFillType.SolidColor;
    series.DataFormat.ForeGroundColor = xlsModule.Color.get_Red();
    series.DataFormat.BackGroundColor = xlsModule.Color.get_White();

    // Set the border color, line style, and line weight of the series
    series.DataFormat.LineProperties.Pattern = xlsModule.ChartLinePatternType.Solid;
    series.DataFormat.LineProperties.Color = xlsModule.Color.get_Blue();
    series.DataFormat.LineProperties.CustomLineWeight = 2.5;

    // Add a shadow effect to the series
    series.DataFormat.IsShadow = true;

    // Save the workbook
    const outputFileName = 'PivotChartSeriesFormat.xlsx';
    workbook.SaveToFile(outputFileName);
    workbook.Dispose();

    // Read the file from VFS and trigger download
    const fileArray = window.dotnetRuntime.Module.FS.readFile(outputFileName);
    const blob = new Blob([fileArray], { type: 'application/vnd.openxmlformats-officedocument.spreadsheetml.sheet' });
    const url = URL.createObjectURL(blob);
    const a = document.createElement('a');
    a.href = url;
    a.download = outputFileName;
    a.click();
    URL.revokeObjectURL(url);
  };

  return (
    <div style={{ textAlign: 'center', height: '300px' }}>
      <h1>Format PivotChart Series</h1>
      <button onClick={formatPivotChartSeries}>
        Generate
      </button>
    </div>
  );
}

export default App;
Pivot chart series format set with Spire.XLS for JavaScript
FAQ
How to refresh a pivot chart to show the latest data?
Cause: A pivot chart is created based on a pivot table. After modifying the data source of the pivot table, the chart does not automatically sync the updates.
Solution: After modifying the data source, use the Cache.IsRefreshOnLoad property to make the pivot table refresh automatically when the file opens, so the pivot chart is updated accordingly:
// Get the pivot table
let pivotTable = sheet.PivotTables.get(0);
// Refresh the pivot table automatically when the file opens
pivotTable.Cache.IsRefreshOnLoad = true;
Why does my pivot chart not show any data?
Cause: The series of a pivot chart come from the summarized results of a pivot table. If the pivot table has not been calculated, or the pivot chart was not correctly associated with the pivot table, the chart may appear blank.
Solution: Call the CalculateData() method after creating the pivot table to calculate the results, and correctly associate the pivot table via the pivotTable parameter when creating the pivot chart:
// Calculate the data of the pivot table
pivotTable.CalculateData();

// Create a pivot chart based on the pivot table
let chart = sheet.Charts.Add({ pivotChartType: xlsModule.ExcelChartType.ColumnClustered, pivotTable: pivotTable });
Get a Free License
Spire.XLS for JavaScript offers a 30-day full-featured free trial license with no functional limitations. Apply here to evaluate before purchasing.
In office automation workflows, you often need to batch-extract product images from Excel reports, replace outdated logos, or export a specific image individually. Spire.XLS for JavaScript handles all of these image operations directly in the browser via WebAssembly, using a virtual file system (VFS) to manage input and output files — no backend server is required.
This article covers three core features:
- Extract All Images from a Worksheet
- Extract a Specific Image
- Replace an Existing Image in a Worksheet
For installation and project setup, refer to Integrating Spire.XLS for JavaScript in a React Project. The examples below assume Spire.XLS is installed and the WebAssembly module is initialized.
Extract All Images from a Worksheet
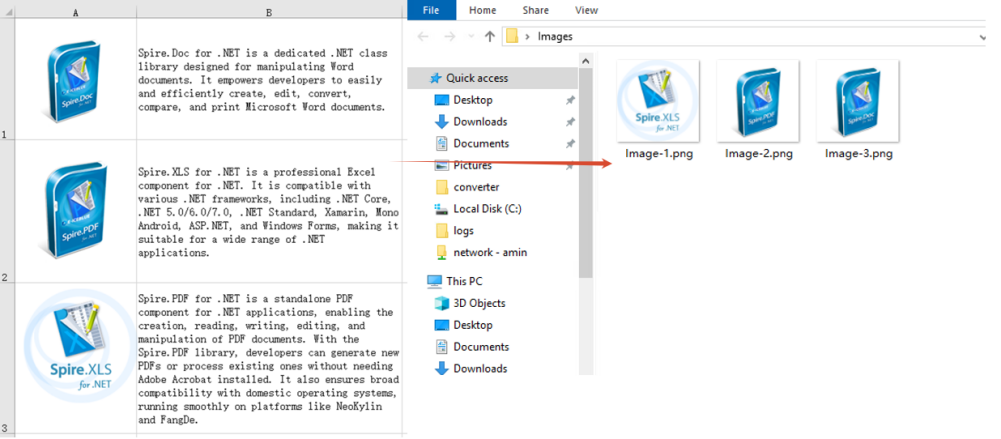
Batch-extracting all images from a worksheet is useful for backing up embedded images in reports, migrating product materials, and similar scenarios. The process consists of three steps: iterate over the Worksheet.Pictures collection, call the Picture.Save method on each image to save it to the VFS, then read each file and trigger a browser download.
function App() {
  const extractAllImages = async () => {
    // Get the Spire.XLS WASM module
    const xlsModule = window.wasmModule?.spirexls;

    // Check if the module is ready
    if (!xlsModule) {
      alert('Spire.Xls is not ready yet');
      return;
    }

    // Load the Excel file into VFS
    const inputFileName = 'ReadImages.xlsx';
    await window.spire.FetchFileToVFS(inputFileName, '', `${process.env.PUBLIC_URL}data/`);

    // Load the workbook and get the first worksheet
    const workbook = new xlsModule.Workbook();
    workbook.LoadFromFile({ fileName: inputFileName });
    const sheet = workbook.Worksheets.get(0);

    // Iterate through all pictures in the worksheet and export each one
    for (let i = 0; i < sheet.Pictures.Count; i++) {
      const pic = sheet.Pictures.get(i);
      const outputFileName = `Image-${i + 1}.png`;
      pic.Picture.Save(outputFileName);

      // Read the exported image file from VFS and trigger download
      const fileArray = window.dotnetRuntime.Module.FS.readFile(outputFileName);
      const blob = new Blob([fileArray], { type: "image/png" });
      const url = URL.createObjectURL(blob);
      const a = document.createElement('a');
      a.href = url;
      a.download = outputFileName;
      a.click();
      URL.revokeObjectURL(url);
    }

    // Release resources
    workbook.Dispose();
  };

  return (
    <div style={{ textAlign: 'center', height: '300px' }}>
      <h1>Extract All Images from Worksheet</h1>
      <button onClick={extractAllImages}>
        Extract All Images
      </button>
    </div>
  );
}

export default App;
Image files extracted and downloaded from the worksheet in batch
Extract a Specific Image
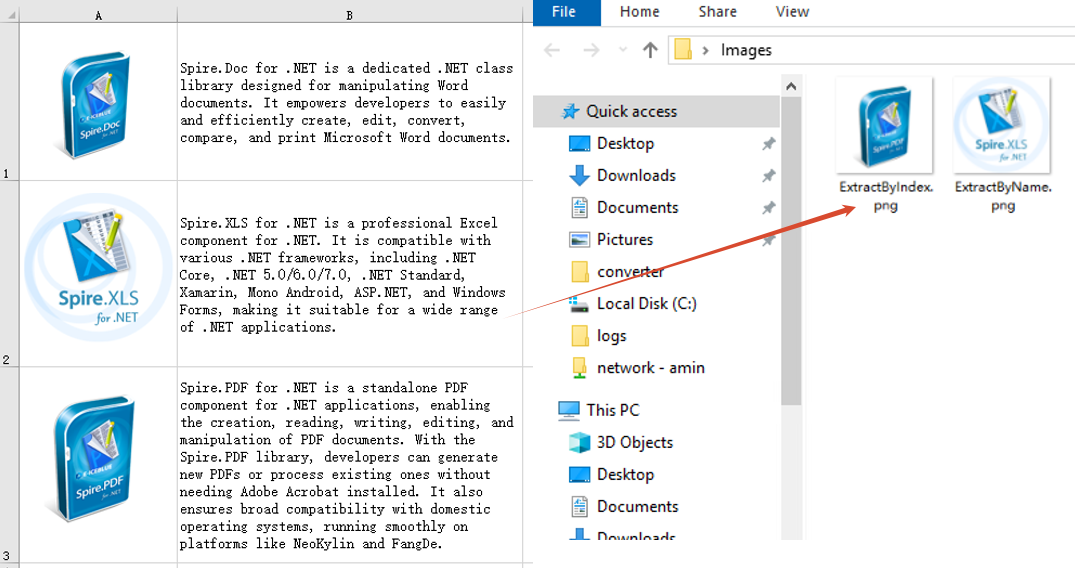
There are two common ways to extract a specific image from a worksheet: retrieve it directly by index, or iterate through pictures by name to find a match. The index approach suits scenarios where the picture position is known (for example, the first picture), while the name approach is better when you know the picture identifier in advance. The process consists of two steps: first locate the target image by index or name, then export it as a local file.
function App() {
  const extractImage = async () => {
    // Get the Spire.XLS WASM module
    const xlsModule = window.wasmModule?.spirexls;

    if (!xlsModule) {
      alert('Spire.Xls is not ready yet');
      return;
    }

    // Load the Excel file into VFS
    const inputFileName = 'ReadImages.xlsx';
    await window.spire.FetchFileToVFS(inputFileName, '', `${process.env.PUBLIC_URL}data/`);

    // Load the workbook and get the first worksheet
    const workbook = new xlsModule.Workbook();
    workbook.LoadFromFile({ fileName: inputFileName });
    const sheet = workbook.Worksheets.get(0);

    // Method 1: Extract by index (e.g., extract the second picture)
    const pic = sheet.Pictures.get(1);
    const outputFileName = 'ExtractByIndex.png';

    // // Method 2: Iterate through pictures by name to find a match
    // let pic = null;
    // const targetName = 'SpireXLS';
    // for (let i = 0; i < sheet.Pictures.Count; i++) {
    //   if (sheet.Pictures.get(i).Name === targetName) {
    //     pic = sheet.Pictures.get(i);
    //     break;
    //   }
    // }
    // const outputFileName = 'ExtractByName.png';

    // Save the picture to VFS and trigger download
    pic.Picture.Save(outputFileName);
    const fileArray = window.dotnetRuntime.Module.FS.readFile(outputFileName);
    const blob = new Blob([fileArray], { type: "image/png" });
    const url = URL.createObjectURL(blob);
    const a = document.createElement('a');
    a.href = url;
    a.download = outputFileName;
    a.click();
    URL.revokeObjectURL(url);

    workbook.Dispose();
  };

  return (
    <div style={{ textAlign: 'center', height: '300px' }}>
      <h1>Extract a Specific Image</h1>
      <button onClick={extractImage}>
        Extract Image
      </button>
    </div>
  );
}

export default App;
Specific image extracted and downloaded by index or name
Replace an Existing Image in a Worksheet
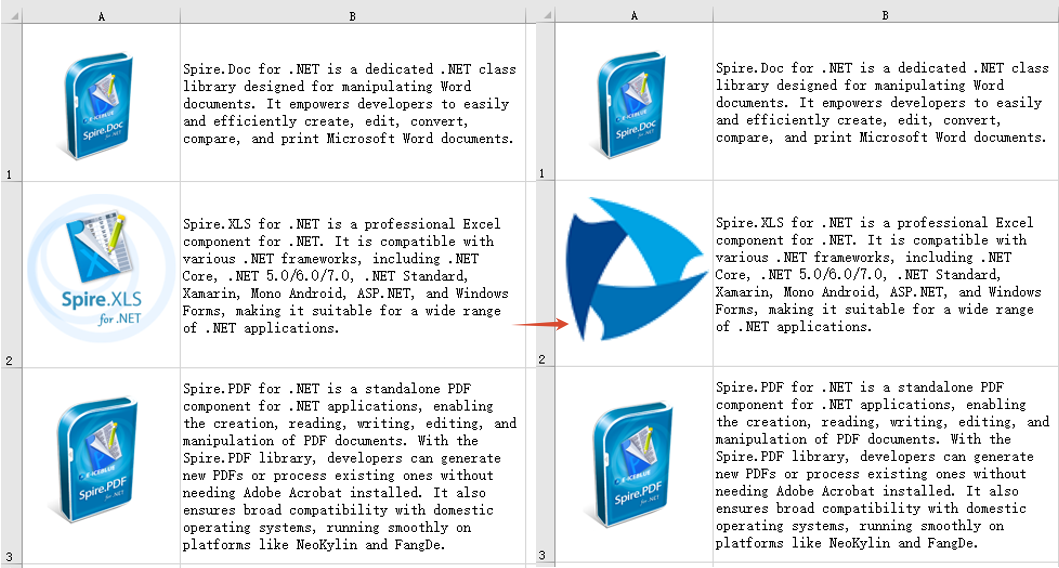
Replacing an existing image in a worksheet is a common requirement when updating report logos, changing product display images, and in similar scenarios. The approach is to first retrieve the position and size information of the target image, then delete it via XlsShape.Convert, and finally insert a new image at the same position, setting the new image's size and offsets to match the original.
function App() {
  const replaceImage = async () => {
    // Get the Spire.XLS WASM module
    const xlsModule = window.wasmModule?.spirexls;

    // Check if the module is ready
    if (!xlsModule) {
      alert('Spire.Xls is not ready yet');
      return;
    }

    // Load the Excel file and the new image into VFS
    const inputFileName = 'ReadImages.xlsx';
    await window.spire.FetchFileToVFS(inputFileName, '', `${process.env.PUBLIC_URL}data/`);
    const newImageFile = 'Logo.png';
    await window.spire.FetchFileToVFS(newImageFile, '', `${process.env.PUBLIC_URL}data/`);

    // Load the workbook and get the first worksheet
    const workbook = new xlsModule.Workbook();
    workbook.LoadFromFile({ fileName: inputFileName });
    const sheet = workbook.Worksheets.get(0);

    // Get the first picture and its position and size information
    const oldPic = sheet.Pictures.get(0);
    const topRow = oldPic.TopRow;
    const leftColumn = oldPic.LeftColumn;
    const leftColumnOffset = oldPic.LeftColumnOffset;
    const topRowOffset = oldPic.TopRowOffset;
    const width = oldPic.Width;
    const height = oldPic.Height;

    // Delete the original picture
    xlsModule.XlsShape.Convert(oldPic).Remove();

    // Insert the new picture at the same position
    let picture = sheet.Pictures.Add({ topRow: topRow, leftColumn: leftColumn, fileName: newImageFile });

    // Set the new picture's size and offsets to match the original
    picture.Width = width;
    picture.Height = height;
    picture.LeftColumnOffset = leftColumnOffset;
    picture.TopRowOffset = topRowOffset;

    const outputFileName = 'ReplaceImage-out.xlsx';
    // Save the modified workbook
    workbook.SaveToFile({ fileName: outputFileName, version: xlsModule.ExcelVersion.Version2010 });
    // Release resources
    workbook.Dispose();

    // Read the generated file from VFS and trigger download
    const fileArray = window.dotnetRuntime.Module.FS.readFile(outputFileName);
    const blob = new Blob([fileArray], { type: "application/vnd.openxmlformats-officedocument.spreadsheetml.sheet" });
    const url = URL.createObjectURL(blob);
    const a = document.createElement('a');
    a.href = url;
    a.download = outputFileName;
    a.click();
    URL.revokeObjectURL(url);
  };

  return (
    <div style={{ textAlign: 'center', height: '300px' }}>
      <h1>Replace Image in Worksheet</h1>
      <button onClick={replaceImage}>
        Replace Image
      </button>
    </div>
  );
}

export default App;
The Excel worksheet after the image is replaced
FAQ
Extracted images cannot be opened or the format is incorrect
Cause: The correct file extension was not specified when saving the image, or the MIME type does not match the image format.
Solution: Make sure the file extension used in the Picture.Save method matches the actual image format. If the image is in PNG format, the file extension should be .png; if it is in JPEG format, use .jpg. The Blob type used for the download should be set accordingly:
// PNG format
const blob = new Blob([fileArray], { type: "image/png" });

// JPEG format
const blob = new Blob([fileArray], { type: "image/jpeg" });
The position or size of the image changes after replacement
Cause: The position and size properties of the original image were not recorded before deletion, so the new image cannot be precisely aligned to the original position or retain its original size.
Solution: Save the position properties such as TopRow, LeftColumn, LeftColumnOffset, TopRowOffset and the size properties Width, Height before deleting the image. After inserting the new image, set these properties on the new picture so it matches the original:
// Insert the new picture (specify the row and column position)
let picture = sheet.Pictures.Add({ topRow: topRow, leftColumn: leftColumn, fileName: newImageFile });

// Set size and offsets to match the original
picture.Width = width;
picture.Height = height;
picture.LeftColumnOffset = leftColumnOffset;
picture.TopRowOffset = topRowOffset;
Get a Free License
Spire.XLS for JavaScript offers a 30-day full-featured free trial license with no functional limitations. Apply here to evaluate before purchasing.
OFD (Open Fixed-layout Document) is a national standard fixed-layout document format widely used in e-invoices, e-certificates, administrative approvals, and other government and financial scenarios. OFD describes document structure based on XML, offering advantages such as independent control and information security. Meanwhile, PDF remains indispensable as an internationally recognized document format for cross-platform distribution. Real-world business often requires flexible switching between the two formats: receiving OFD-format e-invoices and converting them to PDF for printing and distribution, or converting existing PDF contracts to OFD to meet government platform upload requirements.
Spire.PDF for JavaScript performs bidirectional conversion between PDF and OFD entirely in the browser via WebAssembly, managing input and output files through a virtual file system (VFS) with no backend server required.
This article covers two core features:
For installation and project setup, refer to Integrating Spire.PDF for JavaScript in a React Project. The examples below assume Spire.PDF is installed and the WebAssembly module is initialized.
Convert PDF to OFD
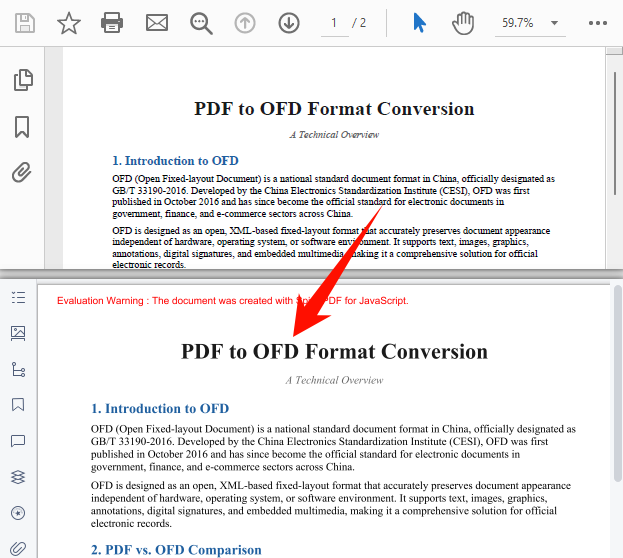
The core of PDF-to-OFD conversion is to re-encode the page content, fonts, and graphics elements from a PDF document into an XML description structure compliant with the OFD standard. Spire.PDF for JavaScript accomplishes this in one step through the PdfDocument object's SaveToFile method with the FileFormat.OFD enum value, eliminating the need to handle underlying format differences manually.
function App() {
  const convertToOFD = async () => {
    // Get the Spire.PDF WASM module
    const pdfModule = window.wasmModule?.spirepdf;

    // Check if the WASM module is ready
    if (!pdfModule) {
      alert('Spire.PDF is not ready yet');
      return;
    }

    // Load fonts and PDF file into VFS
    await window.spire.FetchFileToVFS('ARIAL.TTF', '/Library/Fonts/', `${process.env.PUBLIC_URL}/font/`);
    const inputFileName = 'TemplateIntroduction-en.pdf';
    await window.spire.FetchFileToVFS(inputFileName, "", `${process.env.PUBLIC_URL}/data/`);

    // Create PdfDocument object and load the PDF document
    let doc = new pdfModule.PdfDocument();
    doc.LoadFromFile(inputFileName);

    // Define the output file name for OFD format
    const outputFileName = 'OutputOFD.ofd';

    // Save as OFD format
    doc.SaveToFile({ fileName: outputFileName, fileFormat: pdfModule.FileFormat.OFD });
    doc.Close();

    // Read the converted file from VFS and trigger download
    const fileArray = window.dotnetRuntime.Module.FS.readFile(outputFileName);
    const blob = new Blob([fileArray], { type: 'application/ofd' });
    const url = URL.createObjectURL(blob);
    const a = document.createElement('a');
    a.href = url;
    a.download = outputFileName;
    a.click();
    URL.revokeObjectURL(url);
  };

  return (
    <div style={{ textAlign: 'center', height: '300px' }}>
      <h1>Convert PDF To OFD</h1>
      <button onClick={convertToOFD}>
        Generate
      </button>
    </div>
  );
}

export default App;
OFD output generated after conversion via SaveToFile with FileFormat.OFD
Convert OFD to PDF
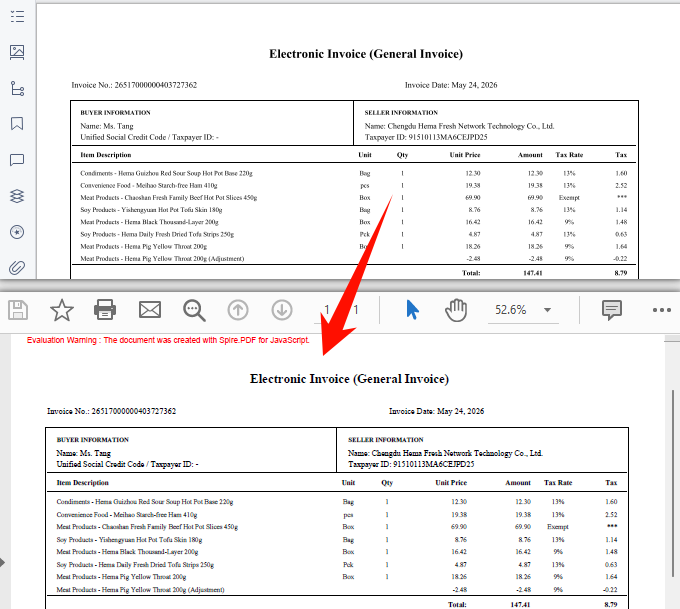
OFD-to-PDF conversion is a common requirement in government electronic document distribution scenarios. Spire.PDF for JavaScript provides the OfdConverter component, which is specifically designed to parse OFD fixed-layout documents and export them as standard PDF files while preserving the original document's layout and visual appearance.
function App() {
  const convertOFDToPDF = async () => {
    // Get the Spire.PDF WASM module
    const pdfModule = window.wasmModule?.spirepdf;

    // Check if the WASM module is ready
    if (!pdfModule) {
      alert('Spire.PDF is not ready yet');
      return;
    }

    // Load fonts and OFD file into VFS
    await window.spire.FetchFileToVFS('Arial.TTF', '/Library/Fonts/', `${process.env.PUBLIC_URL}/font/`);
    const inputFileName = 'Invoice_EN.ofd';
    await window.spire.FetchFileToVFS(inputFileName, "", `${process.env.PUBLIC_URL}/data/`);

    // Create OfdConverter object and pass the OFD file path
    let converter = new pdfModule.OfdConverter(inputFileName);

    // Define the output file name for PDF format
    const outputFileName = 'OutputPDF.pdf';

    // Convert to PDF format
    converter.ToPdf(outputFileName);
    converter.Dispose();

    // Read the converted file from VFS and trigger download
    const fileArray = window.dotnetRuntime.Module.FS.readFile(outputFileName);
    const blob = new Blob([fileArray], { type: 'application/pdf' });
    const url = URL.createObjectURL(blob);
    const a = document.createElement('a');
    a.href = url;
    a.download = outputFileName;
    a.click();
    URL.revokeObjectURL(url);
  };

  return (
    <div style={{ textAlign: 'center', height: '300px' }}>
      <h1>Convert OFD To PDF</h1>
      <button onClick={convertOFDToPDF}>
        Generate
      </button>
    </div>
  );
}

export default App;
Standard PDF output generated after conversion via OfdConverter
FAQ
Can encrypted PDFs be converted to OFD?
Password-protected encrypted PDFs cannot be saved as OFD directly via SaveToFile — the document must be decrypted first.
Solution: Provide the password when loading the PDF via the second parameter of LoadFromFile, then save as OFD:
// Load a password-protected PDF document
let doc = new pdfModule.PdfDocument();
doc.LoadFromFile(inputFileName, "password");

// Save as OFD format
doc.SaveToFile({ fileName: outputFileName, fileFormat: pdfModule.FileFormat.OFD });
doc.Close();
Garbled text in the converted OFD document
OFD relies on font embedding to ensure consistent cross-platform rendering. If the input PDF uses non-embedded fonts and the corresponding font files are not loaded in the VFS, text may appear garbled after conversion.
Solution: Make sure the required TrueType font files (e.g., ARIALUNI.TTF) are loaded into the /Library/Fonts/ directory in VFS before calling the conversion. ARIALUNI.TTF covers common CJK characters and is the recommended font for ensuring conversion quality.
Get a Free License
Spire.PDF for JavaScript offers a 30-day full-featured free trial license with no functional limitations. Apply here to evaluate before purchasing.
Data labels are an essential element of Excel charts for displaying detailed information about data points, such as values, series names, and category names. Spire.XLS for JavaScript runs entirely in the browser via WebAssembly, using a virtual file system (VFS) to manage input and output files — no backend server required. It provides a complete API for controlling data label display content, font formatting, number format, position, background, borders, and other appearance properties.
This article covers two core features:
For installation and project setup, refer to Integrating Spire.XLS for JavaScript in a React Project. The examples below assume Spire.XLS is installed and the WebAssembly module is initialized.
Set Data Label Content and Font
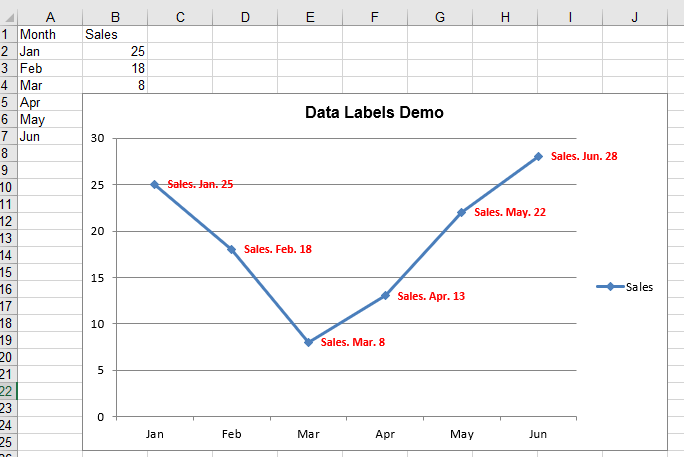
Data labels can display various types of information, including values, series names, category names, and legend keys. With Spire.XLS for JavaScript, you can flexibly control the display content of data labels and customize their font styles to make the chart information clearer and more readable. The steps are as follows:
- Create a
Workbookobject and get the default worksheet. - Populate the worksheet with category labels and numeric data for the chart.
- Add a chart using
sheet.Charts.Add()and set the chart type. - Configure the chart's data range, position, and title.
- Enable data label display content (values, series names, category names) via the
DataLabelsproperty. - Set data label font properties (font name, size, color, bold, etc.).
- Save the workbook to an Excel file using
SaveToFile().
Below is a complete code example demonstrating how to set chart data label content and font in React:
function App() {
  const setDataLabelContentAndFont = async () => {
    // Get the Spire.XLS WASM module
    const xlsModule = window.wasmModule?.spirexls;

    // Check if the module is ready
    if (!xlsModule) {
      alert('Spire.Xls is not ready yet');
      return;
    }

    // Create a new workbook and get the default worksheet
    const workbook = new xlsModule.Workbook();
    let sheet = workbook.Worksheets.get(0);
    sheet.Name = "DataLabelDemo";

    // Populate chart data
    sheet.Range.get("A1").Value = "Month";
    sheet.Range.get("A2").Value = "Jan";
    sheet.Range.get("A3").Value = "Feb";
    sheet.Range.get("A4").Value = "Mar";
    sheet.Range.get("A5").Value = "Apr";
    sheet.Range.get("A6").Value = "May";
    sheet.Range.get("A7").Value = "Jun";

    sheet.Range.get("B1").Value = "Sales";
    sheet.Range.get("B2").NumberValue = 25;
    sheet.Range.get("B3").NumberValue = 18;
    sheet.Range.get("B4").NumberValue = 8;
    sheet.Range.get("B5").NumberValue = 13;
    sheet.Range.get("B6").NumberValue = 22;
    sheet.Range.get("B7").NumberValue = 28;

    // Add a line chart and set its data range
    let chart = sheet.Charts.Add({ chartType: xlsModule.ExcelChartType.LineMarkers });
    chart.DataRange = sheet.Range.get("B1:B7");
    chart.SeriesDataFromRange = false;

    // Set the chart position
    chart.TopRow = 5;
    chart.BottomRow = 26;
    chart.LeftColumn = 2;
    chart.RightColumn = 11;

    // Configure chart title
    chart.ChartTitle = "Data Labels Demo";
    chart.ChartTitleArea.IsBold = true;
    chart.ChartTitleArea.Size = 12;

    // Bind category labels
    let cs1 = chart.Series.get(0);
    cs1.CategoryLabels = sheet.Range.get("A2:A7");

    // Set data label display content: show values, series names, and category names
    cs1.DataPoints.DefaultDataPoint.DataLabels.HasValue = true;
    cs1.DataPoints.DefaultDataPoint.DataLabels.HasSeriesName = true;
    cs1.DataPoints.DefaultDataPoint.DataLabels.HasCategoryName = true;

    // Set data label delimiter
    cs1.DataPoints.DefaultDataPoint.DataLabels.Delimiter = ". ";

    // Customize data label font styles
    cs1.DataPoints.DefaultDataPoint.DataLabels.Size = 9;
    cs1.DataPoints.DefaultDataPoint.DataLabels.Color = xlsModule.Color.get_Red();
    cs1.DataPoints.DefaultDataPoint.DataLabels.FontName = "Calibri";
    cs1.DataPoints.DefaultDataPoint.DataLabels.IsBold = true;

    // Save the workbook
    const outputFileName = 'DataLabelContentAndFont.xlsx';
    workbook.SaveToFile(outputFileName);
    workbook.Dispose();

    // Read the file from VFS and trigger download
    const fileArray = window.dotnetRuntime.Module.FS.readFile(outputFileName);
    const blob = new Blob([fileArray], { type: 'application/vnd.openxmlformats-officedocument.spreadsheetml.sheet' });
    const url = URL.createObjectURL(blob);
    const a = document.createElement('a');
    a.href = url;
    a.download = outputFileName;
    a.click();
    URL.revokeObjectURL(url);
  };

  return (
    <div style={{ textAlign: 'center', height: '300px' }}>
      <h1>Set Data Label Content and Font</h1>
      <button onClick={setDataLabelContentAndFont}>
        Generate
      </button>
    </div>
  );
}

export default App;
Data label content and font set with Spire.XLS for JavaScript
Adjust Data Label Position and Appearance
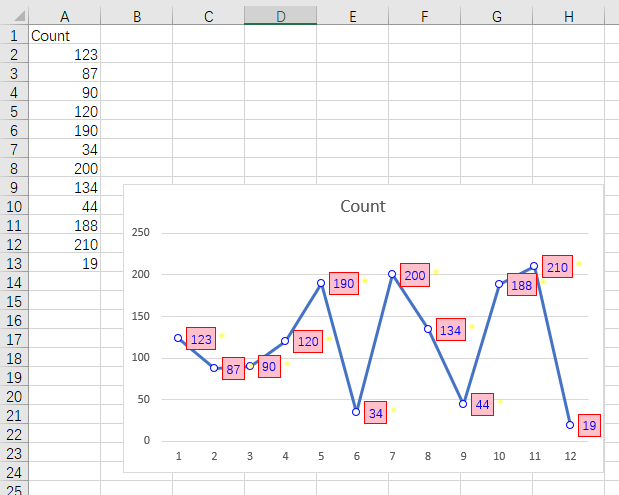
Beyond display content and font styles, the position and appearance of data labels are also important aspects of chart visual enhancement. Spire.XLS for JavaScript supports adjusting the display position of data labels through the DataLabelPositionType enumeration, and allows you to set fill colors, border styles, and shadow effects for data labels. The steps are as follows:
- Create a
Workbookobject and load an existing Excel file containing a chart. - Get the worksheet via
workbook.Worksheets.get(). - Get the chart object using
sheet.Charts.get(). - Iterate through the chart's data series and set the data label position using
DataLabels.Position. - Set a background fill color for the data labels via
FrameFormat.Fill. - Set border color and style for the data labels via
FrameFormat.Border. - Add shadow effects to data labels via
FrameFormat.Shadow(type, color, transparency, size, blur, angle, and distance). - Save the workbook to an Excel file using
SaveToFile().
Below is a complete code example demonstrating how to adjust chart data label position and appearance in React:
function App() {
  const setDataLabelPositionAndAppearance = async () => {
    // Get the Spire.XLS WASM module
    const xlsModule = window.wasmModule?.spirexls;

    // Check if the module is ready
    if (!xlsModule) {
      alert('Spire.Xls is not ready yet');
      return;
    }

    // Load the sample file into the virtual file system (VFS)
    let excelFileName = 'SampleChart.xlsx';
    await window.spire.FetchFileToVFS(excelFileName, '', `${process.env.PUBLIC_URL}data/`);

    // Create a workbook object and load the existing file
    const workbook = new xlsModule.Workbook();
    workbook.LoadFromFile({ fileName: excelFileName });

    // Get the first worksheet
    let sheet = workbook.Worksheets.get(0);

    // Get the first chart
    let chart = sheet.Charts.get(0);

    // Iterate through all data series and adjust data label position and appearance
    for (let i = 0; i < chart.Series.Count; i++) {
      let cs = chart.Series.get(i);
      // Set data point marker style and size to make data points more prominent
      cs.DataFormat.MarkerSize = 6;
      cs.DataFormat.MarkerStyle = xlsModule.ChartMarkerType.Circle;
      cs.DataFormat.MarkerForegroundColor = xlsModule.Color.get_Blue();
      cs.DataFormat.MarkerBackgroundColor = xlsModule.Color.get_White();

      let dataLabels = cs.DataPoints.DefaultDataPoint.DataLabels;

      // Enable value labels
      dataLabels.HasValue = true;

      // Set data label position
      dataLabels.Position = xlsModule.DataLabelPositionType.Right;

      // Set data label font color and size
      dataLabels.Color = xlsModule.Color.get_Blue();
      dataLabels.Size = 10;

      // Set pink fill background
      dataLabels.FrameFormat.Fill.FillType = xlsModule.ShapeFillType.SolidColor;
      dataLabels.FrameFormat.ForeGroundColor = xlsModule.Color.get_Pink();

      // Set red border
      dataLabels.FrameFormat.Border.Pattern = xlsModule.ChartLinePatternType.Solid;
      dataLabels.FrameFormat.Border.Color = xlsModule.Color.get_Red();

      // Set yellow shadow effect
      dataLabels.FrameFormat.Shadow.ShadowOuterType = xlsModule.XLSXChartShadowOuterType.OffsetDiagonalBottomLeft;
      dataLabels.FrameFormat.Shadow.Color = xlsModule.Color.get_Yellow();
      dataLabels.FrameFormat.Shadow.Transparency = 0;
      dataLabels.FrameFormat.Shadow.Size = 10;
      dataLabels.FrameFormat.Shadow.Blur = 2;
      dataLabels.FrameFormat.Shadow.Angle = 45;
      dataLabels.FrameFormat.Shadow.Distance = 8;
    }

    // Save the workbook
    const outputFileName = 'DataLabelPositionAndAppearance.xlsx';
    workbook.SaveToFile(outputFileName);
    workbook.Dispose();

    // Read the file from VFS and trigger download
    const fileArray = window.dotnetRuntime.Module.FS.readFile(outputFileName);
    const blob = new Blob([fileArray], { type: 'application/vnd.openxmlformats-officedocument.spreadsheetml.sheet' });
    const url = URL.createObjectURL(blob);
    const a = document.createElement('a');
    a.href = url;
    a.download = outputFileName;
    a.click();
    URL.revokeObjectURL(url);
  };

  return (
    <div style={{ textAlign: 'center', height: '300px' }}>
      <h1>Set Data Label Position and Appearance</h1>
      <button onClick={setDataLabelPositionAndAppearance}>
        Generate
      </button>
    </div>
  );
}

export default App;
Data label position and appearance adjusted with Spire.XLS for JavaScript
FAQ
How to modify the label content of a specific data point instead of the entire series?
Cause: DefaultDataPoint.DataLabels applies to all data points in a series and cannot control individual data points separately.
Solution: Use DataPoints.get(index) to access a specific data point and set its label:
// Modify the label text of the third data point
chart.Series.get(0).DataPoints.get(2).DataLabels.Text = "Peak";
chart.Series.get(0).DataPoints.get(2).DataLabels.HasValue = false;
How to set number format for data labels (decimal places, currency symbols)
Cause: The number format of data labels matches the cell format by default, but sometimes needs to be controlled independently.
Solution: Use the DataLabels.NumberFormat property to customize the number format:
// Show two decimal places
dataLabels.NumberFormat = "0.00";
// Display as percentage
dataLabels.NumberFormat = "0.0%";
// Display with currency symbol
dataLabels.NumberFormat = "$#,##0";
Get a Free License
Spire.XLS for JavaScript offers a 30-day full-featured free trial license with no functional limitations. Apply here to evaluate before purchasing.
Convert Excel to TXT or TXT to Excel with JavaScript in React
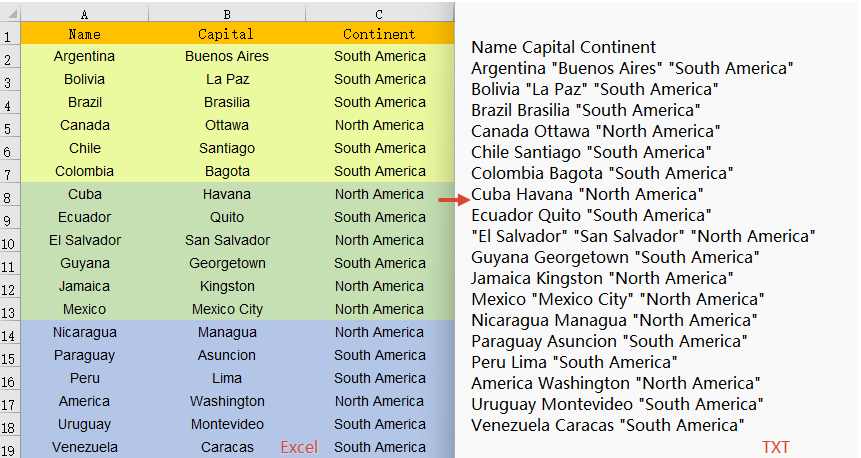
2026-08-03 02:29:40 Written by jie zouIn daily office work, data often needs to be exchanged between Excel spreadsheets and plain text (TXT) files. Spire.XLS for JavaScript runs entirely in the browser via WebAssembly, using a virtual file system (VFS) to manage input and output files — no backend server is required. It provides flexible APIs for controlling conversion parameters such as delimiters and encoding formats.
With Spire.XLS for JavaScript, you can export Excel worksheet data as structured text files, or import delimited text files to create fully formatted Excel workbooks. This makes data migration between different applications more convenient and efficient.
This article covers two core features:
For installation and project setup, refer to Integrating Spire.XLS for JavaScript in a React Project. The examples below assume Spire.XLS is installed and the WebAssembly module is initialized.
Convert Excel Worksheet Data to TXT
Exporting Excel data as a plain text file makes it convenient for further processing or analysis in other applications. With Spire.XLS for JavaScript, you can save the contents of a specified worksheet as a TXT file, with flexible control over the field separator and character encoding. The steps are as follows:
- Create a
Workbookobject and load an existing Excel file. - Retrieve a specific worksheet via
workbook.Worksheets.get(index). - Call the worksheet's
SaveToFile()method, specifying the output filename, separator, and encoding. - Dispose of the workbook resources, read the result file from VFS, and trigger the download.
Below is a complete code example demonstrating how to convert Excel to TXT in React:
function App() {
  const convertToText = async () => {
    // Get the Spire.XLS WASM module
    const xlsModule = window.wasmModule?.spirexls;

    // Check if the module is ready
    if (!xlsModule) {
      alert('Spire.Xls is not ready yet');
      return;
    }

    // Load the sample file into VFS
    await window.spire.FetchFileToVFS('Sample.xlsx', '', `${process.env.PUBLIC_URL}data/`);

    // Create a workbook object and load the Excel file
    const workbook = new xlsModule.Workbook();
    workbook.LoadFromFile({ fileName: 'Sample.xlsx' });

    // Get the first worksheet
    let sheet = workbook.Worksheets.get(0);

    // Save the worksheet as a TXT file with space separator and UTF-8 encoding
    const outputFileName = 'ExcelToTxt.txt';
    sheet.SaveToFile({
      fileName: outputFileName,
      separator: " ",
      encoding: xlsModule.Encoding.get_UTF8()
    });
    workbook.Dispose();

    // Read the file from VFS and trigger download
    const fileArray = window.dotnetRuntime.Module.FS.readFile(outputFileName);
    const blob = new Blob([fileArray], { type: 'text/plain' });
    const url = URL.createObjectURL(blob);
    const a = document.createElement('a');
    a.href = url;
    a.download = outputFileName;
    a.click();
    URL.revokeObjectURL(url);
  };

  return (
    <div style={{ textAlign: 'center', height: '300px' }}>
      <h1>Convert Excel to TXT</h1>
      <button onClick={convertToText}>
        Generate
      </button>
    </div>
  );
}

export default App;
Excel converted to TXT with Spire.XLS for JavaScript
Convert TXT File to Excel Workbook
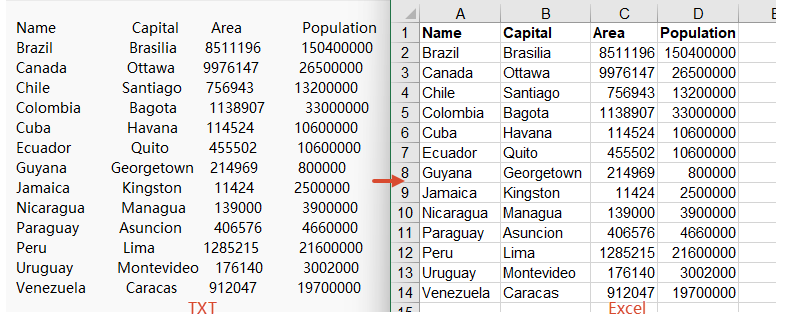
Importing a delimited text file into an Excel spreadsheet allows you to take full advantage of Excel's formatting, calculation, and charting capabilities. Spire.XLS for JavaScript supports TXT-to-Excel conversion by reading the text file content and writing data to the workbook cell by cell. Formatting such as bold headers can also be applied during the process. The steps are as follows:
- Load the font file and TXT sample file into the VFS.
- Read the TXT file content from VFS, split it by lines, and parse the cell data for each line.
- Create a
Workbookobject, iterate through the data array, and write data to worksheet cells row by row and column by column. - Apply bold styling to the header row and call
AllocatedRange.AutoFitColumns()to auto-fit column widths. - Save the workbook as an Excel file and trigger the download.
Below is a complete code example demonstrating how to convert TXT to Excel in React:
function App() {
  const convertToExcel = async () => {
    // Get the Spire.XLS WASM module
    const xlsModule = window.wasmModule?.spirexls;

    // Check if the module is ready
    if (!xlsModule) {
      alert('Spire.Xls is not ready yet');
      return;
    }

    // Load the font file to ensure proper text rendering
    await window.spire.FetchFileToVFS('ARIAL.TTF', '', `${process.env.PUBLIC_URL}font/`);

    // Load the TXT file into VFS
    await window.spire.FetchFileToVFS('Sample.txt', '', `${process.env.PUBLIC_URL}data/`);

    // Read the text file content from VFS
    const txtData = window.dotnetRuntime.Module.FS.readFile('Sample.txt');
    const text = typeof txtData === 'string' ? txtData : new TextDecoder('utf-8').decode(txtData);

    // Split by lines, compatible with \r\n and \n
    const lines = text.trim().split(/\r?\n/);

    // Parse each line of data (try tab delimiter first, then fallback to other delimiters)
    const data = [];
    for (const line of lines) {
      const trimmed = line.trim();
      if (!trimmed) continue;
      let cells = trimmed.split('\t');
      if (cells.length === 1) {
        cells = trimmed.split(/\s+/);
      }
      data.push(cells);
    }

    // Create a Workbook object
    const workbook = new xlsModule.Workbook();

    // Get the first worksheet
    const sheet = workbook.Worksheets.get(0);

    // Iterate through rows and columns in the data array and write to cells
    for (let row = 0; row < data.length; row++) {
      for (let col = 0; col < data[row].length; col++) {
        const cell = sheet.get_Item(row + 1, col + 1);
        cell.Value = data[row][col];
        // Bold the header row
        if (row === 0) {
          cell.Style.Font.IsBold = true;
        }
      }
    }

    // Auto-fit column widths
    sheet.AllocatedRange.AutoFitColumns();

    // Save the workbook and release resources
    const outputFileName = 'TxtToExcel.xlsx';
    workbook.SaveToFile({ fileName: outputFileName, version: xlsModule.ExcelVersion.Version2010 });
    workbook.Dispose();

    // Read the file from VFS and trigger download
    const fileArray = window.dotnetRuntime.Module.FS.readFile(outputFileName);
    const blob = new Blob([fileArray], { type: 'application/vnd.openxmlformats-officedocument.spreadsheetml.sheet' });
    const url = URL.createObjectURL(blob);
    const a = document.createElement('a');
    a.href = url;
    a.download = outputFileName;
    a.click();
    URL.revokeObjectURL(url);
  };

  return (
    <div style={{ textAlign: 'center', height: '300px' }}>
      <h1>Convert TXT to Excel</h1>
      <button onClick={convertToExcel}>
        Generate
      </button>
    </div>
  );
}

export default App;
TXT converted to Excel with Spire.XLS for JavaScript
FAQ
How to handle encoding issues during conversion?
Cause: The TXT file in this example uses UTF-8 encoding. If the TXT file uses a different encoding format (such as GBK, GB2312, etc.), decoding it directly with TextDecoder('utf-8') will result in garbled text.
Solution: Specify the corresponding encoding type in the TextDecoder constructor parameter based on the actual encoding of the TXT file:
// UTF-8 encoding
const text = new TextDecoder('utf-8').decode(txtData);

// GBK encoding
const text = new TextDecoder('gbk').decode(txtData);

// GB2312 encoding
const text = new TextDecoder('gb2312').decode(txtData);

// UTF-16 encoding
const text = new TextDecoder('utf-16').decode(txtData);
How to handle TXT files with different delimiters?
Cause: TXT files may use different delimiters such as tabs (\t), spaces, commas (,), semicolons (;), etc. Choosing the wrong delimiter can lead to data parsing errors.
Solution: In JavaScript, you can specify different delimiters by modifying the parameter of the split() method:
// Tab delimiter
let cells = trimmed.split('\t');

// Comma delimiter
let cells = trimmed.split(',');

// Semicolon delimiter
let cells = trimmed.split(';');

// Regular expression: split by one or more whitespace characters (spaces, tabs, etc.)
let cells = trimmed.split(/\s+/);
Get a Free License
Spire.XLS for JavaScript offers a 30-day full-featured free trial license with no functional limitations. Apply here to evaluate before purchasing.
Hide or Unhide Excel Rows and Columns with JavaScript in React
2026-08-03 02:25:05 Written by jie zouHiding and unhiding rows and columns is a common feature in daily office work. It helps protect sensitive information, simplify data views, or temporarily conceal unnecessary data. Spire.XLS for JavaScript runs entirely in the browser via WebAssembly, using a virtual file system (VFS) to manage input and output files — no backend server required. It provides a simple API for controlling the visibility of rows and columns.
This article covers four core features:
- Hide Specific Rows and Columns in Excel
- Unhide Specific Rows and Columns in Excel
- Hide Multiple Rows and Columns at Once in Excel
- Unhide All Hidden Rows and Columns in Excel
For installation and project setup, refer to Integrating Spire.XLS for JavaScript in a React Project. The examples below assume Spire.XLS is installed and the WebAssembly module is initialized.
Hide Specific Rows and Columns in Excel
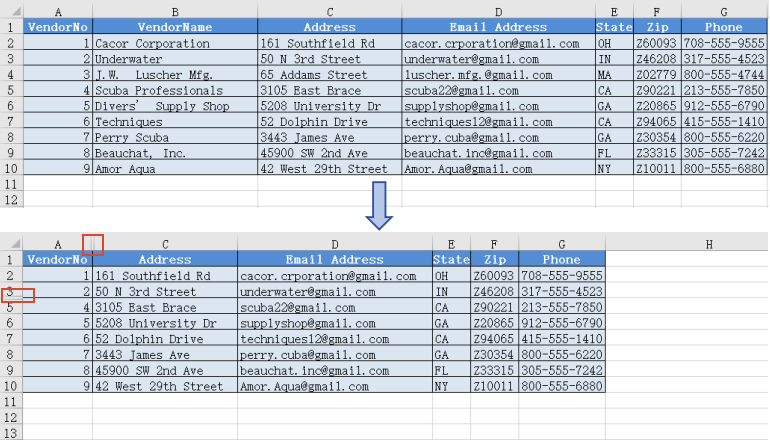
Hiding specific rows and columns can keep your worksheet cleaner and more readable without compromising data integrity. Spire.XLS for JavaScript supports hiding a specific row or column using the HideRow() and HideColumn() methods. The steps are as follows:
- Create a
Workbookobject and load an existing Excel file containing data. - Use
worksheet.HideRow()to hide a specific row. - Use
worksheet.HideColumn()to hide a specific column. - Save the workbook to an Excel file using
SaveToFile().
Below is a complete code example demonstrating how to hide specific rows and columns in Excel in React:
function App() {
  const hideSpecificRowsAndColumns = async () => {
    // Get the Spire.XLS WASM module
    const xlsModule = window.wasmModule?.spirexls;

    // Check if the module is ready
    if (!xlsModule) {
      alert('Spire.Xls is not ready yet');
      return;
    }

    // Load the sample file into the virtual file system (VFS)
    let excelFileName = 'Sample.xlsx';
    await window.spire.FetchFileToVFS(excelFileName, '', `${process.env.PUBLIC_URL}data/`);

    // Create a workbook object and load the existing file
    const workbook = new xlsModule.Workbook();
    workbook.LoadFromFile({ fileName: excelFileName });
    let sheet = workbook.Worksheets.get(0);

    // Hide a specific row (row 4)
    sheet.HideRow(4);

    // Hide a specific column (column 2, i.e., column B)
    sheet.HideColumn(2);

    // Save the workbook
    const outputFileName = 'HideSpecificRowsColumns.xlsx';
    workbook.SaveToFile(outputFileName);
    workbook.Dispose();

    // Read the file from VFS and trigger download
    const fileArray = window.dotnetRuntime.Module.FS.readFile(outputFileName);
    const blob = new Blob([fileArray], { type: 'application/vnd.openxmlformats-officedocument.spreadsheetml.sheet' });
    const url = URL.createObjectURL(blob);
    const a = document.createElement('a');
    a.href = url;
    a.download = outputFileName;
    a.click();
    URL.revokeObjectURL(url);
  };

  return (
    <div style={{ textAlign: 'center', height: '300px' }}>
      <h1>Hide Specific Rows and Columns</h1>
      <button onClick={hideSpecificRowsAndColumns}>
        Generate
      </button>
    </div>
  );
}

export default App;
Specific rows and columns hidden with Spire.XLS for JavaScript
Unhide Specific Rows and Columns in Excel
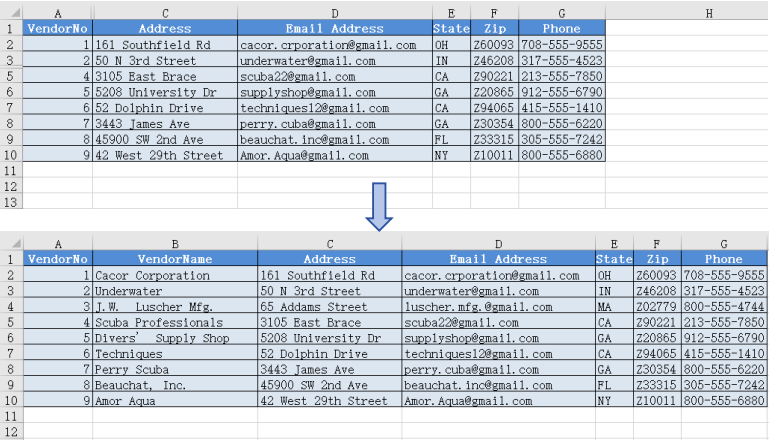
When you need to view or edit specific hidden data, you can unhide a particular row or column individually. Spire.XLS for JavaScript supports unhiding a specific row or column using the ShowRow() and ShowColumn() methods. The steps are as follows:
- Create a
Workbookobject and load an existing Excel file containing hidden rows/columns. - Use
sheet.ShowRow()to unhide a specific row. - Use
sheet.ShowColumn()to unhide a specific column. - Save the workbook to an Excel file using
SaveToFile().
Below is a complete code example demonstrating how to unhide specific rows and columns in Excel in React:
function App() {
  const unhideSpecificRowsAndColumns = async () => {
    // Get the Spire.XLS WASM module
    const xlsModule = window.wasmModule?.spirexls;

    // Check if the module is ready
    if (!xlsModule) {
      alert('Spire.Xls is not ready yet');
      return;
    }

    // Load the sample file into the virtual file system (VFS)
    let excelFileName = 'HideSpecificRowsColumns.xlsx';
    await window.spire.FetchFileToVFS(excelFileName, '', `${process.env.PUBLIC_URL}data/`);

    // Create a workbook object and load the existing file
    const workbook = new xlsModule.Workbook();
    workbook.LoadFromFile({ fileName: excelFileName });

    // Get the first worksheet
    let sheet = workbook.Worksheets.get(0);

    // Unhide a specific row (row 4)
    sheet.ShowRow(4);

    // Unhide a specific column (column 2, i.e., column B)
    sheet.ShowColumn(2);

    // Save the workbook
    const outputFileName = 'UnhideSpecificRowsColumns.xlsx';
    workbook.SaveToFile(outputFileName);
    workbook.Dispose();

    // Read the file from VFS and trigger download
    const fileArray = window.dotnetRuntime.Module.FS.readFile(outputFileName);
    const blob = new Blob([fileArray], { type: 'application/vnd.openxmlformats-officedocument.spreadsheetml.sheet' });
    const url = URL.createObjectURL(blob);
    const a = document.createElement('a');
    a.href = url;
    a.download = outputFileName;
    a.click();
    URL.revokeObjectURL(url);
  };

  return (
    <div style={{ textAlign: 'center', height: '300px' }}>
      <h1>Unhide Specific Rows and Columns</h1>
      <button onClick={unhideSpecificRowsAndColumns}>
        Generate
      </button>
    </div>
  );
}

export default App;
Specific rows and columns unhidden with Spire.XLS for JavaScript
Hide Multiple Rows and Columns at Once in Excel
When there are multiple rows or columns that you don't need to display, hiding them one by one is inefficient. Spire.XLS for JavaScript supports hiding multiple rows and columns at once through loops, greatly improving operational efficiency. The steps are as follows:
- Create a
Workbookobject and load an existing Excel file containing data. - Use a loop to call
worksheet.HideRow()to hide multiple rows at once. - Use a loop to call
worksheet.HideColumn()to hide multiple columns at once. - Save the workbook to an Excel file using
SaveToFile().
Below is a complete code example demonstrating how to hide multiple rows and columns at once in Excel in React:
function App() {
  const hideMultipleRowsAndColumns = async () => {
    // Get the Spire.XLS WASM module
    const xlsModule = window.wasmModule?.spirexls;

    // Check if the module is ready
    if (!xlsModule) {
      alert('Spire.Xls is not ready yet');
      return;
    }

    // Load the sample file into the virtual file system (VFS)
    let excelFileName = 'Sample.xlsx';
    await window.spire.FetchFileToVFS(excelFileName, '', `${process.env.PUBLIC_URL}data/`);

    // Create a workbook object and load the existing file
    const workbook = new xlsModule.Workbook();
    workbook.LoadFromFile({ fileName: excelFileName });
    let sheet = workbook.Worksheets.get(0);

    // Hide multiple rows at once (rows 6 through 10)
    for (let i = 6; i <= 10; i++) {
      sheet.HideRow(i);
    }

    // Hide multiple columns at once (columns 4 through 5, i.e., columns D to E)
    for (let j = 4; j <= 5; j++) {
      sheet.HideColumn(j);
    }

    // Save the workbook
    const outputFileName = 'HideMultipleRowsColumns.xlsx';
    workbook.SaveToFile(outputFileName);
    workbook.Dispose();

    // Read the file from VFS and trigger download
    const fileArray = window.dotnetRuntime.Module.FS.readFile(outputFileName);
    const blob = new Blob([fileArray], { type: 'application/vnd.openxmlformats-officedocument.spreadsheetml.sheet' });
    const url = URL.createObjectURL(blob);
    const a = document.createElement('a');
    a.href = url;
    a.download = outputFileName;
    a.click();
    URL.revokeObjectURL(url);
  };

  return (
    <div style={{ textAlign: 'center', height: '300px' }}>
      <h1>Hide Multiple Rows and Columns</h1>
      <button onClick={hideMultipleRowsAndColumns}>
        Generate
      </button>
    </div>
  );
}

export default App;
Multiple rows and columns hidden at once with Spire.XLS for JavaScript
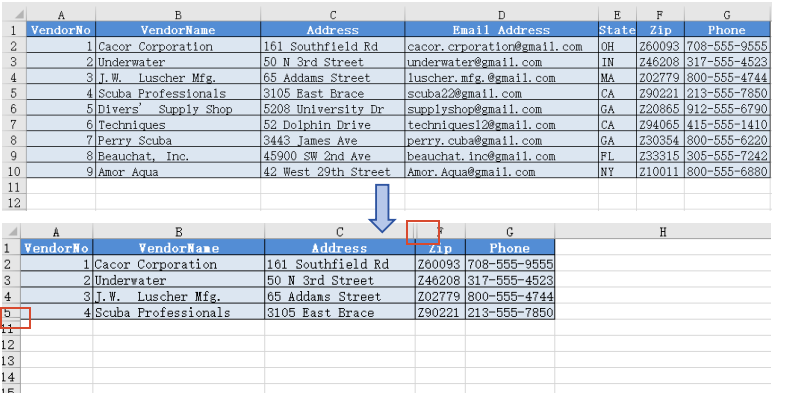
Unhide All Hidden Rows and Columns in Excel
To unhide all hidden rows and columns, iterate through the rows and columns in the worksheet, use GetRowIsHide() and GetColumnIsHide() to find hidden ones, then call ShowRow() and ShowColumn() to unhide them. The steps are as follows:
- Create a
Workbookobject and load the Excel file. - Get the worksheet.
- Iterate through rows, use
GetRowIsHide()to find hidden rows, useShowRow()to unhide. - Iterate through columns, use
GetColumnIsHide()to find hidden columns, useShowColumn()to unhide. - Save the result file using
SaveToFile().
Below is a complete code example demonstrating how to unhide all hidden rows and columns in Excel in React:
function App() {
  const unhideAllRowsAndColumns = async () => {
    // Get the Spire.XLS WASM module
    const xlsModule = window.wasmModule?.spirexls;

    // Check if the module is ready
    if (!xlsModule) {
      alert('Spire.Xls is not ready yet');
      return;
    }

    // Load the sample file into the virtual file system (VFS)
    let excelFileName = 'HideMultipleRowsColumns.xlsx';
    await window.spire.FetchFileToVFS(excelFileName, '', `${process.env.PUBLIC_URL}data/`);

    // Create a workbook object and load the existing file
    const workbook = new xlsModule.Workbook();
    workbook.LoadFromFile({ fileName: excelFileName });

    // Get the first worksheet
    let sheet = workbook.Worksheets.get(0);

    for (let i = 1; i <= sheet.Rows.length; i++) {
      if (sheet.GetRowIsHide(i)) {
        // Unhide row
        sheet.ShowRow(i);
      }
    }

    for (let j = 1; j <= sheet.Columns.length; j++) {
      if (sheet.GetColumnIsHide(j)) {
        // Unhide column
        sheet.ShowColumn(j);
      }
    }

    // Save the workbook
    const outputFileName = 'UnhideAllRowsColumns.xlsx';
    workbook.SaveToFile(outputFileName);
    workbook.Dispose();

    // Read the file from VFS and trigger download
    const fileArray = window.dotnetRuntime.Module.FS.readFile(outputFileName);
    const blob = new Blob([fileArray], { type: 'application/vnd.openxmlformats-officedocument.spreadsheetml.sheet' });
    const url = URL.createObjectURL(blob);
    const a = document.createElement('a');
    a.href = url;
    a.download = outputFileName;
    a.click();
    URL.revokeObjectURL(url);
  };

  return (
    <div style={{ textAlign: 'center', height: '300px' }}>
      <h1>Unhide All Rows and Columns</h1>
      <button onClick={unhideAllRowsAndColumns}>
        Generate
      </button>
    </div>
  );
}

export default App;
All hidden rows and columns unhidden with Spire.XLS for JavaScript
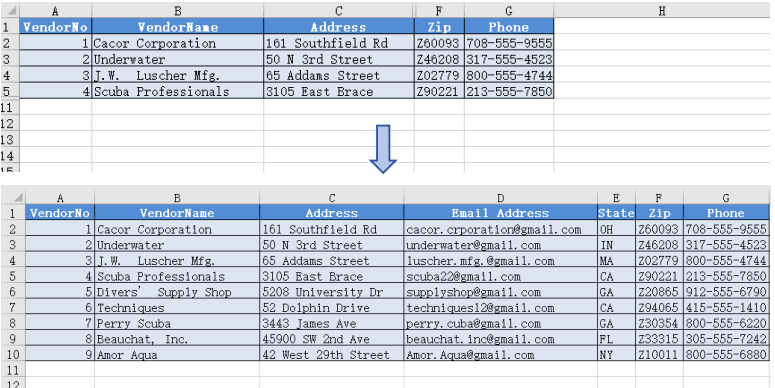
FAQ
How to check whether a row or column is hidden?
Solution: Use the GetRowIsHide() and GetColumnIsHide() methods to check:
// Check if row 3 is hidden
let rowIsHidden = sheet.GetRowIsHide(3);

// Check if column 2 (column B) is hidden
let columnIsHidden = sheet.GetColumnIsHide(2);
Are row heights or column widths preserved after hiding?
Solution: When hiding rows or columns, the original row height and column width values are preserved. After unhiding with ShowRow() or ShowColumn(), the original dimensions are automatically restored without any additional configuration.
Get a Free License
Spire.XLS for JavaScript offers a 30-day full-featured free trial license with no functional limitations. Apply here to evaluate before purchasing.
Read or Delete Excel Document Properties with JavaScript in React
2026-08-03 02:20:33 Written by jie zouExcel document properties — such as title, author, category, and other metadata — are essential for file management and information retrieval. Spire.XLS for JavaScript runs entirely in the browser via WebAssembly, using a virtual file system (VFS) to manage input and output files. It provides a complete API for accessing and managing both DocumentProperties (standard/built-in properties) and CustomDocumentProperties (user-defined name-value pairs).
Spire.XLS categorizes document properties into two types: standard and custom. Standard document properties are predefined built-in metadata like title, subject, author, category, keywords, and comments. Custom document properties are user-defined name-value pairs that can contain text, numbers, dates, or boolean values.
This article covers two core features:
For installation and project setup, refer to Integrating Spire.XLS for JavaScript in a React Project. The examples below assume Spire.XLS is installed and the WebAssembly module is initialized.
Read Standard and Custom Document Properties
Reading document properties is the first step in understanding an Excel file's metadata. Through the DocumentProperties and CustomDocumentProperties collections, you can easily access all property information stored in the file. The steps are as follows:
- Create a
Workbookobject and load an existing Excel file. - Retrieve the standard document properties collection via
workbook.DocumentProperties. - Iterate through the
DocumentPropertiescollection to read each property's name and value. - Retrieve the custom document properties collection via
workbook.CustomDocumentProperties. - Iterate through the
CustomDocumentPropertiescollection to read each custom property's name and value. - Output the retrieved property information to a text file.
Below is a complete code example demonstrating how to read Excel document properties in React:
function App() {
  const readDocumentProperties = async () => {
    // Get the Spire.XLS WASM module
    const xlsModule = window.wasmModule?.spirexls;

    // Check if the module is ready
    if (!xlsModule) {
      alert('Spire.Xls is not ready yet');
      return;
    }

    // Load the sample file into VFS
    await window.spire.FetchFileToVFS('Sample.xlsx', '', `${process.env.PUBLIC_URL}data/`);

    const workbook = new xlsModule.Workbook();
    workbook.LoadFromFile({ fileName: 'Sample.xlsx' });

    // Get standard document properties
    let properties1 = workbook.DocumentProperties;
    let sb = [];
    sb.push("Excel Properties:");
    for (let i = 0; i < properties1.Count; i++) {
      let name = properties1.get(i).Name;
      let obj = properties1.get(i).Value;
      let t = properties1.get(i).PropertyType;
      let value = null;
      if (t === xlsModule.PropertyType.Double) {
        value = xlsModule.Double.Convert(obj).Value;
      } else if (t === xlsModule.PropertyType.DateTime) {
        // Convert OADate to JavaScript Date and format as date string
        let oaDate = xlsModule.DateTime.Convert(obj).Value;
        let jsDate = new Date((oaDate - 25569) * 86400 * 1000);
        value = jsDate.toLocaleDateString();
      } else if (t === xlsModule.PropertyType.Bool) {
        value = xlsModule.Boolean.Convert(obj).Value;
      } else if (
        t === xlsModule.PropertyType.Int ||
        t === xlsModule.PropertyType.Int32
      ) {
        value = xlsModule.Int32.Convert(obj).Value;
      } else {
        value = xlsModule.String.Convert(obj).Value;
      }
      sb.push(name + ": " + String(value));
    }
    sb.push("");

    // Get custom document properties
    let properties2 = workbook.CustomDocumentProperties;
    sb.push("Custom Properties:");
    for (let i = 0; i < properties2.Count; i++) {
      let name = properties2.get(i).Name;
      let t = properties2.get(i).PropertyType;
      let obj = properties2.get(i).Value;
      let value = null;
      if (t === xlsModule.PropertyType.Double) {
        value = xlsModule.Double.Convert(obj).Value;
      } else if (t === xlsModule.PropertyType.DateTime) {
        // Convert OADate to JavaScript Date and format as date string
        let oaDate = xlsModule.DateTime.Convert(obj).Value;
        let jsDate = new Date((oaDate - 25569) * 86400 * 1000);
        value = jsDate.toLocaleDateString();
      } else if (t === xlsModule.PropertyType.Bool) {
        value = xlsModule.Boolean.Convert(obj).Value;
      } else if (
        t === xlsModule.PropertyType.Int ||
        t === xlsModule.PropertyType.Int32
      ) {
        value = xlsModule.Int32.Convert(obj).Value;
      } else {
        value = xlsModule.String.Convert(obj).Value;
      }
      sb.push(name + ": " + String(value));
    }

    // Save the property information to a text file
    const outputFileName = 'DocumentProperties.txt';
    window.dotnetRuntime.Module.FS.writeFile(outputFileName, sb.join("\n"));
    workbook.Dispose();

    // Read the file from VFS and trigger download
    const fileArray = window.dotnetRuntime.Module.FS.readFile(outputFileName);
    const blob = new Blob([fileArray], { type: 'text/plain' });
    const url = URL.createObjectURL(blob);
    const a = document.createElement('a');
    a.href = url;
    a.download = outputFileName;
    a.click();
    URL.revokeObjectURL(url);
  };

  return (
    <div style={{ textAlign: 'center', height: '300px' }}>
      <h1>Read Excel Document Properties</h1>
      <button onClick={readDocumentProperties}>
        Generate
      </button>
    </div>
  );
}

export default App;
Document properties read with Spire.XLS for JavaScript
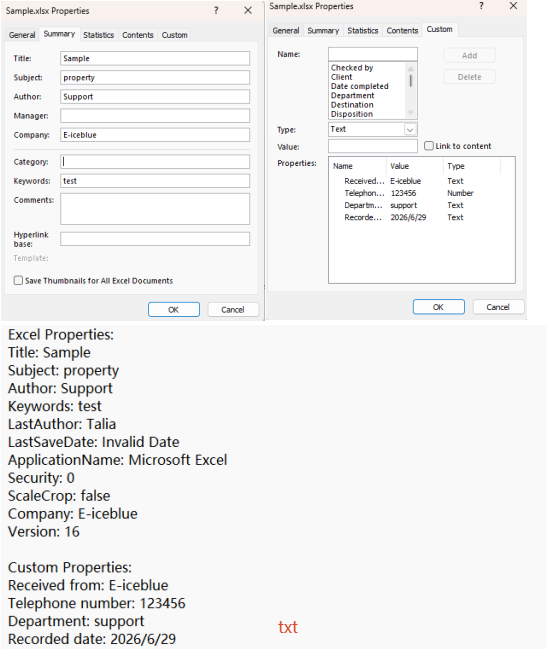
Delete Standard and Custom Document Properties
In some scenarios, you may need to clear sensitive or outdated metadata from Excel files. Spire.XLS for JavaScript allows you to delete both standard and custom document properties through straightforward API calls. The steps are as follows:
- Create a
Workbookobject and load an existing Excel file. - Retrieve the standard document properties collection via
workbook.DocumentProperties. - Clear standard properties by setting their values to empty strings.
- Retrieve the custom document properties collection via
workbook.CustomDocumentProperties. - Iterate through the collection and use the
Remove()method to delete each custom property. - Save the modified workbook to a new Excel file.
Below is a complete code example demonstrating how to delete Excel document properties in React:
function App() {
  const deleteDocumentProperties = async () => {
    // Get the Spire.XLS WASM module
    const xlsModule = window.wasmModule?.spirexls;

    // Check if the module is ready
    if (!xlsModule) {
      alert('Spire.Xls is not ready yet');
      return;
    }

    // Load the sample file into VFS
    await window.spire.FetchFileToVFS('Sample.xlsx', '', `${process.env.PUBLIC_URL}data/`);

    const workbook = new xlsModule.Workbook();
    workbook.LoadFromFile({ fileName: 'Sample.xlsx' });

    // Get the standard document properties collection and clear their values
    let standardProperties = workbook.DocumentProperties;
    standardProperties.Title = "";
    standardProperties.Subject = "";
    standardProperties.Manager = "";
    standardProperties.Category = "";
    standardProperties.Keywords = "";
    standardProperties.Comments = "";
    standardProperties.Author = "";
    standardProperties.Company = "";

    // Get the custom document properties collection, iterate and remove all properties
    let customProperties = workbook.CustomDocumentProperties;
    for (let i = customProperties.Count - 1; i >= 0; i--) {
      customProperties.Remove(customProperties.get(i).Name);
    }

    // Save the workbook
    const outputFileName = 'DeleteProperties.xlsx';
    workbook.SaveToFile(outputFileName);
    workbook.Dispose();

    // Read the file from VFS and trigger download
    const fileArray = window.dotnetRuntime.Module.FS.readFile(outputFileName);
    const blob = new Blob([fileArray], { type: 'application/vnd.openxmlformats-officedocument.spreadsheetml.sheet' });
    const url = URL.createObjectURL(blob);
    const a = document.createElement('a');
    a.href = url;
    a.download = outputFileName;
    a.click();
    URL.revokeObjectURL(url);
  };

  return (
    <div style={{ textAlign: 'center', height: '300px' }}>
      <h1>Delete Excel Document Properties</h1>
      <button onClick={deleteDocumentProperties}>
        Generate
      </button>
    </div>
  );
}

export default App;
Document properties deleted with Spire.XLS for JavaScript
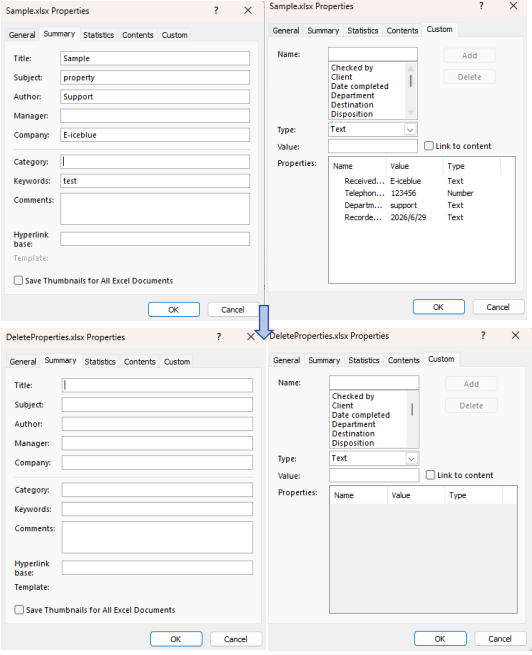
FAQ
Why can't standard document properties be removed using Remove() like custom properties?
Cause: Standard document properties are part of the Excel file structure, each with a fixed definition position that cannot be removed from the collection.
Solution: Clear standard properties by setting their values to empty strings instead of removing the properties themselves:
standardProperties.Title = "";
standardProperties.Author = "";
Custom properties can be directly deleted using the Remove() method.
How to handle reading non-text property types such as dates, booleans, and numbers?
Cause: Using String.Convert() directly on date or boolean properties may produce results in an unexpected format.
Solution: Check the PropertyType to determine the type and use the appropriate conversion method:
if (t === xlsModule.PropertyType.DateTime) {
  let oaDate = xlsModule.DateTime.Convert(obj).Value;
  let jsDate = new Date((oaDate - 25569) * 86400 * 1000);
  value = jsDate.toLocaleDateString();
} else if (t === xlsModule.PropertyType.Bool) {
  value = xlsModule.Boolean.Convert(obj).Value;
}
Get a Free License
Spire.XLS for JavaScript offers a 30-day full-featured free trial license with no functional limitations. Apply here to evaluate before purchasing.
Copying data within Excel files while preserving formatting is a common requirement in web-based spreadsheet applications. Spire.XLS for JavaScript runs entirely in the browser via WebAssembly, using a virtual file system (VFS) to manage input and output files — no backend server required. It provides comprehensive APIs to copy rows, columns, and cell ranges while keeping the original styles, fonts, colors, and other formatting intact.
This article covers three core features:
For installation and project setup, refer to Integrating Spire.XLS for JavaScript in a React Project. The examples below assume Spire.XLS is installed and the WebAssembly module is initialized.
Copy Rows in Excel
With Spire.XLS for JavaScript, you can copy rows within the same worksheet or across different worksheets while preserving all formatting, formulas, and styles. This is useful when you need to duplicate structured data such as headers, summary rows, or formatted templates. Through the CopyRangeOptions parameter, you can flexibly configure copy options such as copying all formats, conditional formatting, data validation, or only formula result values. The steps are as follows:
- Create a
Workbookobject and load an existing Excel file. - Get the source and destination worksheets via
workbook.Worksheets.get(). - Get the row to copy via
sheet.Rows[index]. - Use
sheet.Copy()with the source row, destination worksheet, destination row index, andCopyRangeOptions.Allto copy the row and its formatting. - Copy the column widths from the source row cells to the corresponding destination row cells.
- Save the workbook to an Excel file using
SaveToFile().
Below is a complete code example demonstrating how to copy rows in React:
function App() {
  const copyRows = async () => {
    // Get the Spire.XLS WASM module
    const xlsModule = window.wasmModule?.spirexls;

    // Check if the module is ready
    if (!xlsModule) {
      alert('Spire.Xls is not ready yet');
      return;
    }

    // Fetch the Excel file and add it to the Virtual File System (VFS)
    let excelFileName = 'Copying.xls';
    await window.spire.FetchFileToVFS(excelFileName, '', `${process.env.PUBLIC_URL}data/`);

    // Create a new workbook and load an existing file
    const workbook = new xlsModule.Workbook();
    workbook.LoadFromFile({ fileName: excelFileName });

    // Get the source and destination worksheets
    let sheet1 = workbook.Worksheets.get(0);
    let sheet2 = workbook.Worksheets.get(1);

    // Get the row to copy
    let row = sheet1.Rows[0];

    // Copy the row to the destination worksheet with all formatting
    sheet1.Copy({ sourceRange: row, destRange: sheet2.Rows[0], copyOptions: xlsModule.CopyRangeOptions.All });

    // Copy the column widths from source row to destination row
    let columns = sheet1.Columns.length;
    for (let i = 0; i < columns; i++) {
      let columnWidth = row.Columns[i].ColumnWidth;
      sheet2.Rows[0].Columns[i].ColumnWidth = columnWidth;
    }

    // Save the workbook
    const outputFileName = 'CopyRows_out.xlsx';
    workbook.SaveToFile({ fileName: outputFileName, version: xlsModule.ExcelVersion.Version2010 });
    workbook.Dispose();

    // Read the file from VFS and trigger download
    const fileArray = window.dotnetRuntime.Module.FS.readFile(outputFileName);
    const blob = new Blob([fileArray], { type: 'application/vnd.openxmlformats-officedocument.spreadsheetml.sheet' });
    const url = URL.createObjectURL(blob);
    const a = document.createElement('a');
    a.href = url;
    a.download = outputFileName;
    a.click();
    URL.revokeObjectURL(url);
  };

  return (
    <div style={{ textAlign: 'center', height: '300px' }}>
      <h1>Copy Excel Rows</h1>
      <button onClick={copyRows}>
        Generate
      </button>
    </div>
  );
}

export default App;
Row copy result
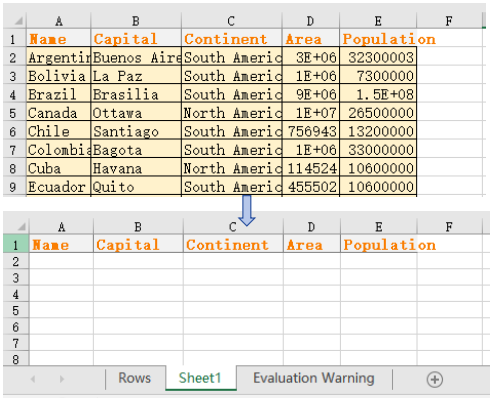
Copy Columns in Excel
Copying columns is equally straightforward with Spire.XLS for JavaScript. You can duplicate a column within the same worksheet or copy it to another sheet, and all cell styles, number formats, and data will be preserved. Through the CopyRangeOptions parameter, you can flexibly configure which elements to copy. This is particularly helpful for reorganizing spreadsheet layouts or replicating data structures. The steps are as follows:
- Create a
Workbookobject and load an existing Excel file. - Get the source and destination worksheets.
- Get the column to copy via
sheet.Columns[index]. - Use
sheet.Copy()with the source column, destination worksheet, destination column index, andCopyRangeOptions.Allto copy the column and its formatting. - Copy the column widths and row heights from the source column cells to the corresponding destination column cells.
- Save the workbook to an Excel file using
SaveToFile().
Below is a complete code example demonstrating how to copy columns in React:
function App() {
  const copyColumns = async () => {
    // Get the Spire.XLS WASM module
    const xlsModule = window.wasmModule?.spirexls;

    // Check if the module is ready
    if (!xlsModule) {
      alert('Spire.Xls is not ready yet');
      return;
    }

    // Fetch the Excel file and add it to the Virtual File System (VFS)
    let excelFileName = 'Copying.xls';
    await window.spire.FetchFileToVFS(excelFileName, '', `${process.env.PUBLIC_URL}data/`);

    // Create a new workbook and load an existing file
    const workbook = new xlsModule.Workbook();
    workbook.LoadFromFile({ fileName: excelFileName });

    // Get the source and destination worksheets
    let sheet1 = workbook.Worksheets.get(0);
    let sheet2 = workbook.Worksheets.get(1);

    // Get the column to copy
    let column = sheet1.Columns[0];

    // Copy the column to the destination worksheet with all formatting
    sheet1.Copy({ sourceRange: column, destRange: sheet2.Columns[0], copyOptions: xlsModule.CopyRangeOptions.All });

    // Copy the column width and row heights from source column to destination column
    sheet2.Columns[0].ColumnWidth = column.ColumnWidth;
    let rows = column.Rows.length;
    for (let i = 0; i < rows; i++) {
      let rowHeight = column.Rows[i].RowHeight;
      sheet2.Columns[0].Rows[i].RowHeight = rowHeight;
    }

    // Save the workbook
    const outputFileName = 'CopyColumns_out.xlsx';
    workbook.SaveToFile({ fileName: outputFileName, version: xlsModule.ExcelVersion.Version2010 });
    workbook.Dispose();

    // Read the file from VFS and trigger download
    const fileArray = window.dotnetRuntime.Module.FS.readFile(outputFileName);
    const blob = new Blob([fileArray], { type: 'application/vnd.openxmlformats-officedocument.spreadsheetml.sheet' });
    const url = URL.createObjectURL(blob);
    const a = document.createElement('a');
    a.href = url;
    a.download = outputFileName;
    a.click();
    URL.revokeObjectURL(url);
  };

  return (
    <div style={{ textAlign: 'center', height: '300px' }}>
      <h1>Copy Excel Columns</h1>
      <button onClick={copyColumns}>
        Generate
      </button>
    </div>
  );
}

export default App;
Column copy result
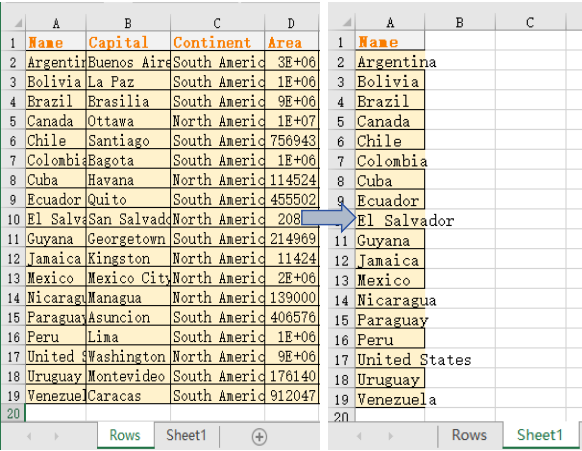
Copy Cells in Excel
Beyond copying entire rows and columns, Spire.XLS for JavaScript also allows you to copy specific cell ranges from one location to another while preserving all formatting. The CellRange.Copy() method provides this capability with flexible options. This gives you fine-grained control over which cells to duplicate. You can copy a range of cells within the same worksheet or to a different worksheet. The steps are as follows:
- Create a
Workbookobject and load an existing Excel file. - Get the source and destination worksheets.
- Get the source cell range and destination cell range via
sheet.Range.get(). - Use
sourceRange.Copy()with the destination range andCopyRangeOptions.Allto copy the cell range with all formatting. - Copy the column widths and row heights from the source range to the destination range.
- Save the workbook to an Excel file using
SaveToFile().
Below is a complete code example demonstrating how to copy cells in React:
function App() {
  const copyCells = async () => {
    // Get the Spire.XLS WASM module
    const xlsModule = window.wasmModule?.spirexls;

    // Check if the module is ready
    if (!xlsModule) {
      alert('Spire.Xls is not ready yet');
      return;
    }

    // Fetch the Excel file and add it to the Virtual File System (VFS)
    let excelFileName = 'Copying.xls';
    await window.spire.FetchFileToVFS(excelFileName, '', `${process.env.PUBLIC_URL}data/`);

    // Create a new workbook and load an existing file
    const workbook = new xlsModule.Workbook();
    workbook.LoadFromFile({ fileName: excelFileName });

    // Get the source and destination worksheets
    let sheet1 = workbook.Worksheets.get(0);
    let sheet2 = workbook.Worksheets.get(1);

    // Get the source cell range and destination cell range
    let range1 = sheet1.Range.get("A1:E7");
    let range2 = sheet2.Range.get("A1:E7");

    // Copy the source range to the destination range with all formatting
    range1.Copy({ destRange: range2, copyOptions: xlsModule.CopyRangeOptions.All });

    // Copy the row heights and column widths from source to destination
    for (let i = 0; i < range1.Rows.length; i++) {
      let row = range1.Rows[i];
      for (let j = 0; j < row.Columns.length; j++) {
        let column = row.Columns[j];
        range2.Rows[i].Columns[j].ColumnWidth = column.ColumnWidth;
        range2.Rows[i].RowHeight = row.RowHeight;
      }
    }

    // Save the workbook
    const outputFileName = 'CopyCells.xlsx';
    workbook.SaveToFile({ fileName: outputFileName, version: xlsModule.ExcelVersion.Version2010 });
    workbook.Dispose();

    // Read the file from VFS and trigger download
    const fileArray = window.dotnetRuntime.Module.FS.readFile(outputFileName);
    const blob = new Blob([fileArray], { type: 'application/vnd.openxmlformats-officedocument.spreadsheetml.sheet' });
    const url = URL.createObjectURL(blob);
    const a = document.createElement('a');
    a.href = url;
    a.download = outputFileName;
    a.click();
    URL.revokeObjectURL(url);
  };

  return (
    <div style={{ textAlign: 'center', height: '300px' }}>
      <h1>Copy Excel Cells</h1>
      <button onClick={copyCells}>
        Generate
      </button>
    </div>
  );
}

export default App;
Cell copy result
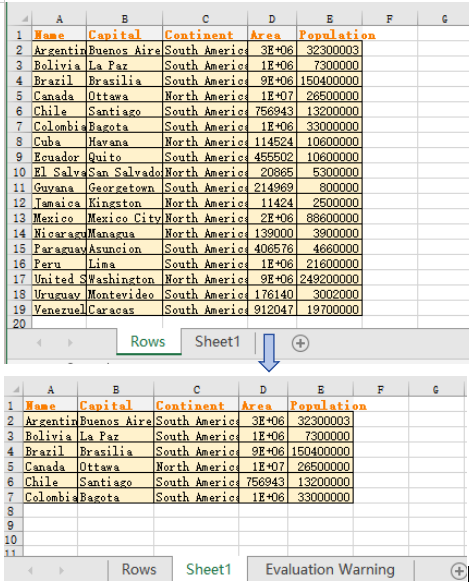
FAQ
What happens if the target location already contains data
Cause: By default, the Copy() method overwrites existing data at the target location without merging or preserving the original content.
Solution: Choose an empty area as the destination range, or check whether the target range is empty before performing the copy. You can also back up the target data first, then execute the copy operation.
Can I copy only values without formulas
Cause: CopyRangeOptions.All copies formulas themselves, but sometimes you only need the calculated result values without preserving the formula logic.
Solution: Use the CopyRangeOptions.OnlyCopyFormulaValue option to copy only the calculated result values, not the formulas themselves:
sourceRange.Copy({ destRange: destRange, copyOptions: xlsModule.CopyRangeOptions.OnlyCopyFormulaValue });
Get a Free License
Spire.XLS for JavaScript offers a 30-day full-featured free trial license with no functional limitations. Apply here to evaluate before purchasing.
Configuring page setup is essential for preparing Excel documents for printing or PDF export. Spire.XLS for JavaScript runs entirely in the browser via WebAssembly, using a virtual file system (VFS) to manage input and output files — no backend server required. It provides comprehensive page setup capabilities through the PageSetup object, allowing you to control margins, orientation, paper size, print area, zoom scaling, and fit-to-page options.
The PageSetup object in Spire.XLS offers a rich set of properties for controlling how a worksheet is printed or displayed. Key properties include:
| Property | Description |
|---|---|
| TopMargin / BottomMargin / LeftMargin / RightMargin | Sets the page margins |
| Orientation | Sets the page orientation (Portrait or Landscape) |
| PaperSize | Sets the paper size (A4, Letter, etc.) |
| PrintArea | Specifies the cell range to print |
| Zoom | Sets the worksheet zoom scaling percentage |
| FitToPagesTall / FitToPagesWide | Scales the worksheet to fit a specified number of pages |
This article covers six core features:
- Adjust Excel Page Margins
- Adjust Excel Page Orientation
- Adjust Excel Paper Size
- Adjust Excel Print Area
- Adjust Excel Zoom Scale
- Fit Excel Table to 1 Page
For installation and project setup, refer to Integrating Spire.XLS for JavaScript in a React Project. The examples below assume Spire.XLS is installed and the WebAssembly module is initialized.
Adjust Excel Page Margins
Page margins define the blank space around the edges of a printed worksheet. The steps are as follows:
- Create a
Workbookobject usingnew xlsModule.Workbook(). - Get the default worksheet using the
workbook.Worksheets.get(index)method. - Access the
PageSetupobject throughsheet.PageSetup. - Set page margins using the
TopMargin,BottomMargin,LeftMargin, andRightMarginproperties. - Save the workbook to an Excel file using the
workbook.SaveToFile()method.
Below is a complete code example demonstrating how to adjust page margins in React:
function App() {
  const adjustPageMargins = async () => {
    // Get the Spire.XLS WASM module
    const xlsModule = window.wasmModule?.spirexls;

    // Check if the module is ready
    if (!xlsModule) {
      alert('Spire.Xls is not ready yet');
      return;
    }

    // Create a workbook and load the existing file
    await window.spire.FetchFileToVFS('Sample.xlsx', '', `${process.env.PUBLIC_URL}data/`);

    const workbook = new xlsModule.Workbook();
    workbook.LoadFromFile({ fileName: 'Sample.xlsx' });
    const sheet = workbook.Worksheets.get(0);

    // Get the PageSetup object
    const pageSetup = sheet.PageSetup;

    // Set the top, bottom, left, right, header, and footer margins
    pageSetup.TopMargin = 1;
    pageSetup.BottomMargin = 1;
    pageSetup.LeftMargin = 0.75;
    pageSetup.RightMargin = 0.75;

    // Save the workbook
    const outputFileName = 'AdjustMargins.xlsx';
    workbook.SaveToFile(outputFileName);
    workbook.Dispose();

    // Read the file from VFS and trigger download
    const fileArray = window.dotnetRuntime.Module.FS.readFile(outputFileName);
    const blob = new Blob([fileArray], { type: 'application/vnd.openxmlformats-officedocument.spreadsheetml.sheet' });
    const url = URL.createObjectURL(blob);
    const a = document.createElement('a');
    a.href = url;
    a.download = outputFileName;
    a.click();
    URL.revokeObjectURL(url);
  };

  return (
    <div style={{ textAlign: 'center', height: '300px' }}>
      <h1>Adjust Page Margins</h1>
      <button onClick={adjustPageMargins}>
        Generate
      </button>
    </div>
  );
}

export default App;
Page margins adjusted with Spire.XLS for JavaScript
Adjust Excel Page Orientation
Page orientation determines whether a worksheet is printed in portrait (vertical) or landscape (horizontal) layout. Landscape orientation is especially useful for wide tables with many columns. The steps are as follows:
- Create a
Workbookobject usingnew xlsModule.Workbook(). - Get the default worksheet using the
workbook.Worksheets.get(index)method. - Access the
PageSetupobject throughsheet.PageSetup. - Set the page orientation using the
Orientationproperty. - Save the workbook to an Excel file using the
workbook.SaveToFile()method.
Below is a complete code example demonstrating how to set the page orientation to landscape in React:
function App() {
  const setPageOrientation = async () => {
    // Get the Spire.XLS WASM module
    const xlsModule = window.wasmModule?.spirexls;

    // Check if the module is ready
    if (!xlsModule) {
      alert('Spire.Xls is not ready yet');
      return;
    }

    // Create a workbook and load the existing file
    // Load the sample file into VFS
    await window.spire.FetchFileToVFS('Sample.xlsx', '', `${process.env.PUBLIC_URL}data/`);

    const workbook = new xlsModule.Workbook();
    workbook.LoadFromFile({ fileName: 'Sample.xlsx' });
    const sheet = workbook.Worksheets.get(0);

    // Set the page orientation to Landscape
    sheet.PageSetup.Orientation = xlsModule.PageOrientationType.Landscape;

    // Save the workbook
    const outputFileName = 'SetOrientation.xlsx';
    workbook.SaveToFile(outputFileName);
    workbook.Dispose();

    // Read the file from VFS and trigger download
    const fileArray = window.dotnetRuntime.Module.FS.readFile(outputFileName);
    const blob = new Blob([fileArray], { type: 'application/vnd.openxmlformats-officedocument.spreadsheetml.sheet' });
    const url = URL.createObjectURL(blob);
    const a = document.createElement('a');
    a.href = url;
    a.download = outputFileName;
    a.click();
    URL.revokeObjectURL(url);
  };

  return (
    <div style={{ textAlign: 'center', height: '300px' }}>
      <h1>Set Page Orientation</h1>
      <button onClick={setPageOrientation}>
        Generate
      </button>
    </div>
  );
}

export default App;
Page orientation set to landscape with Spire.XLS for JavaScript
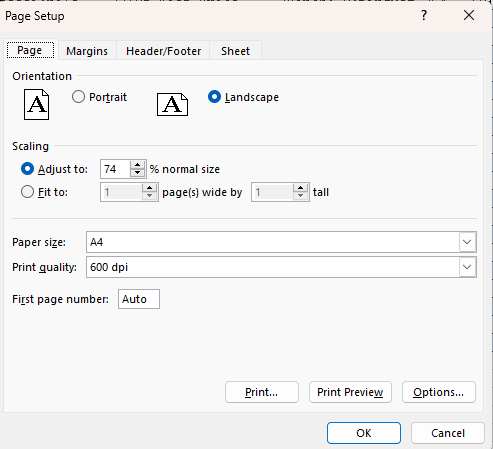
Adjust Excel Paper Size
Different printers and regions use different standard paper sizes. Spire.XLS for JavaScript supports a wide range of paper sizes through the PaperSizeType enumeration, including A4, Letter, A3, and many more. The steps are as follows:
- Create a
Workbookobject usingnew xlsModule.Workbook(). - Get the default worksheet using the
workbook.Worksheets.get(index)method. - Access the
PageSetupobject throughsheet.PageSetup. - Set the paper size using the
PaperSizeproperty. - Save the workbook to an Excel file using the
workbook.SaveToFile()method.
Below is a complete code example demonstrating how to set the paper size to A3 in React:
function App() {
  const setPaperSize = async () => {
    // Get the Spire.XLS WASM module
    const xlsModule = window.wasmModule?.spirexls;

    // Check if the module is ready
    if (!xlsModule) {
      alert('Spire.Xls is not ready yet');
      return;
    }

    // Create a workbook and load the existing file
    // Load the sample file into VFS
    await window.spire.FetchFileToVFS('Sample.xlsx', '', `${process.env.PUBLIC_URL}data/`);

    const workbook = new xlsModule.Workbook();
    workbook.LoadFromFile({ fileName: 'Sample.xlsx' });
    const sheet = workbook.Worksheets.get(0);

    // Get the PageSetup object
    const pageSetup = sheet.PageSetup;

    // Set the paper size to A3
    pageSetup.PaperSize = xlsModule.PaperSizeType.PaperA3;

    // Save the workbook
    const outputFileName = 'SetPaperSize.xlsx';
    workbook.SaveToFile(outputFileName);
    workbook.Dispose();

    // Read the file from VFS and trigger download
    const fileArray = window.dotnetRuntime.Module.FS.readFile(outputFileName);
    const blob = new Blob([fileArray], { type: 'application/vnd.openxmlformats-officedocument.spreadsheetml.sheet' });
    const url = URL.createObjectURL(blob);
    const a = document.createElement('a');
    a.href = url;
    a.download = outputFileName;
    a.click();
    URL.revokeObjectURL(url);
  };

  return (
    <div style={{ textAlign: 'center', height: '300px' }}>
      <h1>Set Paper Size</h1>
      <button onClick={setPaperSize}>
        Generate
      </button>
    </div>
  );
}

export default App;
Paper size set to A3 with Spire.XLS for JavaScript
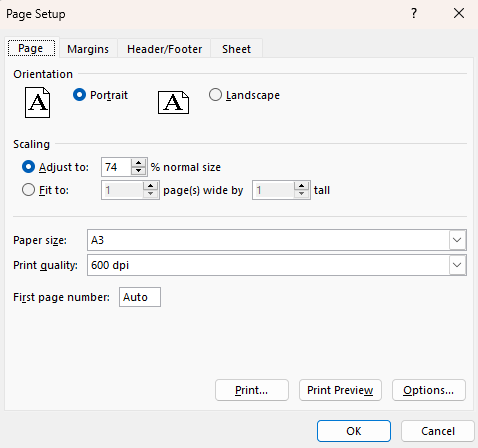
Adjust Excel Print Area
The print area defines which portion of a worksheet will be printed. The steps are as follows:
- Create a
Workbookobject usingnew xlsModule.Workbook(). - Get the default worksheet using the
workbook.Worksheets.get(index)method. - Populate sample data using the
sheet.Rangeproperty. - Access the
PageSetupobject throughsheet.PageSetup. - Set the print area using the
PrintAreaproperty. - Save the workbook to an Excel file using the
workbook.SaveToFile()method.
Below is a complete code example demonstrating how to set the print area in React:
function App() {
  const setPrintArea = async () => {
    // Get the Spire.XLS WASM module
    const xlsModule = window.wasmModule?.spirexls;

    // Check if the module is ready
    if (!xlsModule) {
      alert('Spire.Xls is not ready yet');
      return;
    }

    // Create a workbook and load the existing file
    // Load the sample file into VFS
    await window.spire.FetchFileToVFS('Sample.xlsx', '', `${process.env.PUBLIC_URL}data/`);

    const workbook = new xlsModule.Workbook();
    workbook.LoadFromFile({ fileName: 'Sample.xlsx' });
    const sheet = workbook.Worksheets.get(0);

    // Set the print area to A1:E3
    sheet.PageSetup.PrintArea = "A1:E3";

    // Save the workbook
    const outputFileName = 'SetPrintArea.xlsx';
    workbook.SaveToFile(outputFileName);
    workbook.Dispose();

    // Read the file from VFS and trigger download
    const fileArray = window.dotnetRuntime.Module.FS.readFile(outputFileName);
    const blob = new Blob([fileArray], { type: 'application/vnd.openxmlformats-officedocument.spreadsheetml.sheet' });
    const url = URL.createObjectURL(blob);
    const a = document.createElement('a');
    a.href = url;
    a.download = outputFileName;
    a.click();
    URL.revokeObjectURL(url);
  };

  return (
    <div style={{ textAlign: 'center', height: '300px' }}>
      <h1>Set Print Area</h1>
      <button onClick={setPrintArea}>
        Generate
      </button>
    </div>
  );
}

export default App;
Print area set with Spire.XLS for JavaScript
Adjust Excel Zoom Scale
The zoom scale controls the magnification level at which a worksheet is displayed on screen. The value ranges from 10 to 400, representing a percentage of normal size. The steps are as follows:
- Create a
Workbookobject usingnew xlsModule.Workbook(). - Get the default worksheet using the
workbook.Worksheets.get(index)method. - Set the zoom scale using the
Zoomproperty. - Save the workbook to an Excel file using the
workbook.SaveToFile()method.
Below is a complete code example demonstrating how to set the zoom scale in React:
function App() {
  const setZoomScale = async () => {
    // Get the Spire.XLS WASM module
    const xlsModule = window.wasmModule?.spirexls;

    // Check if the module is ready
    if (!xlsModule) {
      alert('Spire.Xls is not ready yet');
      return;
    }

    // Create a workbook and load the existing file
    // Load the sample file into VFS
    await window.spire.FetchFileToVFS('Sample.xlsx', '', `${process.env.PUBLIC_URL}data/`);

    const workbook = new xlsModule.Workbook();
    workbook.LoadFromFile({ fileName: 'Sample.xlsx' });
    const sheet = workbook.Worksheets.get(0);

    // Set the zoom scale to 85%
    const pageSetup = sheet.PageSetup;
    pageSetup.Zoom = 85;

    // Save the workbook
    const outputFileName = 'SetZoomScale.xlsx';
    workbook.SaveToFile(outputFileName);
    workbook.Dispose();

    // Read the file from VFS and trigger download
    const fileArray = window.dotnetRuntime.Module.FS.readFile(outputFileName);
    const blob = new Blob([fileArray], { type: 'application/vnd.openxmlformats-officedocument.spreadsheetml.sheet' });
    const url = URL.createObjectURL(blob);
    const a = document.createElement('a');
    a.href = url;
    a.download = outputFileName;
    a.click();
    URL.revokeObjectURL(url);
  };

  return (
    <div style={{ textAlign: 'center', height: '300px' }}>
      <h1>Set Zoom Scale</h1>
      <button onClick={setZoomScale}>
        Generate
      </button>
    </div>
  );
}

export default App;
Zoom scale set to 85% with Spire.XLS for JavaScript
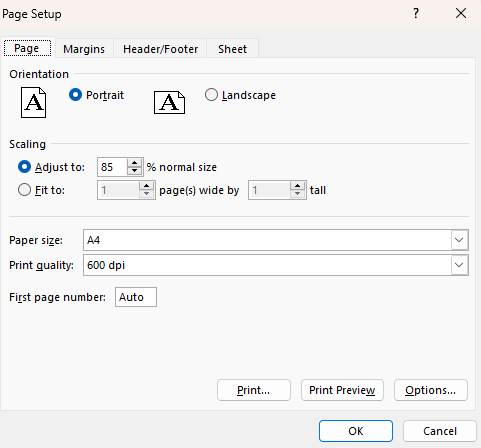
Fit Excel Table to 1 Page
When printing a large worksheet, the content may span multiple pages, making it difficult to read. The steps are as follows:
- Create a
Workbookobject usingnew xlsModule.Workbook(). - Get the default worksheet using the
workbook.Worksheets.get(index)method. - Populate sample data using the
sheet.Rangeproperty. - Access the
PageSetupobject throughsheet.PageSetup. - Set the fit-to-page properties using the
FitToPagesTallandFitToPagesWideproperties. - Save the workbook to an Excel file using the
workbook.SaveToFile()method.
Below is a complete code example demonstrating how to fit a worksheet to one page in React:
function App() {
  const fitToPage = async () => {
    // Get the Spire.XLS WASM module
    const xlsModule = window.wasmModule?.spirexls;

    // Check if the module is ready
    if (!xlsModule) {
      alert('Spire.Xls is not ready yet');
      return;
    }

    // Create a workbook and load the existing file
    // Load the sample file into VFS
    await window.spire.FetchFileToVFS('Sample.xlsx', '', `${process.env.PUBLIC_URL}data/`);

    const workbook = new xlsModule.Workbook();
    workbook.LoadFromFile({ fileName: 'Sample.xlsx' });
    const sheet = workbook.Worksheets.get(0);

    // Fit the worksheet content to 1 page
    const pageSetup = sheet.PageSetup;
    pageSetup.FitToPagesTall = 1;
    pageSetup.FitToPagesWide = 1;

    // Save the workbook
    const outputFileName = 'FitToPage.xlsx';
    workbook.SaveToFile(outputFileName);
    workbook.Dispose();

    // Read the file from VFS and trigger download
    const fileArray = window.dotnetRuntime.Module.FS.readFile(outputFileName);
    const blob = new Blob([fileArray], { type: 'application/vnd.openxmlformats-officedocument.spreadsheetml.sheet' });
    const url = URL.createObjectURL(blob);
    const a = document.createElement('a');
    a.href = url;
    a.download = outputFileName;
    a.click();
    URL.revokeObjectURL(url);
  };

  return (
    <div style={{ textAlign: 'center', height: '300px' }}>
      <h1>Fit Worksheet to 1 Page</h1>
      <button onClick={fitToPage}>
        Generate
      </button>
    </div>
  );
}

export default App;
Worksheet scaled to fit one page with Spire.XLS for JavaScript
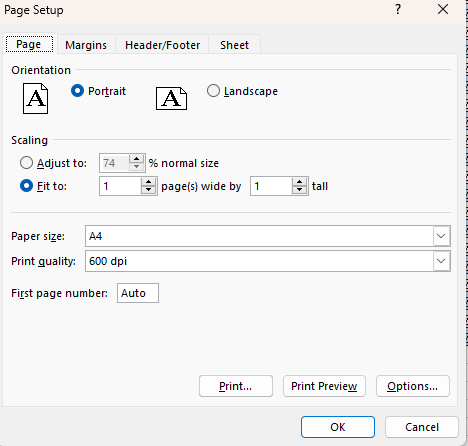
FAQ
How to print gridlines or row/column headings
Cause: By default, gridlines and row/column headings are not printed, which can make the data harder to read on paper.
Solution: Use the IsPrintGridlines and IsPrintHeadings properties of the PageSetup object:
pageSetup.IsPrintGridlines = true;
pageSetup.IsPrintHeadings = true;
How to get the actual page dimensions
Cause: You may need to know the actual width and height of the current paper size to adjust content layout.
Solution: Retrieve the values using the PageWidth and PageHeight properties of the PageSetup object:
var pageWidth = pageSetup.PageWidth;
var pageHeight = pageSetup.PageHeight;
Get a Free License
Spire.XLS for JavaScript offers a 30-day full-featured free trial license with no functional limitations. Apply here to evaluate before purchasing.
