
Knowledgebase (2345)
Children categories
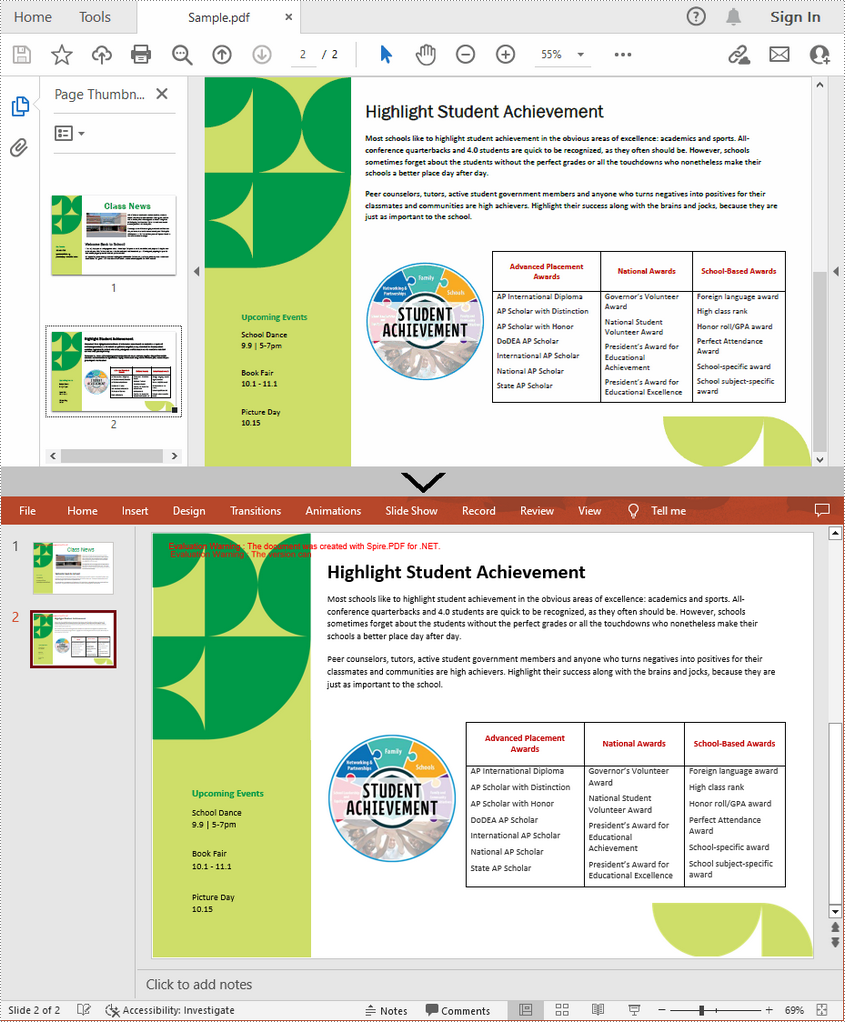
PDF files are great for presenting on different types of devices and sharing across platforms, but it has to admit that editing PDF is a bit challenging. When you receive a PDF file and need to prepare a presentation based on the content inside, it is recommended to convert the PDF file to a PowerPoint document to have a better presentation effect and also to ensure the content can be further edited. This article will demonstrate how to programmatically convert PDF to PowerPoint presentation using Spire.PDF for .NET.
Install Spire.PDF for .NET
To begin with, you need to add the DLL files included in the Spire.PDF for.NET package as references in your .NET project. The DLLs files can be either downloaded from this link or installed via NuGet.
PM> Install-Package Spire.PDF
Convert PDF to PowerPoint Presentation in C# and VB.NET
From Version 8.11.10, Spire.PDF for .NET supports converting PDF to PPTX using PdfDocument.SaveToFile() method. With this method, each page of your PDF file will be converted to a single slide in PowerPoint. Below are the steps to convert a PDF file to an editable PowerPoint document.
- Create a PdfDocument instance.
- Load a sample PDF document using PdfDocument.LoadFromFile() method.
- Save the document as a PowerPoint document using PdfDocument.SaveToFile(string filename, FileFormat.PPTX) method.
- C#
- VB.NET
using Spire.Pdf;

namespace PDFtoPowerPoint
{
    class Program
    {
        static void Main(string[] args)
        {
            //Create a PdfDocument instance
            PdfDocument pdf = new PdfDocument();

            //Load a sample PDF document
            pdf.LoadFromFile(@"C:\Users\Administrator\Desktop\Sample.pdf");

            //Convert the PDF to PPTX document
            pdf.SaveToFile("ConvertPDFtoPowerPoint.pptx", FileFormat.PPTX);
        }
    }
}
Apply for a Temporary License
If you'd like to remove the evaluation message from the generated documents, or to get rid of the function limitations, please request a 30-day trial license for yourself.
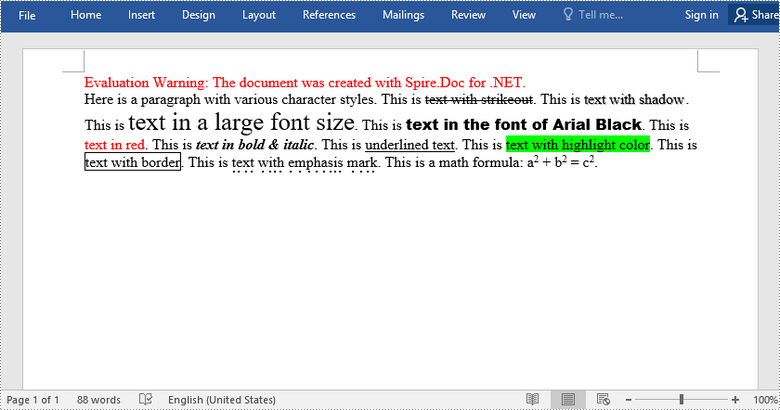
Character formatting is used to change the appearance of individual words or phrases. Formatted text can direct the reader's attention to select sections of a document and highlight key information. There are quite a lot of forms of characters formatting that you can use in Word. In this article, you will learn how to apply various types of formatting to characters in Word in C# and VB.NET using Spire.Doc for .NET.
- Font Name
- Font Size
- Font Color
- Highlight Color
- Bold
- Italic
- Underline
- Strikethrough
- Border
- Shadow Effect
- Emphasis Mark
- Subscript and Superscript
Install Spire.Doc for .NET
To begin with, you need to add the DLL files included in the Spire.Doc for .NET package as references in your .NET project. The DLL files can be either downloaded from this link or installed via NuGet.
PM> Install-Package Spire.Doc
Apply Formatting to Characters in Word in C# and VB.NET
In order to apply formatting to a piece of text, you need to get the text in a TextRange and then format the characters within the TextRange through the CharacterFormat property. The following are the detailed steps.
- Create a Document object.
- Add a section to the document using Document.AddSection() method.
- Add a paragraph to the section using Section.AddParagraph() method.
- Append text to the paragraph using Paragraph.AppendText() method and return a TextRange object.
- Apply formatting such as font name, font size, border and highlight color to the characters within the text range through TextRange.CharacterFormat property.
- Save the document to a Word file using Document.SaveToFile() method.
- C#
- VB.NET
using Spire.Doc;
using Spire.Doc.Documents;
using Spire.Doc.Fields;
using System.Drawing;

namespace ApplyFormattingToCharacters
{
    class Program
    {
        static void Main(string[] args)
        {
            //Create a Document object
            Document document = new Document();

            //Add a section
            Section sec = document.AddSection();

            //Add a paragraph
            Paragraph paragraph = sec.AddParagraph();
            paragraph.AppendText("Here is a paragraph with various character styles. This is ");

            //Append text to the paragraph and return a TextRange object
            TextRange tr = paragraph.AppendText("text with strikeout");

            //Set the character format to strikeout via TextRange object
            tr.CharacterFormat.IsStrikeout = true;

            //Apply shadow effect to text
            paragraph.AppendText(". This is ");
            tr = paragraph.AppendText("text with shadow");
            tr.CharacterFormat.IsShadow = true;

            //Set font size
            paragraph.AppendText(". This is ");
            tr = paragraph.AppendText("text in a large font size");
            tr.CharacterFormat.FontSize = 20;

            //Set font name
            paragraph.AppendText(". This is ");
            tr = paragraph.AppendText("text in the font of Arial Black");
            tr.CharacterFormat.FontName = "Arial Black";

            //Set font color
            paragraph.AppendText(". This is ");
            tr = paragraph.AppendText("text in red");
            tr.CharacterFormat.TextColor = Color.Red;

            //Apply bold & italic to text
            paragraph.AppendText(". This is ");
            tr = paragraph.AppendText("text in bold & italic");
            tr.CharacterFormat.Bold = true;
            tr.CharacterFormat.Italic = true;

            //Apply underline to text
            paragraph.AppendText(". This is ");
            tr = paragraph.AppendText("underlined text");
            tr.CharacterFormat.UnderlineStyle = UnderlineStyle.Single;

            //Apply background color to text
            paragraph.AppendText(". This is ");
            tr = paragraph.AppendText("text with highlight color");
            tr.CharacterFormat.HighlightColor = Color.Green;

            //Apply border to text
            paragraph.AppendText(". This is ");
            tr = paragraph.AppendText("text with border");
            tr.CharacterFormat.Border.BorderType = Spire.Doc.Documents.BorderStyle.Single;
            tr.CharacterFormat.Border.Color = Color.Black;

            //Apply emphasis mark to text
            paragraph.AppendText(". This is ");
            tr = paragraph.AppendText("text with emphasis mark");
            tr.CharacterFormat.EmphasisMark = Emphasis.DotBelow;

            //Apply superscript to text
            paragraph.AppendText(". This is a math formula: a");
            tr = paragraph.AppendText("2");
            tr.CharacterFormat.SubSuperScript = SubSuperScript.SuperScript;
            paragraph.AppendText(" + b");
            tr = paragraph.AppendText("2");
            tr.CharacterFormat.SubSuperScript = SubSuperScript.SuperScript;
            paragraph.AppendText(" = c");
            tr = paragraph.AppendText("2");
            tr.CharacterFormat.SubSuperScript = SubSuperScript.SuperScript;
            paragraph.AppendText(".");

            //Save to file
            document.SaveToFile("SetCharacterFormat.docx", FileFormat.Docx);
        }
    }
}
Apply for a Temporary License
If you'd like to remove the evaluation message from the generated documents, or to get rid of the function limitations, please request a 30-day trial license for yourself.
A bar chart is a type of graph that represents or summarizes data in the form of horizontal rectangular bars of equal width but different lengths. In MS Excel, the bar chart is a great tool to compare data among different groups, which helps users to analyze data and draw conclusions quickly. In this article, you will learn how to programmatically create a clustered bar chart or a stacked bar chart in an Excel worksheet using Spire.XLS for Java.
Install Spire.XLS for Java
First of all, you're required to add the Spire.Xls.jar file as a dependency in your Java program. The JAR file can be downloaded from this link. If you use Maven, you can easily import the JAR file in your application by adding the following code to your project's pom.xml file.
<repositories>
    <repository>
        <id>com.e-iceblue</id>
        <name>e-iceblue</name>
        <url>https://repo.e-iceblue.com/nexus/content/groups/public/</url>
    </repository>
</repositories>
<dependencies>
    <dependency>
        <groupId>e-iceblue</groupId>
        <artifactId>spire.xls</artifactId>
        <version>16.6.5</version>
    </dependency>
</dependencies>
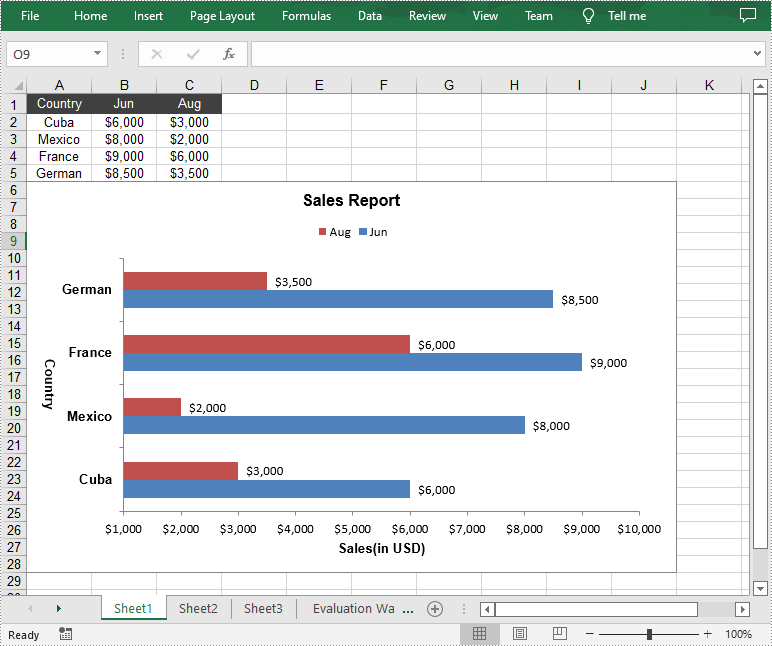
Create a Clustered Bar Chart in Excel
In clustered bar chart, data values of different series are displayed in separate bars side-by-side, which allows a direct comparison of multiple data series per category. The following are the detailed steps to create a clustered bar chart in an Excel worksheet.
- Create an instance of Workbook class.
- Get a specified worksheet by its index using Workbook.getWorksheets().get() method.
- Add some data to specified cells and set the cell styles.
- Add a 2D clustered bar chart to the specified worksheet using Worksheet.getCharts().add(ExcelChartType.BarClustered) method.
- Set data range for the chart using Chart.setDataRange(CellRange dataRange) method.
- Set the position and title of the chart.
- Get the primary category axis of the chart using Chart.getPrimaryCategoryAxis() method, and then set the display text and title of the category axis using the methods under ChartCategoryAxis class.
- Get the primary value axis of the chart using Chart.getPrimaryValueAxis() method, and then set the title, minimum value and major gridlines of the value axis using the methods under ChartValueAxis class.
- Loop through the data series of the chart, and then show data labels for the data points of each data series by setting the value of ChartSerie.getDataPoints().getDefaultDataPoint().getDataLabels().hasValue() method to true.
- Set the position of chart legend using Chart.getLegend().setPosition() method.
- Save the result file using Workbook.saveToFile() method.
- Java
import com.spire.xls.*;
import com.spire.xls.charts.ChartSerie;
import com.spire.xls.charts.ChartSeries;

import java.awt.*;

public class CreateBarChart {

    public static void main(String[] args) {

        //Create an instance of Workbook class
        Workbook workbook = new Workbook();

        //Get the first worksheet
        Worksheet sheet = workbook.getWorksheets().get(0);

        //Insert data to specified cells
        sheet.getCellRange("A1").setValue("Country");
        sheet.getCellRange("A2").setValue("Cuba");
        sheet.getCellRange("A3").setValue("Mexico");
        sheet.getCellRange("A4").setValue("France");
        sheet.getCellRange("A5").setValue("German");

        sheet.getCellRange("B1").setValue("Jun");
        sheet.getCellRange("B2").setNumberValue(6000);
        sheet.getCellRange("B3").setNumberValue(8000);
        sheet.getCellRange("B4").setNumberValue(9000);
        sheet.getCellRange("B5").setNumberValue(8500);

        sheet.getCellRange("C1").setValue("Aug");
        sheet.getCellRange("C2").setNumberValue(3000);
        sheet.getCellRange("C3").setNumberValue(2000);
        sheet.getCellRange("C4").setNumberValue(6000);
        sheet.getCellRange("C5").setNumberValue(3500);

        //Set cell styles
        sheet.getCellRange("A1:C1").setRowHeight(15);
        sheet.getCellRange("A1:C1").getCellStyle().setColor(Color.darkGray);
        sheet.getCellRange("A1:C1").getCellStyle().getExcelFont().setColor(Color.white);
        sheet.getCellRange("A1:C5").getCellStyle().setVerticalAlignment(VerticalAlignType.Center);
        sheet.getCellRange("A1:C5").getCellStyle().setHorizontalAlignment(HorizontalAlignType.Center);

        //Set number format
        sheet.getCellRange("B2:C5").getCellStyle().setNumberFormat("\"$\"#,##0");

        //Add a clustered bar chart to the worksheet
        Chart chart = sheet.getCharts().add(ExcelChartType.BarClustered);

        //Set data range for the chart
        chart.setDataRange(sheet.getCellRange("A1:C5"));
        chart.setSeriesDataFromRange(false);

        //Set position of the chart
        chart.setLeftColumn(1);
        chart.setTopRow(6);
        chart.setRightColumn(11);
        chart.setBottomRow(29);

        //Set and format chart title
        chart.setChartTitle("Sales Report");
        chart.getChartTitleArea().isBold(true);
        chart.getChartTitleArea().setSize(12);

        //Set and format category axis title
        chart.getPrimaryCategoryAxis().setTitle("Country");
        chart.getPrimaryCategoryAxis().getFont().isBold(true);
        chart.getPrimaryCategoryAxis().getTitleArea().isBold(true);
        chart.getPrimaryCategoryAxis().getTitleArea().setTextRotationAngle(90);

        //Set and format value axis title
        chart.getPrimaryValueAxis().setTitle("Sales(in USD)");
        chart.getPrimaryValueAxis().hasMajorGridLines(false);
        chart.getPrimaryValueAxis().setMinValue(1000);
        chart.getPrimaryValueAxis().getTitleArea().isBold(true);

        //Show data labels for data points
        ChartSeries series = chart.getSeries();
        for (int i = 0;i < series.size();i++)
        {
            ChartSerie cs = series.get(i);
            cs.getFormat().getOptions().isVaryColor(true);
            cs.getDataPoints().getDefaultDataPoint().getDataLabels().hasValue(true);
        }

        //Set position of chart legend
        chart.getLegend().setPosition(LegendPositionType.Top);

        //Save the result file
        workbook.saveToFile("CreateBarChart.xlsx", ExcelVersion.Version2016);
    }
}
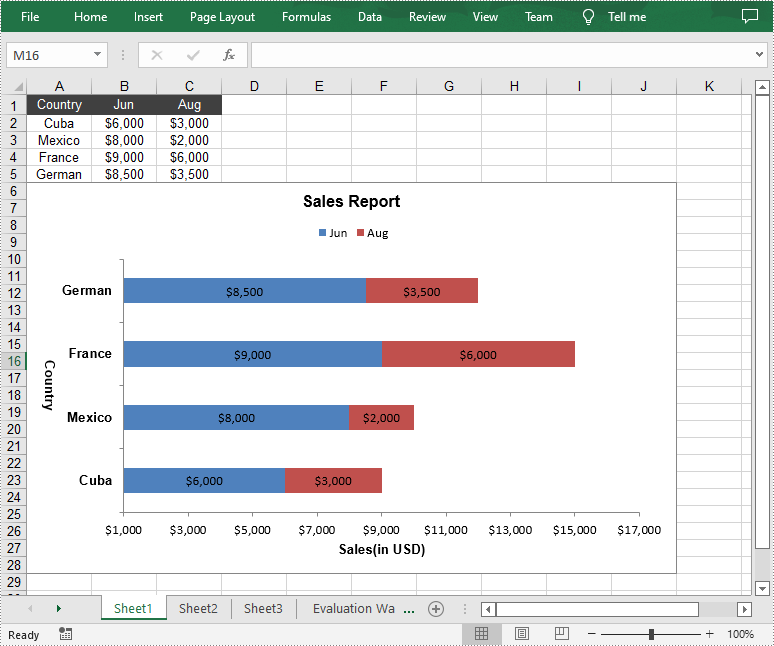
Create a Stacked Bar Chart in Excel
In stacked bar chart, data values of different series are stacked one over the other in a single bar. Compared with the clustered bar chart, the stacked bar chart provides a clearer view of part-to-whole comparison in each category. The following are the detailed steps to create a stacked bar chart in an Excel worksheet.
- Create an instance of Workbook class.
- Get a specified worksheet by its index using Workbook.getWorksheets().get() method.
- Add some data to specified cells and set the cell styles.
- Add a 2D stacked bar chart to the specified worksheet using Worksheet.getCharts().add(ExcelChartType.BarStacked) method.
- Set data range for the chart using Chart.setDataRange(CellRange dataRange) method.
- Set position, title, category axis title and value axis title for the chart.
- Loop through the data series of the chart, and then show data labels for the data points of each data series by setting the value of ChartSerie.getDataPoints().getDefaultDataPoint().getDataLabels().hasValue() method to true.
- Set the position of chart legend using Chart.getLegend().setPosition() method.
- Save the result file using Workbook.saveToFile() method.
- Java
import com.spire.xls.*;
import com.spire.xls.charts.ChartSerie;
import com.spire.xls.charts.ChartSeries;

import java.awt.*;

public class CreateBarChart {

    public static void main(String[] args) {

        //Create a Workbook object
        Workbook workbook = new Workbook();

        //Get the first worksheet
        Worksheet sheet = workbook.getWorksheets().get(0);

        //Insert data to specified cells
        sheet.getCellRange("A1").setValue("Country");
        sheet.getCellRange("A2").setValue("Cuba");
        sheet.getCellRange("A3").setValue("Mexico");
        sheet.getCellRange("A4").setValue("France");
        sheet.getCellRange("A5").setValue("German");

        sheet.getCellRange("B1").setValue("Jun");
        sheet.getCellRange("B2").setNumberValue(6000);
        sheet.getCellRange("B3").setNumberValue(8000);
        sheet.getCellRange("B4").setNumberValue(9000);
        sheet.getCellRange("B5").setNumberValue(8500);

        sheet.getCellRange("C1").setValue("Aug");
        sheet.getCellRange("C2").setNumberValue(3000);
        sheet.getCellRange("C3").setNumberValue(2000);
        sheet.getCellRange("C4").setNumberValue(6000);
        sheet.getCellRange("C5").setNumberValue(3500);

        //Set cell styles
        sheet.getCellRange("A1:C1").setRowHeight(15);
        sheet.getCellRange("A1:C1").getCellStyle().setColor(Color.darkGray);
        sheet.getCellRange("A1:C1").getCellStyle().getExcelFont().setColor(Color.white);
        sheet.getCellRange("A1:C5").getCellStyle().setVerticalAlignment(VerticalAlignType.Center);
        sheet.getCellRange("A1:C5").getCellStyle().setHorizontalAlignment(HorizontalAlignType.Center);

        //Set number format
        sheet.getCellRange("B2:C5").getCellStyle().setNumberFormat("\"$\"#,##0");

        //Add a stacked bar chart to the worksheet
        Chart chart = sheet.getCharts().add(ExcelChartType.BarStacked);

        //Set data range for the chart
        chart.setDataRange(sheet.getCellRange("A1:C5"));
        chart.setSeriesDataFromRange(false);

        //Set position of the chart
        chart.setLeftColumn(1);
        chart.setTopRow(6);
        chart.setRightColumn(11);
        chart.setBottomRow(29);

        //Set and format chart title
        chart.setChartTitle("Sales Report");
        chart.getChartTitleArea().isBold(true);
        chart.getChartTitleArea().setSize(12);

        //Set and format category axis title
        chart.getPrimaryCategoryAxis().setTitle("Country");
        chart.getPrimaryCategoryAxis().getFont().isBold(true);
        chart.getPrimaryCategoryAxis().getTitleArea().isBold(true);
        chart.getPrimaryCategoryAxis().getTitleArea().setTextRotationAngle(90);

        //Set and format value axis title
        chart.getPrimaryValueAxis().setTitle("Sales(in USD)");
        chart.getPrimaryValueAxis().hasMajorGridLines(false);
        chart.getPrimaryValueAxis().setMinValue(1000);
        chart.getPrimaryValueAxis().getTitleArea().isBold(true);

        //Show data labels for data points
        ChartSeries series = chart.getSeries();
        for (int i = 0;i < series.size();i++)
        {
            ChartSerie cs = series.get(i);
            cs.getFormat().getOptions().isVaryColor(true);
            cs.getDataPoints().getDefaultDataPoint().getDataLabels().hasValue(true);
        }

        //Set position of chart legend
        chart.getLegend().setPosition(LegendPositionType.Top);

        //Save the result file
        workbook.saveToFile("StackedBarChart.xlsx", ExcelVersion.Version2016);
    }
}
Apply for a Temporary License
If you'd like to remove the evaluation message from the generated documents, or to get rid of the function limitations, please request a 30-day trial license for yourself.
