
Knowledgebase (2345)
Children categories
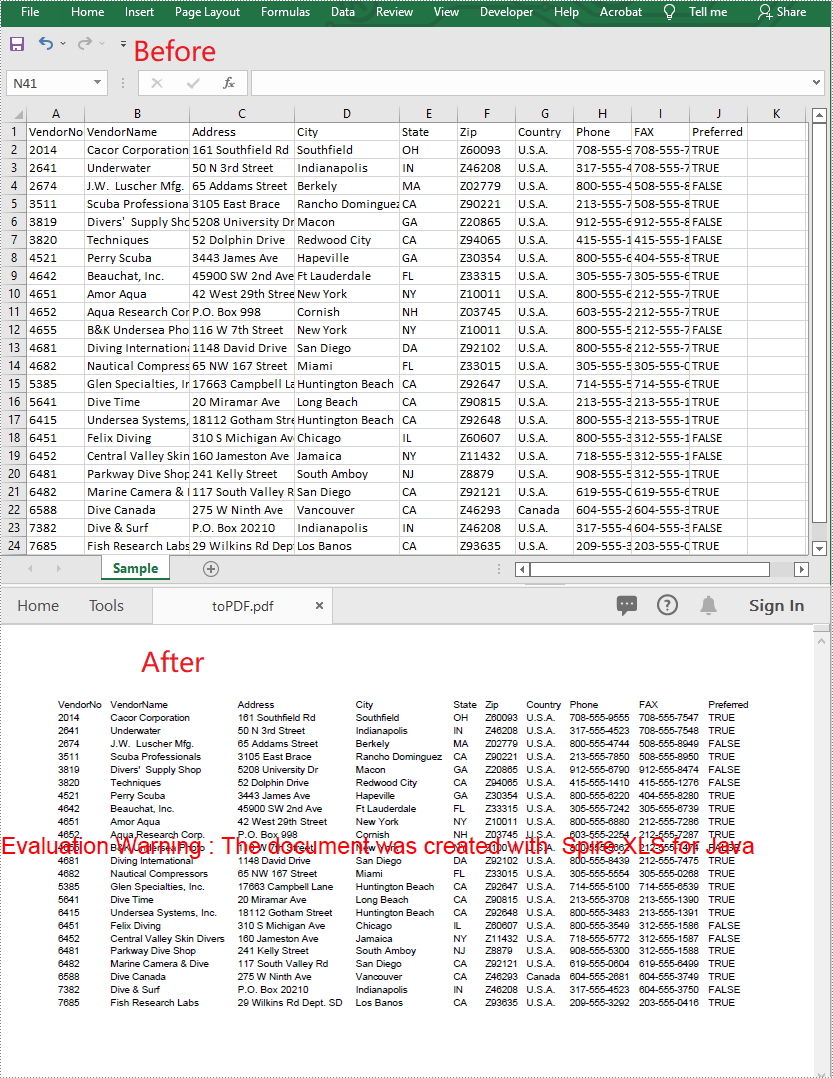
A CSV file is essentially a plain text file. It can be easily edited by almost any program that can handle text files, such as Notepad. Converting a CSV file to PDF can help in preventing it from being edited by viewers. In this article, you will learn how to convert CSV to PDF in Java using Spire.XLS for Java.
Install Spire.XLS for Java
First of all, you're required to add the Spire.Xls.jar file as a dependency in your Java program. The JAR file can be downloaded from this link. If you use Maven, you can easily import the JAR file in your application by adding the following code to your project's pom.xml file.
<repositories>
    <repository>
        <id>com.e-iceblue</id>
        <name>e-iceblue</name>
        <url>https://repo.e-iceblue.com/nexus/content/groups/public/</url>
    </repository>
</repositories>
<dependencies>
    <dependency>
        <groupId>e-iceblue</groupId>
        <artifactId>spire.xls</artifactId>
        <version>16.6.5</version>
    </dependency>
</dependencies>
Convert CSV to PDF in Java
The following are the steps to convert a CSV file to PDF:
- Create an instance of Workbook class.
- Load the CSV file using Workbook.loadFromFile(filePath, separator) method.
- Set the worksheet to be rendered to one PDF page using Workbook.getConverterSetting().setSheetFitToPage(true) method.
- Get the first worksheet in the Workbook using Workbook.getWorksheets().get(0) method.
- Loop through the columns in the worksheet and auto-fit the width of each column using Worksheet.autoFitColumn() method.
- Save the worksheet to PDF using Worksheet.saveToPdf() method.
- Java
import com.spire.xls.Workbook;
import com.spire.xls.Worksheet;

public class ConvertCsvToPdf {
    public static void main(String []args) {
        //Create a Workbook instance
        Workbook wb = new Workbook();
        //Load a CSV file
        wb.loadFromFile("Sample.csv", ",");

        //Set SheetFitToPage property as true to ensure the worksheet is converted to 1 PDF page
        wb.getConverterSetting().setSheetFitToPage(true);

        //Get the first worksheet
        Worksheet sheet = wb.getWorksheets().get(0);

        //Loop through the columns in the worksheet
        for (int i = 1; i < sheet.getColumns().length; i++)
        {
            //AutoFit columns
            sheet.autoFitColumn(i);
        }

        //Save the worksheet to PDF
        sheet.saveToPdf("toPDF.pdf");
    }
}
Apply for a Temporary License
If you'd like to remove the evaluation message from the generated documents, or to get rid of the function limitations, please request a 30-day trial license for yourself.
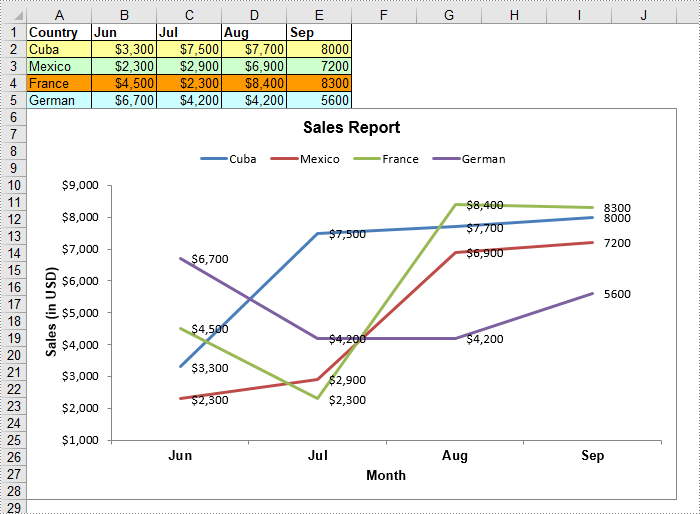
Line chart is a fundamental chart type used to display trends or changes in data over a specific time interval. A line chart uses lines to connect data points, it can include a single line for one data set or multiple lines for two or more data sets. This article will demonstrate how to create a line chart in Excel in Java using Spire.XLS for Java.
Install Spire.XLS for Java
First of all, you're required to add the Spire.Xls.jar file as a dependency in your Java program. The JAR file can be downloaded from this link. If you use Maven, you can easily import the JAR file in your application by adding the following code to your project's pom.xml file.
<repositories>
    <repository>
        <id>com.e-iceblue</id>
        <name>e-iceblue</name>
        <url>https://repo.e-iceblue.com/nexus/content/groups/public/</url>
    </repository>
</repositories>
<dependencies>
    <dependency>
        <groupId>e-iceblue</groupId>
        <artifactId>spire.xls</artifactId>
        <version>16.6.5</version>
    </dependency>
</dependencies>
Create a Line Chart in Excel using Java
The following are the main steps to create a line chart:
- Create an instance of Workbook class.
- Get the first worksheet by its index (zero-based) though Workbook.getWorksheets().get(sheetIndex) method.
- Add some data to the worksheet.
- Add a line chart to the worksheet using Worksheet.getCharts().add(ExcelChartType.Line) method.
- Set data range for the chart through Chart.setDataRange() method.
- Set position, title, category axis title and value axis title for the chart.
- Loop through the data series of the chart, show data labels for the data points of each data series using ChartSerie.getDataPoints().getDefaultDataPoint().getDataLabels().hasValue(true) method.
- Set the position of chart legend through Chart.getLegend().setPosition() method.
- Save the result file using Workbook.saveToFile() method.
- Java
import com.spire.xls.*;
import com.spire.xls.charts.ChartSerie;

import java.awt.*;

public class CreateLineChart {
    public static void main(String []args){
        //Create a Workbook instance
        Workbook workbook = new Workbook();

        //Get the first worksheet
        Worksheet sheet = workbook.getWorksheets().get(0);
        //Set sheet name
        sheet.setName("Line Chart");;
        //Hide gridlines
        sheet.setGridLinesVisible(false);

        //Add some data to the the worksheet
        sheet.getRange().get("A1").setValue("Country");
        sheet.getRange().get("A2").setValue("Cuba");
        sheet.getRange().get("A3").setValue("Mexico");
        sheet.getRange().get("A4").setValue("France");
        sheet.getRange().get("A5").setValue("German");

        sheet.getRange().get("B1").setValue("Jun");
        sheet.getRange().get("B2").setNumberValue(3300);
        sheet.getRange().get("B3").setNumberValue(2300);
        sheet.getRange().get("B4").setNumberValue(4500);
        sheet.getRange().get("B5").setNumberValue(6700);

        sheet.getRange().get("C1").setValue("Jul");
        sheet.getRange().get("C2").setNumberValue(7500);
        sheet.getRange().get("C3").setNumberValue(2900);
        sheet.getRange().get("C4").setNumberValue(2300);
        sheet.getRange().get("C5").setNumberValue(4200);

        sheet.getRange().get("D1").setValue("Aug");
        sheet.getRange().get("D2").setNumberValue(7700);
        sheet.getRange().get("D3").setNumberValue(6900);
        sheet.getRange().get("D4").setNumberValue(8400);
        sheet.getRange().get("D5").setNumberValue(4200);

        sheet.getRange().get("E1").setValue("Sep");
        sheet.getRange().get("E2").setNumberValue(8000);
        sheet.getRange().get("E3").setNumberValue(7200);
        sheet.getRange().get("E4").setNumberValue(8300);
        sheet.getRange().get("E5").setNumberValue(5600);

        //Set font and fill color for specified cells
        sheet.getRange().get("A1:E1").getStyle().getFont().isBold(true);
        sheet.getRange().get("A2:E2").getStyle().setKnownColor(ExcelColors.LightYellow);;
        sheet.getRange().get("A3:E3").getStyle().setKnownColor(ExcelColors.LightGreen1);
        sheet.getRange().get("A4:E4").getStyle().setKnownColor(ExcelColors.LightOrange);
        sheet.getRange().get("A5:E5").getStyle().setKnownColor(ExcelColors.LightTurquoise);

        //Set cell borders
        sheet.getRange().get("A1:E5").getStyle().getBorders().getByBordersLineType(BordersLineType.EdgeTop).setColor(new Color(0, 0, 128));
        sheet.getRange().get("A1:E5").getStyle().getBorders().getByBordersLineType(BordersLineType.EdgeTop).setLineStyle(LineStyleType.Thin);
        sheet.getRange().get("A1:E5").getStyle().getBorders().getByBordersLineType(BordersLineType.EdgeBottom).setColor(new Color(0, 0, 128));
        sheet.getRange().get("A1:E5").getStyle().getBorders().getByBordersLineType(BordersLineType.EdgeBottom).setLineStyle(LineStyleType.Thin);
        sheet.getRange().get("A1:E5").getStyle().getBorders().getByBordersLineType(BordersLineType.EdgeLeft).setColor(new Color(0, 0, 128));
        sheet.getRange().get("A1:E5").getStyle().getBorders().getByBordersLineType(BordersLineType.EdgeLeft).setLineStyle(LineStyleType.Thin);
        sheet.getRange().get("A1:E5").getStyle().getBorders().getByBordersLineType(BordersLineType.EdgeRight).setColor(new Color(0, 0, 128));
        sheet.getRange().get("A1:E5").getStyle().getBorders().getByBordersLineType(BordersLineType.EdgeRight).setLineStyle(LineStyleType.Thin);

        //Set number format
        sheet.getRange().get("B2:D5").getStyle().setNumberFormat("\"$\"#,##0");

        //Add a line chart to the worksheet
        Chart chart = sheet.getCharts().add(ExcelChartType.Line);

        //Set data range for the chart
        chart.setDataRange(sheet.getRange().get("A1:E5"));

        //Set position of the chart
        chart.setLeftColumn(1);
        chart.setTopRow(6);
        chart.setRightColumn(11);
        chart.setBottomRow(29);

        //Set and format chart title
        chart.setChartTitle("Sales Report");
        chart.getChartTitleArea().isBold(true);
        chart.getChartTitleArea().setSize(12);

        //Set and format category axis title
        chart.getPrimaryCategoryAxis().setTitle("Month");
        chart.getPrimaryCategoryAxis().getFont().isBold(true);
        chart.getPrimaryCategoryAxis().getTitleArea().isBold(true);

        //Set and format value axis title
        chart.getPrimaryValueAxis().setTitle("Sales (in USD)");
        chart.getPrimaryValueAxis().hasMajorGridLines(false);
        chart.getPrimaryValueAxis().getTitleArea().setTextRotationAngle(-90);
        chart.getPrimaryValueAxis().setMinValue(1000);
        chart.getPrimaryValueAxis().getTitleArea().isBold(true);

        //Loop through the data series of the chart
        for(ChartSerie cs : (Iterable) chart.getSeries())
        {
            cs.getFormat().getOptions().isVaryColor(true);
            //Show data labels for data points
            cs.getDataPoints().getDefaultDataPoint().getDataLabels().hasValue(true);
        }

        //Set position of chart legend
        chart.getLegend().setPosition(LegendPositionType.Top);

        //Save the result file
        workbook.saveToFile("LineChart.xlsx", ExcelVersion.Version2016);
    }
}
Apply for a Temporary License
If you'd like to remove the evaluation message from the generated documents, or to get rid of the function limitations, please request a 30-day trial license for yourself.
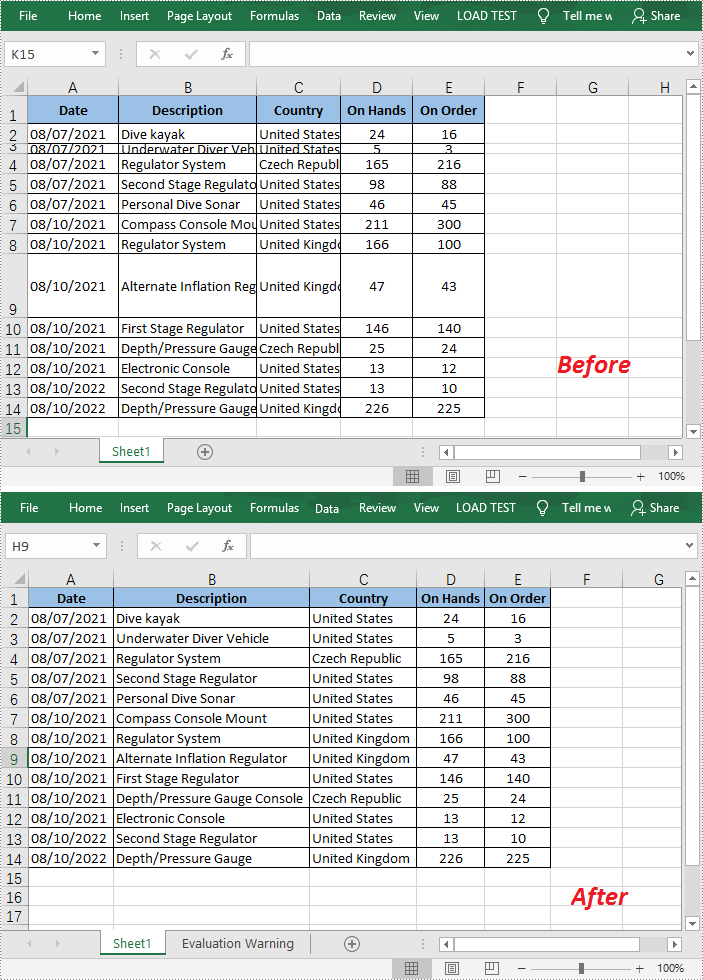
AutoFit is a very practical feature MS Excel offers to automatically resize cells to accommodate different sized data. With a single click, it makes all the data in a cell clearly visible without having to manually adjust the column width or row height. In this article, you will learn how to programmatically AutoFit the column width and row height in an Excel worksheet using Spire.XLS for Java.
Install Spire.XLS for Java
First, you're required to add the Spire.Xls.jar file as a dependency in your Java program. The JAR file can be downloaded from this link. If you use Maven, you can easily import the JAR file in your application by adding the following code to your project's pom.xml file.
<repositories>
    <repository>
        <id>com.e-iceblue</id>
        <name>e-iceblue</name>
        <url>https://repo.e-iceblue.com/nexus/content/groups/public/</url>
    </repository>
</repositories>
<dependencies>
    <dependency>
        <groupId>e-iceblue</groupId>
        <artifactId>spire.xls</artifactId>
        <version>16.6.5</version>
    </dependency>
</dependencies>
AutoFit Column Width and Row Height in Excel
The detailed steps are as follows.
- Create a Workbook object.
- Load a sample Excel document using Workbook.loadFromFile() method.
- Get a specified worksheet using Workbook.getWorksheets().get() method.
- Get the used range on the specified worksheet using Worksheet.getAllocatedRange() method.
- Autofit column width and row height in the range using CellRange.autoFitColumns() and CellRange.autoFitRows() methods.
- Save the document to another file using Workbook.saveToFile() method.
- Java
import com.spire.xls.*;

public class AutoFitColumn {
    public static void main(String[] args) {
        //Create a Workbook object
        Workbook workbook = new Workbook();

        //Load a sample Excel document
        workbook.loadFromFile("E:\\Files\\Test.xlsx");

        //Get the first worksheet
        Worksheet worksheet = workbook.getWorksheets().get(0);

        //AutoFit column width and row height
        worksheet.getAllocatedRange().autoFitColumns();
        worksheet.getAllocatedRange().autoFitRows();

        //Save the document
        workbook.saveToFile("AutoFitCell.xlsx", ExcelVersion.Version2013);
    }
}
Apply for a Temporary License
If you'd like to remove the evaluation message from the generated documents, or to get rid of the function limitations, please request a 30-day trial license for yourself.
