
Knowledgebase (2344)
Children categories
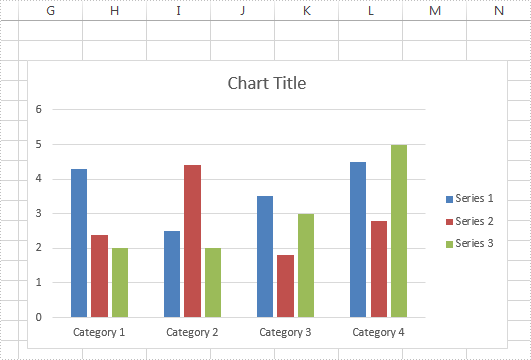
Spire.XLS enables developers to change the color of data series in an Excel chart with just a few lines of code. Once changed, the legend color will also turn into the same as the color you set to the series.
The following part demonstrates the steps of how to accomplish this task. Below picture shows the original colors of the data series in an Excel chart:
Code snippets:
Step 1: Instantiate a Workbook object and load the Excel workbook.
Workbook book = new Workbook();
book.LoadFromFile("Sample.xlsx");
Step 2: Get the first worksheet.
Worksheet sheet = book.Worksheets[0];
Step 3: Get the second series of the chart.
ChartSerie cs = sheet.Charts[0].Series[1];
Step 4: Change the color of the second series to Purple.
cs.Format.Fill.FillType = ShapeFillType.SolidColor;
cs.Format.Fill.ForeColor = Color.FromKnownColor(KnownColor.Purple);
Step 5: Save the Excel workbook to file.
book.SaveToFile("ChangeSeriesColor.xlsx", ExcelVersion.Version2010);
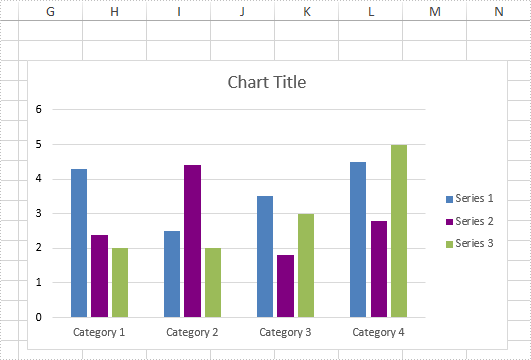
After running the code, the color of the second series has been changed into Purple, screenshot as shown below.
Full code:
using System.Drawing;
using Spire.Xls;
using Spire.Xls.Charts;

namespace Change_Series_Color
{
    class Program
    {
        static void Main(string[] args)
        {
            Workbook book = new Workbook();
            book.LoadFromFile("Sample.xlsx");
            Worksheet sheet = book.Worksheets[0];
            ChartSerie cs = sheet.Charts[0].Series[1];
            cs.Format.Fill.FillType = ShapeFillType.SolidColor;
            cs.Format.Fill.ForeColor = Color.FromKnownColor(KnownColor.Purple);
            book.SaveToFile("ChangeSeriesColor.xlsx", ExcelVersion.Version2010);
        }
    }
}
Imports System.Drawing
Imports Spire.Xls
Imports Spire.Xls.Charts

Namespace Change_Series_Color
	Class Program
		Private Shared Sub Main(args As String())
			Dim book As New Workbook()
			book.LoadFromFile("Sample.xlsx")
			Dim sheet As Worksheet = book.Worksheets(0)
			Dim cs As ChartSerie = sheet.Charts(0).Series(1)
			cs.Format.Fill.FillType = ShapeFillType.SolidColor
			cs.Format.Fill.ForeColor = Color.FromKnownColor(KnownColor.Purple)
			book.SaveToFile("ChangeSeriesColor.xlsx", ExcelVersion.Version2010)
		End Sub
	End Class
End Namespace
How to set the presentation show type as kiosk (full screen) in C#, VB.NET
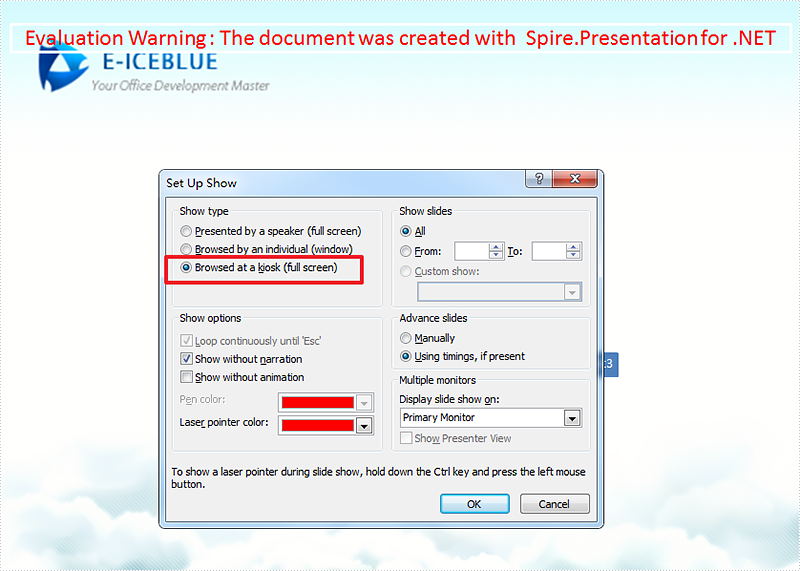
2016-11-18 08:30:18 Written by KoohjiBrowsed at a kiosk (full screen) is one kind of the slide show types in PowerPoint, if users choose this option, the Slide Show is full screen but they cannot navigate from slide to slide, for example, move to the next or previous slides.
The following part will demonstrate how to set the presentation show type as kiosk in C# and VB.NET using Spire.Presentation.
Detail steps:
Step 1: Instantiate a Presentation object and load the PPT file.
Presentation presentation = new Presentation();
presentation.LoadFromFile("Sample.pptx");
Step 2: Specify the presentation show type as kiosk.
presentation.ShowType = SlideShowType.Kiosk;
Step 3: Save the file.
presentation.SaveToFile("Result.pptx", FileFormat.Pptx2013);
Output:
Full code:
using Spire.Presentation;

namespace Set_Presentation_show_type_as_ kiosk
{
    class Program
    {
        static void Main(string[] args)
        {
            Presentation presentation = new Presentation();
            presentation.LoadFromFile("Sample.pptx");
            presentation.ShowType = SlideShowType.Kiosk;
            presentation.SaveToFile("Result.pptx", FileFormat.Pptx2013);
        }
    }
}
Imports Spire.Presentation

Namespace Set_Presentation_show_type_as_ kiosk
	Class Program
		Private Shared Sub Main(args As String())
			Dim presentation As New Presentation()
			presentation.LoadFromFile("Sample.pptx")
			presentation.ShowType = SlideShowType.Kiosk
			presentation.SaveToFile("Result.pptx", FileFormat.Pptx2013)
		End Sub
	End Class
End Namespace
Working with Tick-mark Labels on the Category Axis in C#, VB.NET
2016-11-16 08:24:51 Written by KoohjiIn charts, each category on the category axis is identified by a tick-mark label and separated from other categories by tick marks. The tick-mark label text comes from the name of the associated category and is usually placed next to the axis.
In this article, we will introduce how we can custom the tick-mark labels by changing the labels' position, rotating labels and specifying interval between labels in C#, VB.ENT.
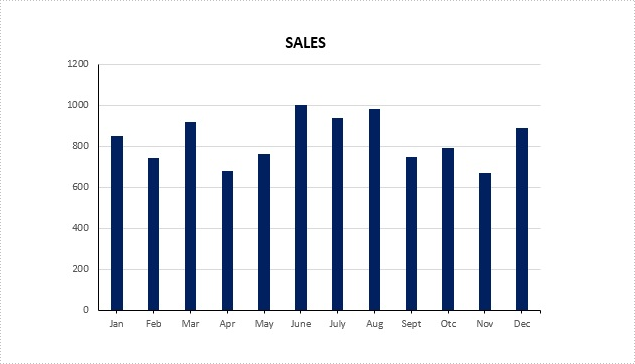
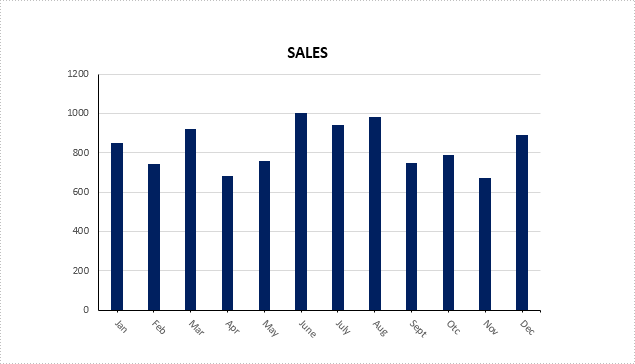
Figure 1 – Chart in Example File
To facilitate the introduction, we prepared a PowerPoint document that contains a column chart looks like the screenshot in Figure 1 and used below code to get the chart from the PowerPoint slide. Then we're able to custom the labels through the following ways.
Presentation ppt = new Presentation(@"C:\Users\Administrator\Desktop\ColumnChart.pptx",FileFormat.Pptx2013);
IChart chart = ppt.Slides[0].Shapes[0] as IChart;
Rotate tick labels
chart.PrimaryCategoryAxis.TextRotationAngle = 45;
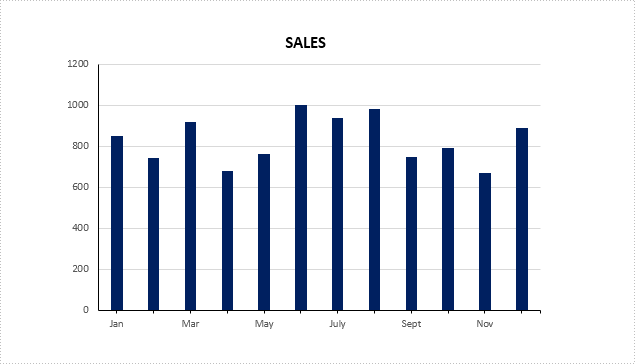
Specify interval between labels
To change the number of unlabeled tick marks, we must set IsAutomaticTickLabelSpacing property as false and change the TickLabelSpacing property to any number between 1 - 255.
chart.PrimaryCategoryAxis.IsAutomaticTickLabelSpacing = false;
chart.PrimaryCategoryAxis.TickLabelSpacing = 2;
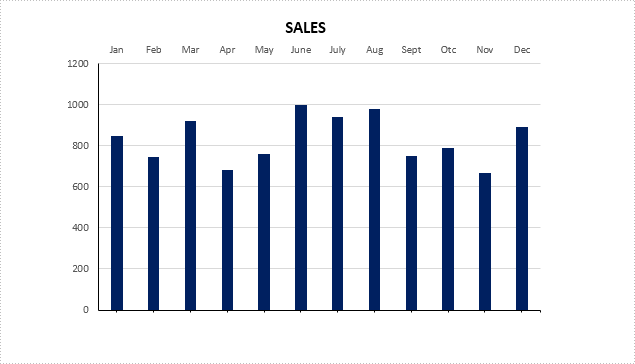
Change tick labels' position
chart.PrimaryCategoryAxis.TickLabelPosition = TickLabelPositionType.TickLabelPositionHigh;
Full Code:
using Spire.Presentation;
using Spire.Presentation.Charts;

namespace TickMarkLabel
{
    class Program
    {
        static void Main(string[] args)
        {
            Presentation ppt = new Presentation(@"C:\Users\Administrator\Desktop\ColumnChart.pptx", FileFormat.Pptx2013);
            IChart chart = ppt.Slides[0].Shapes[0] as IChart;

            //rotate tick labels
            chart.PrimaryCategoryAxis.TextRotationAngle = 45;

            //specify interval between labels
            chart.PrimaryCategoryAxis.IsAutomaticTickLabelSpacing = false;
            chart.PrimaryCategoryAxis.TickLabelSpacing = 2;

            ////change position
            //chart.PrimaryCategoryAxis.TickLabelPosition = TickLabelPositionType.TickLabelPositionHigh;

            ppt.SaveToFile("result.pptx", FileFormat.Pptx2013);

        }
    }
}
Imports Spire.Presentation
Imports Spire.Presentation.Charts

Namespace TickMarkLabel
	Class Program
		Private Shared Sub Main(args As String())
			Dim ppt As New Presentation("C:\Users\Administrator\Desktop\ColumnChart.pptx", FileFormat.Pptx2013)
			Dim chart As IChart = TryCast(ppt.Slides(0).Shapes(0), IChart)

			'rotate tick labels
			chart.PrimaryCategoryAxis.TextRotationAngle = 45

			'specify interval between labels
			chart.PrimaryCategoryAxis.IsAutomaticTickLabelSpacing = False
			chart.PrimaryCategoryAxis.TickLabelSpacing = 2

			'''/change position
			'chart.PrimaryCategoryAxis.TickLabelPosition = TickLabelPositionType.TickLabelPositionHigh;

			ppt.SaveToFile("result.pptx", FileFormat.Pptx2013)

		End Sub
	End Class
End Namespace
