
Knowledgebase (2417)
Children categories
Assign an Icon to a PDF Button Field and Set Icon Layout in C#
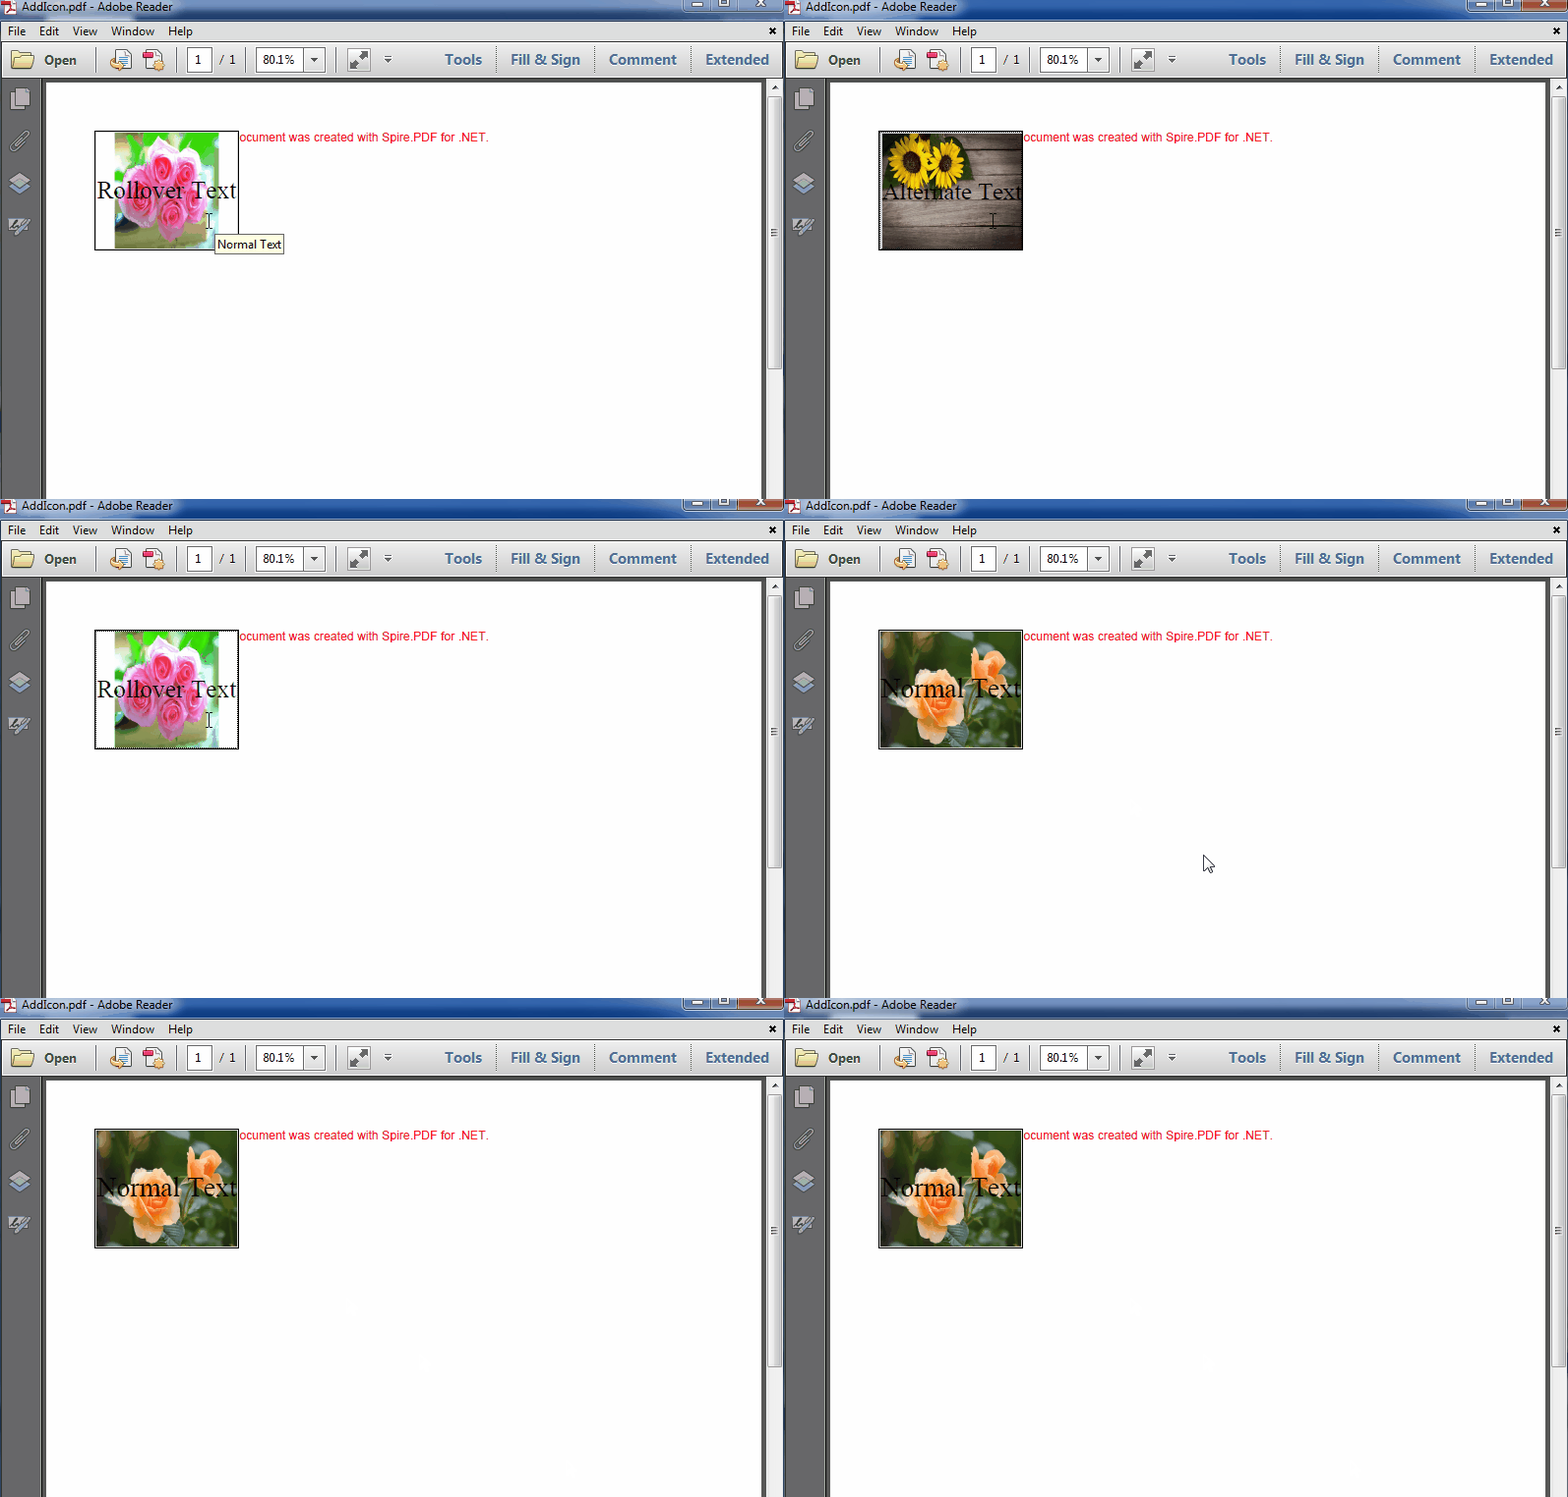
2017-06-02 07:50:05 Written by KoohjiIn PDF, buttons can be assigned icon appearances and each button can have as many as three appearances: Normal, Rollover, and Click. With Spire.PDF, not only can we assign icons to buttons, but also we can change the icons of buttons. In this article, we’re going to show you how to assign an icon to a button and set icon layout using Spire.PDF and C#. As for changing icons, please refer How to change the image on button field in C#.
Code Snippets:
Step 1: Create a PDF document and add a page to it.
PdfDocument doc = new PdfDocument();
PdfPageBase page = doc.Pages.Add();
Step 2: Create a button field.
PdfButtonField btn = new PdfButtonField(page, "button1");
btn.Bounds = new RectangleF(0, 50, 120, 100);
Step 3: Set button layout.
btn.HighlightMode = PdfHighlightMode.Push;
btn.LayoutMode = PdfButtonLayoutMode.CaptionOverlayIcon;
//Set text and icon for Normal appearance
btn.Text = "Normal Text";
btn.Icon = PdfImage.FromFile("Image.png");
//Set text and icon for Click appearance (Can only be set when highlight mode is Push)
btn.AlternateText = "Alternate Text";
btn.AlternateIcon = PdfImage.FromFile("Sunflower.jpg");
//Set text and icon for Rollover appearance (Can only be set when highlight mode is Push)
btn.RolloverText = "Rollover Text";
btn.RolloverIcon = PdfImage.FromFile("PinkRoses.jpg");
Step 4: Set icon layout.
btn.IconLayout.Spaces = new float[] { 0.5f, 0.5f };
btn.IconLayout.ScaleMode = PdfButtonIconScaleMode.Proportional;
btn.IconLayout.ScaleReason = PdfButtonIconScaleReason.Always;
btn.IconLayout.IsFitBounds = false;
Step 5: Add the button to the document.
doc.Form.Fields.Add(btn);
Step 6: Save the document.
doc.SaveToFile("AddIcon.pdf");
The resultant document looks as follows:
Full code:
using System.Drawing;
using Spire.Pdf;
using Spire.Pdf.Fields;
using Spire.Pdf.Graphics;

namespace Add_Icon_to_PDF_Button_Field
{
    class Program
    {
        static void Main(string[] args)
        {
            //Create a PDF document
            PdfDocument doc = new PdfDocument();
            PdfPageBase page = doc.Pages.Add();

            //Create a Button
            PdfButtonField btn = new PdfButtonField(page, "button1");
            btn.Bounds = new RectangleF(0, 50, 120, 100);
            btn.HighlightMode = PdfHighlightMode.Push;
            btn.LayoutMode = PdfButtonLayoutMode.CaptionOverlayIcon;
            //Set text and icon for Normal appearance
            btn.Text = "Normal Text";
            btn.Icon = PdfImage.FromFile("Image.png");
            //Set text and icon for Click appearance (Can only be set when highlight mode is Push)
            btn.AlternateText = "Alternate Text";
            btn.AlternateIcon = PdfImage.FromFile("Sunflower.jpg");
            //Set text and icon for Rollover appearance (Can only be set when highlight mode is Push)
            btn.RolloverText = "Rollover Text";
            btn.RolloverIcon = PdfImage.FromFile("PinkRoses.jpg");

            //Set icon layout
            btn.IconLayout.Spaces = new float[] { 0.5f, 0.5f };
            btn.IconLayout.ScaleMode = PdfButtonIconScaleMode.Proportional;
            btn.IconLayout.ScaleReason = PdfButtonIconScaleReason.Always;
            btn.IconLayout.IsFitBounds = false;

            //Add the button to the document
            doc.Form.Fields.Add(btn);

            //Save the document
            doc.SaveToFile("AddIcon.pdf");
        }
    }
}
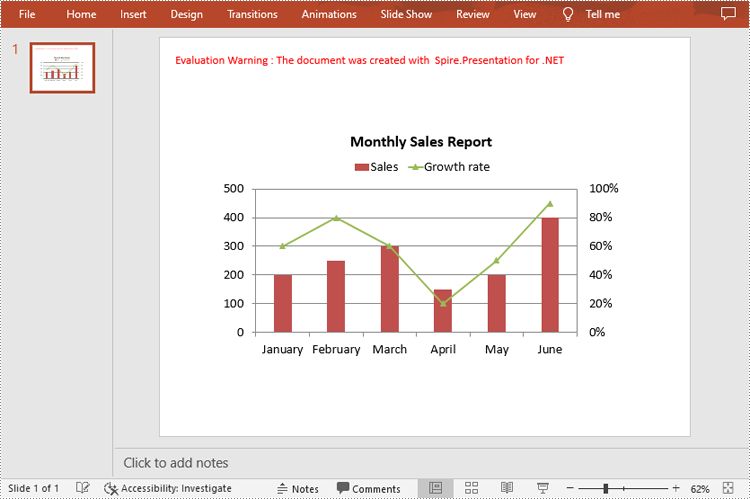
In PowerPoint, a combination chart is a type of chart that combines two or more different chart types into a single chart. It allows you to display multiple sets of data in the same chart, making it easier to compare and analyze different variables. In this article, you will learn how to programmatically create a combination chart in a PowerPoint presentation using Spire.Presentation for .NET.
Install Spire.Presentation for .NET
To begin with, you need to add the DLL files included in the Spire.Presentation for.NET package as references in your .NET project. The DLL files can be either downloaded from this link or installed via NuGet.
PM> Install-Package Spire.Presentation
Create a Combination Chart in PowerPoint in C# and VB.NET
Spire.Presentation for .NET offers the ISlide.Shapes.AppendChart(ChartType type, RectangleF rectangle) method to add a certain chart type to a slide, and then you can change the chart type of the second series to another chart to create a combo chart. The following are the steps to combine a column chart and a line chart in PowerPoint.
- Create a Presentation instance.
- Get a specified slide and add a column chart to it using ISlide.Shapes.AppendChart(ChartType.ColumnClustered, RectangleF rectangle) method.
- Create a DataTable object and add some data, then import data from data table to chart data.
- Set the chart title, categories labels, series labels and series values.
- Change the chart type of the second series to a line chart with data markers using IChart.Series[int index].Type property.
- Plot the second series on the secondary value axis by setting the IChart.Series[int index].UseSecondAxis property to true.
- Set the number format and gridlines of the secondary value axis.
- Save the result document using Presentation.SaveToFile() method.
- C#
- VB.NET
using Spire.Presentation;
using Spire.Presentation.Charts;
using Spire.Presentation.Drawing;
using System;
using System.Data;
using System.Drawing;

namespace CombinationChart
{
    class Program
    {
        static void Main(string[] args)
        {
            //Create a Presentation instance
            Presentation presentation = new Presentation();

            //Add a column clustered chart to the first slide
            RectangleF rect = new RectangleF(80, 120, 550, 320);
            IChart chart = presentation.Slides[0].Shapes.AppendChart(ChartType.ColumnClustered, rect);

            //Set and format chart title
            chart.ChartTitle.TextProperties.Text = "Monthly Sales Report";
            chart.ChartTitle.TextProperties.IsCentered = true;
            chart.ChartTitle.Height = 30;
            chart.HasTitle = true;

            //Create a datatable and add some data
            DataTable dataTable = new DataTable();
            dataTable.Columns.Add(new DataColumn("Month", Type.GetType("System.String")));
            dataTable.Columns.Add(new DataColumn("Sales", Type.GetType("System.Int32")));
            dataTable.Columns.Add(new DataColumn("Growth rate", Type.GetType("System.Decimal")));
            dataTable.Rows.Add("January", 200, 0.6);
            dataTable.Rows.Add("February", 250, 0.8);
            dataTable.Rows.Add("March", 300, 0.6);
            dataTable.Rows.Add("April", 150, 0.2);
            dataTable.Rows.Add("May", 200, 0.5);
            dataTable.Rows.Add("June", 400, 0.9);

            //Import data from datatable to chart data
            for (int c = 0; c < dataTable.Columns.Count; c++)
            {
                chart.ChartData[0, c].Text = dataTable.Columns[c].Caption;
            }
            for (int r = 0; r < dataTable.Rows.Count; r++)
            {
                object[] datas = dataTable.Rows[r].ItemArray;
                for (int c = 0; c < datas.Length; c++)
                {
                    chart.ChartData[r + 1, c].Value = datas[c];

                }
            }

            //Set series labels
            chart.Series.SeriesLabel = chart.ChartData["B1", "C1"];

            //Set categories labels
            chart.Categories.CategoryLabels = chart.ChartData["A2", "A7"];

            //Assign data to series values
            chart.Series[0].Values = chart.ChartData["B2", "B7"];
            chart.Series[1].Values = chart.ChartData["C2", "C7"];

            //Change the chart type of series 2 to a line chart with data markers
            chart.Series[1].Type = ChartType.LineMarkers;

            //Plot data of series 2 on the secondary axis
            chart.Series[1].UseSecondAxis = true;

            //Set the number format of the secondary value axis
            chart.SecondaryValueAxis.NumberFormat = "0%";

            //Hide the gridlines of the secondary value axis
            chart.SecondaryValueAxis.MajorGridTextLines.FillType = FillFormatType.None;

            //Set the legend position
            chart.ChartLegend.Position = ChartLegendPositionType.Top;

            //Set overlap
            chart.OverLap = -50;

            //Set gapwidth
            chart.GapWidth = 200;

            //Save the result document
            presentation.SaveToFile("CombinationChart.pptx", FileFormat.Pptx2010);
        }
    }
}
Apply for a Temporary License
If you'd like to remove the evaluation message from the generated documents, or to get rid of the function limitations, please request a 30-day trial license for yourself.
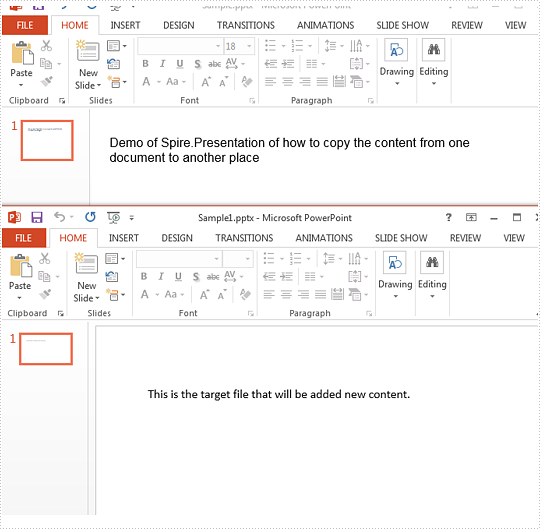
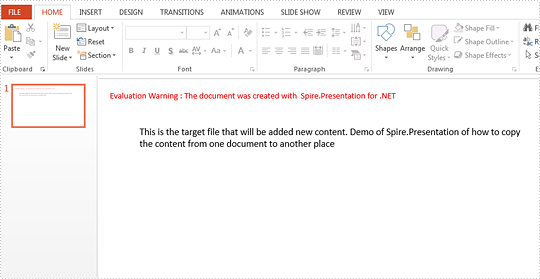
In our daily work, we may need to copy the contents from one presentation slides to another. This article is aimed to introduce the method of how to copy the content from one paragraph from the source PowerPoint document to the target document by using Spire.Presenation.
Firstly, View the original presentation slide and the target presentation slide.
Step 1: Initialize an instances of Presentation class and load the source document from file
Presentation ppt = new Presentation();
ppt.LoadFromFile("Sample.pptx", FileFormat.Pptx2010);
Step 2: Get the text from the first shape on the first slide.
string Text = "";
IShape shp = ppt.Slides[0].Shapes[0];
Text = ((IAutoShape)shp).TextFrame.Text;
Step 3: Get the first shape on the first slide from the target document file.
Presentation ppt2 = new Presentation("Sample1.pptx", FileFormat.Pptx2010);
IShape destshp = ppt2.Slides[0].Shapes[0];
Step 4: Get text from placeholder.
((IAutoShape)destshp).TextFrame.Text += Text;
Step 5: Save the document to file.
ppt2.SaveToFile("Sample1.pptx", FileFormat.Pptx2010);
Effective screenshot after copy the paragraph from the source file:
Full codes:
using Spire.Presentation;
namespace CoppyParagh
{
    class Program
    {
        static void Main(string[] args)
        {

            Presentation ppt = new Presentation();
            ppt.LoadFromFile("Sample.pptx", FileFormat.Pptx2010);

            string Text = "";
            IShape shp = ppt.Slides[0].Shapes[0];
            Text = ((IAutoShape)shp).TextFrame.Text;

            Presentation ppt2 = new Presentation("Sample1.pptx", FileFormat.Pptx2010);
            IShape destshp = ppt2.Slides[0].Shapes[0];
            ((IAutoShape)destshp).TextFrame.Text += Text;

            ppt2.SaveToFile("Sample1.pptx", FileFormat.Pptx2010);


        }
    }
}
