
Knowledgebase (2417)
Children categories
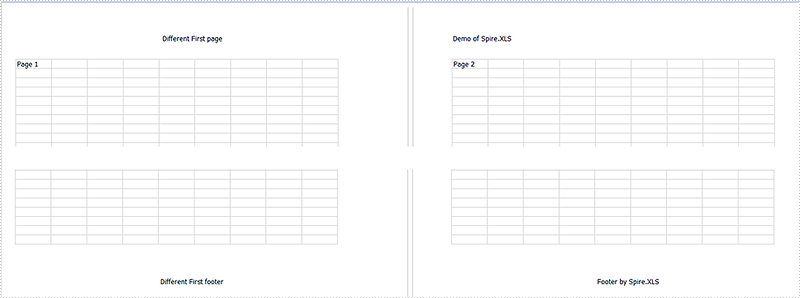
With the help of Spire.XLS, we could easily add header and footer to the excel page; we can also set different Header and Footer for Odd and Even Pages in Excel. This article will demonstrate how to add different header & footer for the first page on the excel worksheet.
Here comes to the code snippets of how to set different header and footer for the first page:
Step 1: Initialize an instance of Workbook and get the first worksheet.
Workbook workbook = new Workbook();
Worksheet sheet = workbook.Worksheets[0];
Step 2: Set the value of DifferentFirst as 1, which indicates that headers/footers for first page are different from the other pages.
Step 3: Set the header and footer for the first page.
sheet.PageSetup.FirstHeaderString = "Different First page";
sheet.PageSetup.FirstFooterString = "Different First footer";
Step 4: Set the other pages' header and footer. If we don't need to set the header and footer for other pages, we can ignore this step.
sheet.PageSetup.LeftHeader = "Demo of Spire.XLS";
sheet.PageSetup.CenterFooter = "Footer by Spire.XLS";
Step 5: Save the document to file.
workbook.SaveToFile("Result.xlsx", FileFormat.Version2010);
Effective screenshot:
Full codes:
using Spire.Xls;
namespace SetDifferentHeaderorFooter
{
    class Program
    {
        static void Main(string[] args)
        {
            Workbook workbook = new Workbook();
            Worksheet sheet = workbook.Worksheets[0];

            sheet.PageSetup.DifferentFirst = 1;

            sheet.PageSetup.FirstHeaderString = "Different First page";
            sheet.PageSetup.FirstFooterString = "Different First footer";

            sheet.PageSetup.LeftHeader = "Demo of Spire.XLS";
            sheet.PageSetup.CenterFooter = "Footer by Spire.XLS";

            workbook.SaveToFile("result.xlsx", FileFormat.Version2010);
        }
    }
}
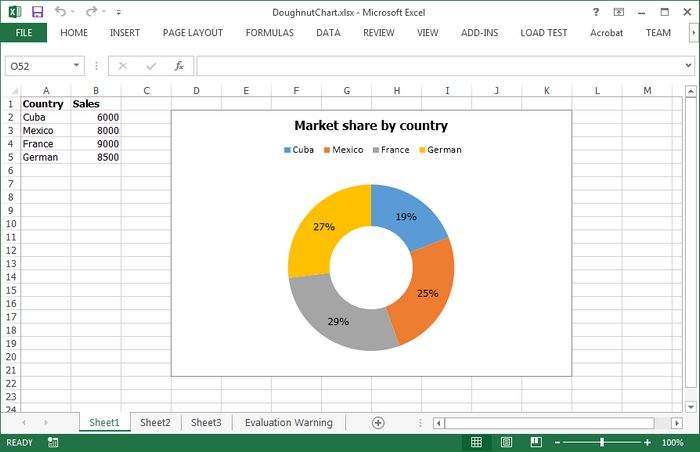
A donut chart is a variant of the pie chart, with a blank center allowing for additional information about the data as a whole to be included. In this article, you will learn how to create a doughnut chart using Spire.XLS in C#.
Step 1: Initialize a new instance of Workbook class and set the Excel version as 2013.
Workbook wb = new Workbook();
wb.Version = ExcelVersion.Version2013;
Step 2: Get the first sheet from workbook.
Worksheet sheet = wb.Worksheets[0];
Step 3: Insert some data in the sheet.
sheet.Range["A1"].Value = "Country";
sheet.Range["A1"].Style.Font.IsBold = true;
sheet.Range["A2"].Value = "Cuba";
sheet.Range["A3"].Value = "Mexico";
sheet.Range["A4"].Value = "France";
sheet.Range["A5"].Value = "German";
sheet.Range["B1"].Value = "Sales";
sheet.Range["B1"].Style.Font.IsBold = true;
sheet.Range["B2"].NumberValue = 6000;
sheet.Range["B3"].NumberValue = 8000;
sheet.Range["B4"].NumberValue = 9000;
sheet.Range["B5"].NumberValue = 8500;
Step 4: Create a Doughnut Chart based on the data from range A1:B5.
Chart chart = sheet.Charts.Add();
chart.ChartType = ExcelChartType.Doughnut;
chart.DataRange = sheet.Range["A1:B5"];
chart.SeriesDataFromRange = false;
Step 5: Set the chart position.
chart.LeftColumn = 4;
chart.TopRow = 2;
chart.RightColumn = 12;
chart.BottomRow = 22;
Step 6: Display percentage value in data labels.
foreach (ChartSerie cs in chart.Series)
{
    cs.DataPoints.DefaultDataPoint.DataLabels.HasPercentage = true;
}
Step 7: Save the file.
wb.SaveToFile("DoughnutChart.xlsx",ExcelVersion.Version2010);
Output:
Full Code:
using Spire.Xls;
using Spire.Xls.Charts;

namespace DoughnutChart
{
    class Program
    {
        static void Main(string[] args)
        {
            Workbook wb = new Workbook();
            wb.Version = ExcelVersion.Version2013;
            Worksheet sheet = wb.Worksheets[0];

            //insert data
            sheet.Range["A1"].Value = "Country";
            sheet.Range["A1"].Style.Font.IsBold = true;
            sheet.Range["A2"].Value = "Cuba";
            sheet.Range["A3"].Value = "Mexico";
            sheet.Range["A4"].Value = "France";
            sheet.Range["A5"].Value = "German";
            sheet.Range["B1"].Value = "Sales";
            sheet.Range["B1"].Style.Font.IsBold = true;
            sheet.Range["B2"].NumberValue = 6000;
            sheet.Range["B3"].NumberValue = 8000;
            sheet.Range["B4"].NumberValue = 9000;
            sheet.Range["B5"].NumberValue = 8500;

            //add a new chart, set chart type as doughnut
            Chart chart = sheet.Charts.Add();
            chart.ChartType = ExcelChartType.Doughnut;
            chart.DataRange = sheet.Range["A1:B5"];
            chart.SeriesDataFromRange = false;

            //set position of chart
            chart.LeftColumn = 4;
            chart.TopRow = 2;
            chart.RightColumn = 12;
            chart.BottomRow = 22;

            //chart title
            chart.ChartTitle = "Market share by country";
            chart.ChartTitleArea.IsBold = true;
            chart.ChartTitleArea.Size = 12;

            foreach (ChartSerie cs in chart.Series)
            {
                cs.DataPoints.DefaultDataPoint.DataLabels.HasPercentage = true;
            }

            chart.Legend.Position = LegendPositionType.Top;
            wb.SaveToFile("DoughnutChart.xlsx",ExcelVersion.Version2010);
        }
    }
}
In previous topics, we demonstrated how to create, format, protect and copy chart in PowerPoint. In this article, we'll show you how to remove chart from a specific slide by using Spire.Presentation.
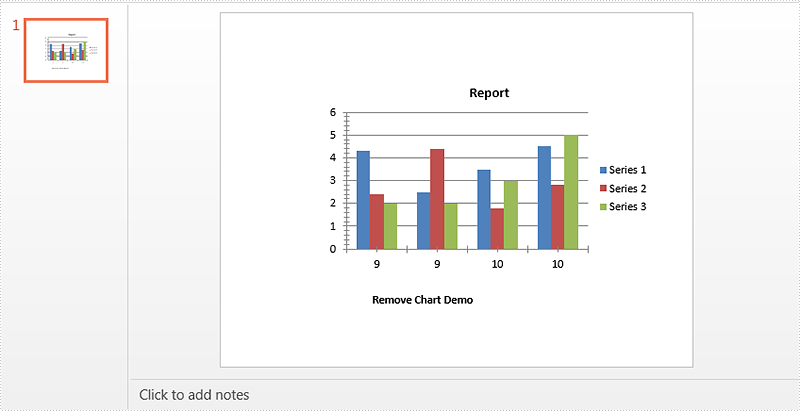
Below is a sample document which contains a chart and a textbox on the first slide, then we'll remove the chart from the slide.
Code Snippets:
Step 1: Instantiate a Presentation object and load the PowerPoint document.
Presentation ppt = new Presentation();
ppt.LoadFromFile("Sample.pptx");
Step 2: Get the first slide from the document.
ISlide slide = ppt.Slides[0];
Step 3: Remove chart from the slide.
for(int i = 0; i < slide.Shapes.Count; i++)
{
    IShape shape = slide.Shapes[i] as IShape;
    if(shape is IChart)
    {
        slide.Shapes.Remove(shape);
    }
}
Step 4: Save the document.
ppt.SaveToFile("result.pptx", FileFormat.Pptx2010);
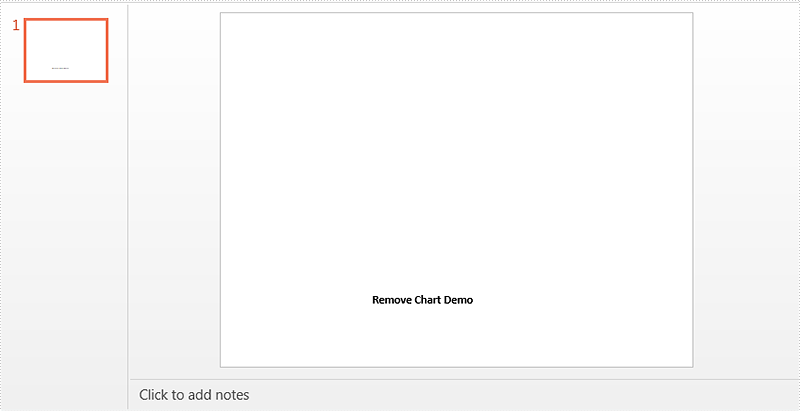
Effective screenshot:
Full code:
using Spire.Presentation;
using Spire.Presentation.Charts;

namespace Remove_Chart_in_PowerPoint
{
    class Program
    {
        static void Main(string[] args)
        {
            Presentation ppt = new Presentation();
            ppt.LoadFromFile("Sample.pptx");
            ISlide slide = ppt.Slides[0];
            for(int i = 0; i < slide.Shapes.Count; i++)
            {
                IShape shape = slide.Shapes[i] as IShape;
                if(shape is IChart)
                {
                    slide.Shapes.Remove(shape);
                }
            }
            ppt.SaveToFile("result.pptx", FileFormat.Pptx2010);
        }
    }
}
Imports Spire.Presentation
Imports Spire.Presentation.Charts

Namespace Remove_Chart_in_PowerPoint
	Class Program
		Private Shared Sub Main(args As String())
			Dim ppt As New Presentation()
			ppt.LoadFromFile("Sample.pptx")
			Dim slide As ISlide = ppt.Slides(0)
			For i As Integer = 0 To slide.Shapes.Count - 1
				Dim shape As IShape = TryCast(slide.Shapes(i), IShape)
				If TypeOf shape Is IChart Then
					slide.Shapes.Remove(shape)
				End If
			Next
			ppt.SaveToFile("result.pptx", FileFormat.Pptx2010)
		End Sub
	End Class
End Namespace
