
Knowledgebase (2417)
Children categories
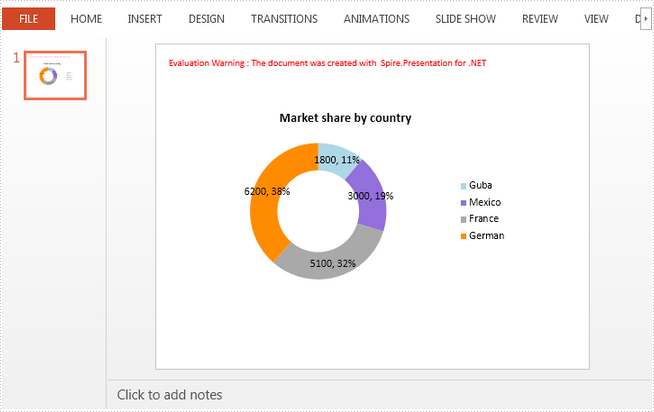
A doughnut chart (also spelled donut) is a variant of the pie chart, with a blank center allowing for additional information about the data as a whole to be included. In this article, you will learn how to create a doughnut chart in PowerPoint using Spire.Presentation.
Step 1: Initialize an instance of Presentation class.
Presentation presentation = new Presentation();
Step 2: Insert a Doughnut chart in the first slide and set the chart title.
RectangleF rect = new RectangleF(40, 100, 550, 320);
IChart chart = presentation.Slides[0].Shapes.AppendChart(ChartType.Doughnut, rect, false);
chart.ChartTitle.TextProperties.Text = "Market share by country";
chart.ChartTitle.TextProperties.IsCentered = true;
chart.ChartTitle.Height = 30;
Step 3: Define the chart data.
string[] countries = new string[] { "Guba", "Mexico","France","German" };
int[] sales = new int[] { 1800, 3000, 5100, 6200 };
chart.ChartData[0, 0].Text = "Countries";
chart.ChartData[0, 1].Text = "Sales";
for (int i = 0; i < countries.Length; ++i)
{
    chart.ChartData[i + 1, 0].Value = countries[i];
    chart.ChartData[i + 1, 1].Value = sales[i];
}
Step 4: Set the data range of category labels, series label and series values.
chart.Series.SeriesLabel = chart.ChartData["B1", "B1"];
chart.Categories.CategoryLabels = chart.ChartData["A2", "A5"];
chart.Series[0].Values = chart.ChartData["B2", "B5"];
Step 5: Add data points to series and fill each data point with different color.
for (int i = 0; i < chart.Series[0].Values.Count; i++)
{
    ChartDataPoint cdp = new ChartDataPoint(chart.Series[0]);
    cdp.Index = i;
    chart.Series[0].DataPoints.Add(cdp);
}
chart.Series[0].DataPoints[0].Fill.FillType = FillFormatType.Solid;
chart.Series[0].DataPoints[0].Fill.SolidColor.Color = Color.LightBlue;
chart.Series[0].DataPoints[1].Fill.FillType = FillFormatType.Solid;
chart.Series[0].DataPoints[1].Fill.SolidColor.Color = Color.MediumPurple;
chart.Series[0].DataPoints[2].Fill.FillType = FillFormatType.Solid;
chart.Series[0].DataPoints[2].Fill.SolidColor.Color = Color.DarkGray;
chart.Series[0].DataPoints[3].Fill.FillType = FillFormatType.Solid;
chart.Series[0].DataPoints[3].Fill.SolidColor.Color = Color.DarkOrange;
Step 6: Display value and percentage in data labels.
chart.Series[0].DataLabels.LabelValueVisible = true;
chart.Series[0].DataLabels.PercentValueVisible = true;
Step 7: Adjust the hole size of doughnut chart.
chart.Series[0].DoughnutHoleSize = 60;
Step 8: Save the file.
presentation.SaveToFile("DoughnutChart.pptx", FileFormat.Pptx2013);
Output:
Full Code:
using Spire.Presentation;
using Spire.Presentation.Charts;
using Spire.Presentation.Drawing;
using System.Drawing;

namespace SetFont
{
    class Program
    {
        static void Main(string[] args)
        {
            Presentation presentation = new Presentation();
            RectangleF rect = new RectangleF(40, 100, 550, 320);
            IChart chart = presentation.Slides[0].Shapes.AppendChart(ChartType.Doughnut, rect, false);
            chart.ChartTitle.TextProperties.Text = "Market share by country";
            chart.ChartTitle.TextProperties.IsCentered = true;
            chart.ChartTitle.Height = 30;

            string[] countries = new string[] { "Guba", "Mexico", "France", "German" };
            int[] sales = new int[] { 1800, 3000, 5100, 6200 };
            chart.ChartData[0, 0].Text = "Countries";
            chart.ChartData[0, 1].Text = "Sales";
            for (int i = 0; i < countries.Length; ++i)
            {
                chart.ChartData[i + 1, 0].Value = countries[i];
                chart.ChartData[i + 1, 1].Value = sales[i];
            }
            chart.Series.SeriesLabel = chart.ChartData["B1", "B1"];
            chart.Categories.CategoryLabels = chart.ChartData["A2", "A5"];
            chart.Series[0].Values = chart.ChartData["B2", "B5"];

            for (int i = 0; i < chart.Series[0].Values.Count; i++)
            {
                ChartDataPoint cdp = new ChartDataPoint(chart.Series[0]);
                cdp.Index = i;
                chart.Series[0].DataPoints.Add(cdp);
            }
            chart.Series[0].DataPoints[0].Fill.FillType = FillFormatType.Solid;
            chart.Series[0].DataPoints[0].Fill.SolidColor.Color = Color.LightBlue;
            chart.Series[0].DataPoints[1].Fill.FillType = FillFormatType.Solid;
            chart.Series[0].DataPoints[1].Fill.SolidColor.Color = Color.MediumPurple;
            chart.Series[0].DataPoints[2].Fill.FillType = FillFormatType.Solid;
            chart.Series[0].DataPoints[2].Fill.SolidColor.Color = Color.DarkGray;
            chart.Series[0].DataPoints[3].Fill.FillType = FillFormatType.Solid;
            chart.Series[0].DataPoints[3].Fill.SolidColor.Color = Color.DarkOrange;

            chart.Series[0].DataLabels.LabelValueVisible = true;
            chart.Series[0].DataLabels.PercentValueVisible = true;
            chart.Series[0].DoughnutHoleSize = 60;

            presentation.SaveToFile("DoughnutChart.pptx", FileFormat.Pptx2013);
        }
    }
}
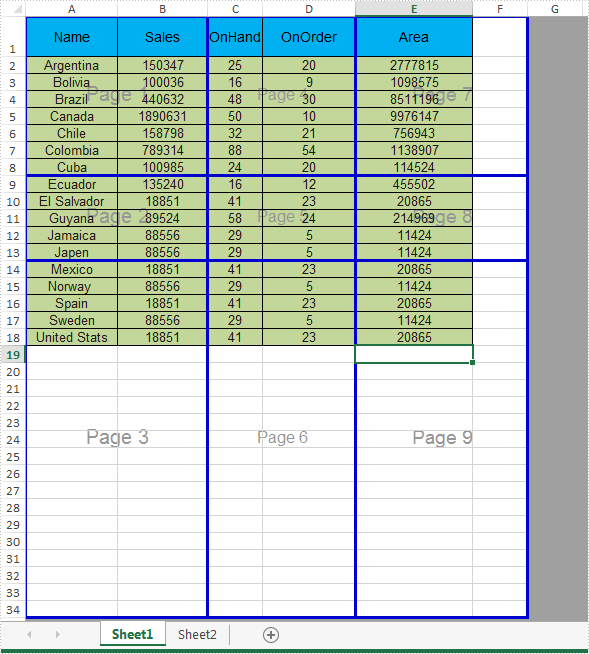
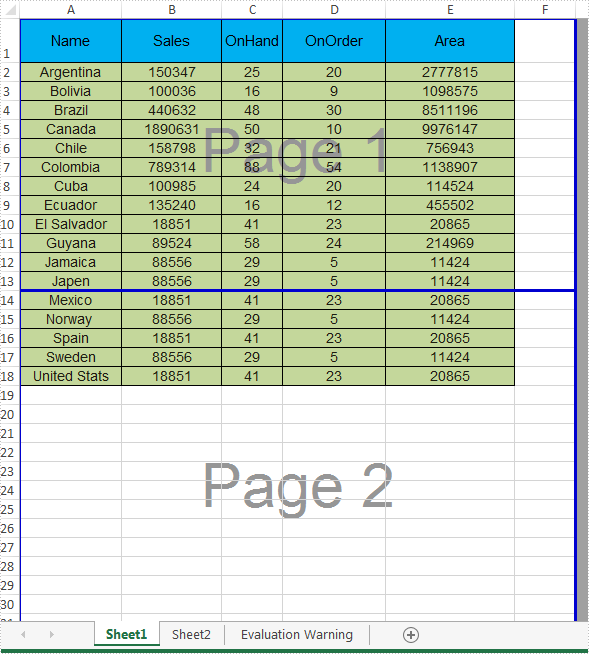
We have already demonstrated how to add page breaks in Excel worksheet in C# with the help of Spire.XLS. Spire.XLS supports to remove all the horizontal and vertical page breaks and it also supports to remove the special page breaks. Here comes to the steps of how to remove the page breaks from an Excel worksheet.
Firstly, view the same Excel document with horizontal page breaks and vertical page breaks:
Step 1: Initialize an instance of Workbook and load the document from file.
Workbook workbook = new Workbook();
workbook.LoadFromFile("Sample.xlsx");
Step 2: Get the first worksheet from the workbook.
Worksheet sheet = workbook.Worksheets[0];
Step 3: Clear all the vertical page breaks by call the VPageBreaks.Clear() method.
sheet.VPageBreaks.Clear();
Step 4: Remove the specified horizontal Page Break by call the HPageBreaks.RemoveAt() method.
sheet.HPageBreaks.RemoveAt(0);
Step 5: Set the ViewMode as Preview to see how the page breaks work.
sheet.ViewMode = ViewMode.Preview;
Step 6: Save the document to file.
workbook.SaveToFile("RemovePageBreak.xlsx", FileFormat.Version2010);
Effective screenshot of removing the page breaks in a worksheet:
Full codes:
using Spire.Xls;
namespace RemovePageBreak
{
    class Program
    {

        static void Main(string[] args)
        {
            Workbook workbook = new Workbook();
            workbook.LoadFromFile("Sample.xlsx");

            Worksheet sheet = workbook.Worksheets[0];

            //sheet.HPageBreaks.Clear();
            sheet.VPageBreaks.Clear();

            sheet.HPageBreaks.RemoveAt(0);


            sheet.ViewMode = ViewMode.Preview;

            workbook.SaveToFile("RemovePageBreak.xlsx", FileFormat.Version2010);
        }
    }
}
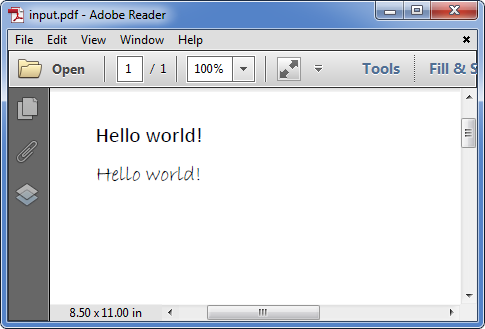
Spire.PDF supports the functionality to replace font(s) used in PDF document. The following parts shows how we can use Spire.PDF to replace all the fonts used in an existing PDF document with another alternate font in C# and VB.NET.
Screenshot before replacing font:
Code snippets:
Step 1: Instantiate an object of PdfDocument class and load the PDF document.
PdfDocument doc = new PdfDocument();
doc.LoadFromFile(@"E:\Program Files\input.pdf");
Step 2: Use the UsedFonts attribute of PdfDocument class to get all the fonts used in the document.
PdfUsedFont[] fonts = doc.UsedFonts;
Step 3: Create a new PDF font. Loop through the fonts and call PdfUsedFont.replace() method to replace them with the new font.
PdfFont newfont = new PdfFont(PdfFontFamily.TimesRoman, 11f, PdfFontStyle.Italic | PdfFontStyle.Bold);
foreach (PdfUsedFont font in fonts)
{
    font.Replace(newfont);
}
Step 4: Save the resultant document.
doc.SaveToFile("output.pdf");
Screenshot after replacing font:
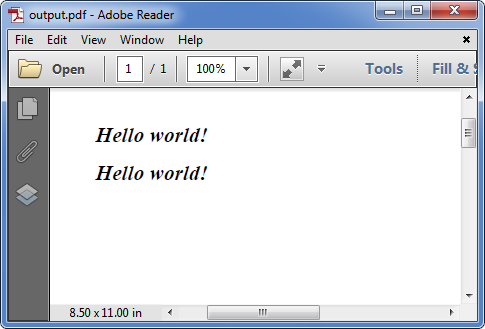
Full code:
using System.Drawing;
using Spire.Pdf;
using Spire.Pdf.Graphics;
using Spire.Pdf.Graphics.Fonts;

namespace Replace_font_in_PDF
{
    class Program
    {
        static void Main(string[] args)
        {
            PdfDocument doc = new PdfDocument();
            doc.LoadFromFile(@"E:\Program Files\input.pdf");
            PdfUsedFont[] fonts = doc.UsedFonts;
            PdfFont newfont = new PdfFont(PdfFontFamily.TimesRoman, 11f, PdfFontStyle.Italic | PdfFontStyle.Bold);
            foreach (PdfUsedFont font in fonts)
            {
                font.Replace(newfont);
            }

            doc.SaveToFile("output.pdf");
        }
    }
}
Imports System.Drawing
Imports Spire.Pdf
Imports Spire.Pdf.Graphics
Imports Spire.Pdf.Graphics.Fonts

Namespace Replace_font_in_PDF
	Class Program
		Private Shared Sub Main(args As String())
			Dim doc As New PdfDocument()
			doc.LoadFromFile("E:\Program Files\input.pdf")
			Dim fonts As PdfUsedFont() = doc.UsedFonts
			Dim newfont As New PdfFont(PdfFontFamily.TimesRoman, 11F, PdfFontStyle.Italic Or PdfFontStyle.Bold)
			For Each font As PdfUsedFont In fonts
				font.Replace(newfont)
			Next

			doc.SaveToFile("output.pdf")
		End Sub
	End Class
End Namespace
