
Knowledgebase (2344)
Children categories
Converting Excel worksheets into image formats like PNG or JPEG can be useful for sharing spreadsheet data in presentations, reports, or other documents. Unlike Excel files, image formats ensure that the formatting and structure remain consistent, regardless of the viewer’s software or platform. In this article, we will demonstrate how to convert Excel to images in React using Spire.XLS for JavaScript.
- Convert an Excel Worksheet to an Image
- Convert an Excel Worksheet to an Image without White Margins
- Convert a Specific Cell Range to an Image
Install Spire.XLS for JavaScript
To get started with converting Excel to images in a React application, you can either download Spire.XLS for JavaScript from our website or install it via npm with the following command:
npm i spire.office
The downloaded product package has been integrated Spire.Doc for JavaScript,Spire.XLS for JavaScript,Spire.PDF for JavaScript,Spire.Presentation for JavaScript. To use the functionality of Spire.XLS for JavaScript, you need to copy the corresponding files (spire.xls.js, Spire.Xls.Wasm.zip, spire.common.js, Spire.Common.Wasm.zip, and _framework) to the project's "public" folder. At the same time, in order to ensure text rendering, the related font files can be added with custom paths. In the following example, the font addition path is: public\static\font.
For more details, refer to the documentation: How to Integrate Spire.XLS for JavaScript in a React Project.
Convert an Excel Worksheet to an Image with JavaScript in React
Spire.XLS for JavaScript allows you to convert a worksheet into an image using the Worksheet.ToImage() function. Once the conversion is complete, you can save the image in formats such as PNG, JPG, or BMP with the Image.Save() function. The key steps are as follows.
- Load the font file to ensure correct text rendering.
- Create a Workbook object using the new wasmModule.Workbook() function.
- Load the Excel file using the Workbook.LoadFromFile() function.
- Get a specific worksheet using the Workbook.Worksheets.get(index) function.
- Convert the worksheet to an image using the Worksheet.ToImage() function.
- Save the image to a PNG file using the Image.Save() function (you can also save the image in other image formats such as JPG and BMP).
Code example:
- JavaScript
import React, { useState, useEffect } from 'react';
function App() {
  const [wasmModule, setWasmModule] = useState(null);
  // Load Spire.XLS
  useEffect(() => {
    (async () => {
      try {
        const publicUrl = process.env.PUBLIC_URL || '';
        const spireModule = await import(/* webpackIgnore: true */ `${publicUrl}/spire.xls.js`);
        const rawModule = spireModule.default || spireModule;
        window.wasmModule = typeof rawModule === 'function'
          ? await rawModule({ locateFile: p => p.endsWith('.wasm') ? `${publicUrl}/${p}` : p })
          : rawModule;
        setWasmModule(window.wasmModule);
      } catch (error) {
        console.error('Failed to load spire.xls.js WASM module:', error);
      }
    })();
  }, []);

  // Function to convert an Excel Worksheet to an Image
  const ExcelToImage = async () => {
    const wasmModule = window.wasmModule.spirexls;

    if (wasmModule) {
      // Load font into Virtual File System (VFS)
      await window.spire.FetchFileToVFS('Arial.ttf', '/Library/Fonts/', `${process.env.PUBLIC_URL}/static/font/`);

      // Load input file into Virtual File System (VFS)
      const inputFileName = 'ToPDF.xlsx';
      await window.spire.FetchFileToVFS(inputFileName, '', `${process.env.PUBLIC_URL}/static/data/`);

      // Create a new workbook
      const workbook = new wasmModule.Workbook();

      // Load existing Excel document
      workbook.LoadFromFile({ fileName: inputFileName });

      // Get the first worksheet
      let sheet = workbook.Worksheets.get(0);

      // Convert the sheet to an image
      let image = sheet.ToImage(sheet.FirstRow, sheet.FirstColumn, sheet.LastRow, sheet.LastColumn);

      // Specify the output image file path
      const outputFileName = 'SheetToImage.png';
      //Save the image
      image.Save(outputFileName);

      // Read the saved file and convert to Blob object
      const modifiedFileArray = window.dotnetRuntime.Module.FS.readFile(outputFileName);
      const modifiedFile = new Blob([modifiedFileArray], { type: 'image/png' });

      // Create a URL for the Blob and initiate download
      const url = URL.createObjectURL(modifiedFile);
      const a = document.createElement('a');
      a.href = url;
      a.download = outputFileName;
      document.body.appendChild(a);
      a.click();
      document.body.removeChild(a);
      URL.revokeObjectURL(url);

      // Clean up resources used by the workbook
      workbook.Dispose();
    }
  };

  return (
    <div style={{ textAlign: 'center', height: '300px' }}>
      <h1>Convert an Excel Worksheet to Image Using JavaScript in React</h1>
      <button onClick={ExcelToImage} disabled={!wasmModule}>
        Convert
      </button>
Run the code to launch the React app at localhost:3000. Once it's running, click on the "Convert" button to convert the specified Excel worksheet to image:
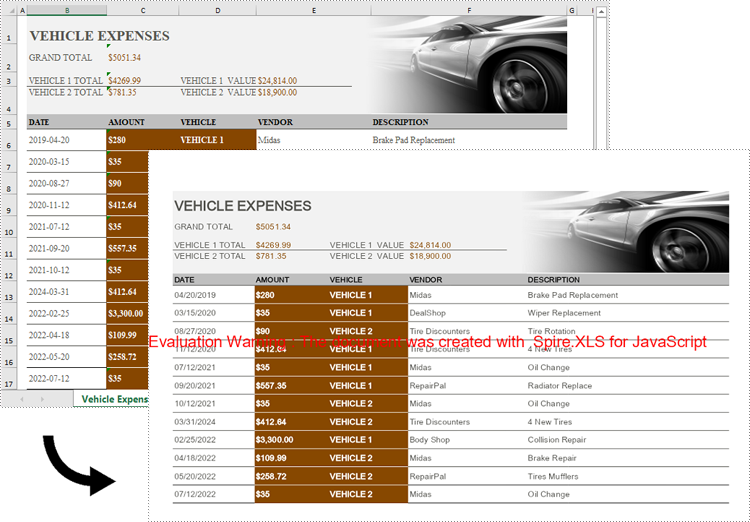
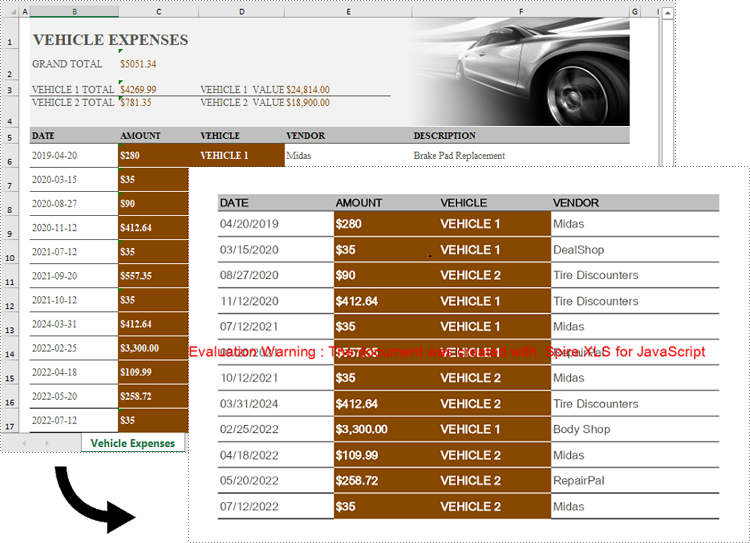
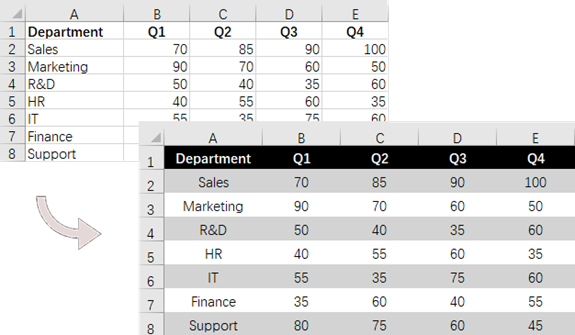
The below screenshot shows the input Excel worksheet and the converted image:
Convert an Excel Worksheet to an Image without White Margins with JavaScript in React
When converting an Excel worksheet to an image, the default output may include unnecessary white margins that can affect the appearance and usability of the image. If you want to remove these white margins, you can set the left, right, top, and bottom margins of the worksheet to zero. The key steps are as follows.
- Load the font file to ensure correct text rendering.
- Create a Workbook object using the new wasmModule.Workbook() function.
- Load the Excel file using the Workbook.LoadFromFile() function.
- Get a specific worksheet using the Workbook.Worksheets.get(index) function.
- Remove all margins from the worksheet by setting its left, right, top, and bottom margin values to zero using the Worksheet.PageSetup.TopMargin, Worksheet.PageSetup.BottomMargin, Worksheet.PageSetup.LeftMargin, and Worksheet.PageSetup.RightMargin properties.
- Convert the worksheet to an image using the Worksheet.ToImage() function.
- Save the image to a PNG file using the Image.Save() function.
Code example:
- JavaScript
import React, { useState, useEffect } from 'react';
function App() {
  const [wasmModule, setWasmModule] = useState(null);
  // Load Spire.XLS
  useEffect(() => {
    (async () => {
      try {
        const publicUrl = process.env.PUBLIC_URL || '';
        const spireModule = await import(/* webpackIgnore: true */ `${publicUrl}/spire.xls.js`);
        const rawModule = spireModule.default || spireModule;
        window.wasmModule = typeof rawModule === 'function'
          ? await rawModule({ locateFile: p => p.endsWith('.wasm') ? `${publicUrl}/${p}` : p })
          : rawModule;
        setWasmModule(window.wasmModule);
      } catch (error) {
        console.error('Failed to load spire.xls.js WASM module:', error);
      }
    })();
  }, []);

  // Function to convert an Excel Worksheet to an Image
  const ExcelToImage = async () => {
    const wasmModule = window.wasmModule.spirexls;

    if (wasmModule) {
      // Load font into Virtual File System (VFS)
      await window.spire.FetchFileToVFS('Arial.ttf', '/Library/Fonts/', `${process.env.PUBLIC_URL}/static/font/`);

      // Load input file into Virtual File System (VFS)
      const inputFileName = 'ToPDF.xlsx';
      await window.spire.FetchFileToVFS(inputFileName, '', `${process.env.PUBLIC_URL}/static/data/`);

      // Create a new workbook
      const workbook = new wasmModule.Workbook();

      // Load existing Excel document
      workbook.LoadFromFile({ fileName: inputFileName });

      // Get the first worksheet
      let sheet = workbook.Worksheets.get(0);

      // Set all margins of the worksheet to zero
      sheet.PageSetup.LeftMargin = 0;
      sheet.PageSetup.BottomMargin = 0;
      sheet.PageSetup.TopMargin = 0;
      sheet.PageSetup.RightMargin = 0;

      // Convert the sheet to image
      let image = sheet.ToImage(sheet.FirstRow, sheet.FirstColumn, sheet.LastRow, sheet.LastColumn);

      // Specify the output image file path
      const outputFileName = 'SheetToImageWithoutMargins.png';
      //Save the image
      image.Save(outputFileName);

      // Read the saved file and convert to Blob object
      const modifiedFileArray = window.dotnetRuntime.Module.FS.readFile(outputFileName);
      const modifiedFile = new Blob([modifiedFileArray], { type: 'image/png' });

      // Create a URL for the Blob and initiate download
      const url = URL.createObjectURL(modifiedFile);
      const a = document.createElement('a');
      a.href = url;
      a.download = outputFileName;
      document.body.appendChild(a);
      a.click();
      document.body.removeChild(a);
      URL.revokeObjectURL(url);

      // Clean up resources used by the workbook
      workbook.Dispose();
    }
  };

  return (
    <div style={{ textAlign: 'center', height: '300px' }}>
      <h1>Convert an Excel Worksheet to Image Using JavaScript in React</h1>
      <button onClick={ExcelToImage} disabled={!wasmModule}>
        Convert
      </button>
    </div>
  );
}

export default App;

Convert a Specific Cell Range to an Image with JavaScript in React
Converting a specific cell range to an image lets you highlight essential data, making it easy to share or embed without including unnecessary information. Spire.XLS for JavaScript enables you to convert a specific cell range from a worksheet into an image by providing the starting and ending row and column indices as parameters to the Worksheet.ToImage() function. The key steps are as follows.
- Load the font file to ensure correct text rendering.
- Create a Workbook object using the new wasmModule.Workbook() function.
- Load the Excel file using the Workbook.LoadFromFile() function.
- Get a specific worksheet using the Workbook.Worksheets.get(index) function.
- Convert a specific cell range of the worksheet to an image using the Worksheet.ToImage() function and pass the index of the start row, start column, end row, and end column of the cell range to the method as parameters.
- Save the image to a PNG file using the Image.Save() function
Code example:
- JavaScript
import React, { useState, useEffect } from 'react';
function App() {
  const [wasmModule, setWasmModule] = useState(null);
  // Load Spire.XLS
  useEffect(() => {
    (async () => {
      try {
        const publicUrl = process.env.PUBLIC_URL || '';
        const spireModule = await import(/* webpackIgnore: true */ `${publicUrl}/spire.xls.js`);
        const rawModule = spireModule.default || spireModule;
        window.wasmModule = typeof rawModule === 'function'
          ? await rawModule({ locateFile: p => p.endsWith('.wasm') ? `${publicUrl}/${p}` : p })
          : rawModule;
        setWasmModule(window.wasmModule);
      } catch (error) {
        console.error('Failed to load spire.xls.js WASM module:', error);
      }
    })();
  }, []);

  // Function to convert an Excel Worksheet to an Image
  const ExcelToImage = async () => {
    const wasmModule = window.wasmModule.spirexls;

    if (wasmModule) {
      // Load font into Virtual File System (VFS)
      await window.spire.FetchFileToVFS('Arial.ttf', '/Library/Fonts/', `${process.env.PUBLIC_URL}/static/font/`);

      // Load input file into Virtual File System (VFS)
      const inputFileName = 'ToPDF.xlsx';
      await window.spire.FetchFileToVFS(inputFileName, '', `${process.env.PUBLIC_URL}/static/data/`);

      // Create a new workbook
      const workbook = new wasmModule.Workbook();

      // Load existing Excel document
      workbook.LoadFromFile({ fileName: inputFileName });

      // Get the first worksheet
      let sheet = workbook.Worksheets.get(0);

      // Convert a specific cell range of the worksheet to image
      let image = sheet.ToImage(5, 2, 17, 5);

      // Specify the output image file path
      const outputFileName = 'CellRangeToImage.png';
      //Save the image
      image.Save(outputFileName);

      // Read the saved file and convert to Blob object
      const modifiedFileArray = window.dotnetRuntime.Module.FS.readFile(outputFileName);
      const modifiedFile = new Blob([modifiedFileArray], { type: 'image/png' });

      // Create a URL for the Blob and initiate download
      const url = URL.createObjectURL(modifiedFile);
      const a = document.createElement('a');
      a.href = url;
      a.download = outputFileName;
      document.body.appendChild(a);
      a.click();
      document.body.removeChild(a);
      URL.revokeObjectURL(url);

      // Clean up resources used by the workbook
      workbook.Dispose();
    }
  };

  return (
    <div style={{ textAlign: 'center', height: '300px' }}>
      <h1>Convert a Cell Range to Image Using JavaScript in React</h1>
      <button onClick={ExcelToImage} disabled={!wasmModule}>
        Convert
      </button>
    </div>
  );
}

export default App;
Get a Free License
To fully experience the capabilities of Spire.XLS for JavaScript without any evaluation limitations, you can request a free 30-day trial license.
In today's digital age, Excel documents have become essential tools for businesses, individuals, and organizations to manage data, analyze information, and share reports. However, manually editing Excel documents is not only time-consuming but also prone to errors. Fortunately, with the Spire.XLS library in Java, you can easily automate these tasks, improving efficiency and reducing mistakes.
This article will provide a comprehensive guide on how to use Spire.XLS for Java to edit Excel documents in Java, helping you master this powerful skill.
- Read and Write Excel Files in Java
- Apply Formatting to Excel Cells in Java
- Find and Replace Text in Excel in Java
- Add Formulas and Charts to Excel in Java
Install Spire.XLS for Java
First of all, you're required to add the Spire.Xls.jar file as a dependency in your Java program. The JAR file can be downloaded from this link. If you use Maven, you can easily import the JAR file in your application by adding the following code to your project's pom.xml file.
<repositories>
    <repository>
        <id>com.e-iceblue</id>
        <name>e-iceblue</name>
        <url>https://repo.e-iceblue.com/nexus/content/groups/public/</url>
    </repository>
</repositories>
<dependencies>
    <dependency>
        <groupId>e-iceblue</groupId>
        <artifactId>spire.xls</artifactId>
        <version>16.6.5</version>
    </dependency>
</dependencies>
Read and Write Excel Files in Java
One of the most common tasks when working with Excel files in Java is reading and writing data. Spire.XLS for Java simplifies this process with the CellRange.getValue() and CellRange.setValue() methods, allowing developers to easily retrieve and assign values to individual cells.
To read and write an Excel file using Java, follow these steps:
- Create a Workbook object.
- Load an Excel file from the specified file path.
- Access a specific worksheet using the Workbook.getWorksheets().get() method.
- Retrieve a specific cell using the Worksheet.getCellRange() method.
- Get the cell value with CellRange.getValue() and update it using CellRange.setValue().
- Save the workbook to a new Excel file.
- Java
import com.spire.xls.CellRange;
import com.spire.xls.ExcelVersion;
import com.spire.xls.Workbook;
import com.spire.xls.Worksheet;
public class ReadAndWriteExcel {
public static void main(String[] args) {
// Create a Workbook object
Workbook workbook = new Workbook();
// Load an Excel file
workbook.loadFromFile("C:\\Users\\Administrator\\Desktop\\Input.xlsx");
// Get a specific worksheet
Worksheet worksheet = workbook.getWorksheets().get(0);
// Get a specific cell
CellRange cell = worksheet.getCellRange("A1");
// Read the cell value
String text = cell.getValue();
// Determine if the cell value is "Department"
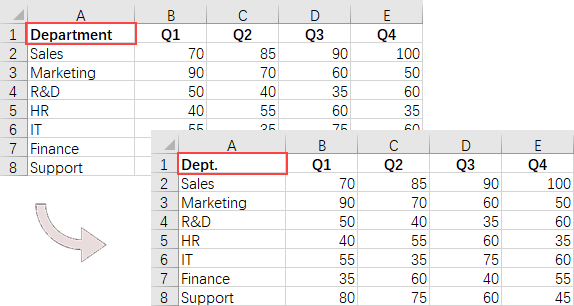
if (text.equals("Department"))
{
// Update the cell value
cell.setValue ("Dept.");
}
// Save the workbook to a different
workbook.saveToFile("ModifyExcel.xlsx", ExcelVersion.Version2016);
// Dispose resources
workbook.dispose();
}
}
Apply Formatting to Excel Cells in Java
Formatting Excel documents is essential for creating professional-looking reports. Spire.XLS for Java provides a range of APIs within the CellRange class to manage font styles, colors, cell backgrounds, and alignments, as well as to adjust row heights and column widths.
To apply styles and formats to Excel cells, follow these steps:
- Create a Workbook object.
- Load an Excel file from the specified file path.
- Access a specific worksheet using the Workbook.getWorksheets().get() method.
- Retrieve the allocated range of cells using the Worksheet.getAllocatedRange() method.
- Select a specific row using CellRange.getRows()[rowIndex], and customize the cell background color, text color, text alignment, and row height using methods from the CellRange object.
- Choose a specific column with CellRange.getColumns()[columnIndex], and set the column width using the setColumnWidth() method from the CellRange object.
- Save the workbook to a new Excel file.
- Java
import com.spire.xls.*;

import java.awt.*;

public class ApplyFormatting {

    public static void main(String[] args) {

        // Create a Workbook object
        Workbook workbook = new Workbook();

        // Load an Excel file
        workbook.loadFromFile("C:\\Users\\Administrator\\Desktop\\Input.xlsx");

        // Get a specific worksheet
        Worksheet worksheet = workbook.getWorksheets().get(0);

        // Get all located range from the worksheet
        CellRange allocatedRange = worksheet.getAllocatedRange();

        // Iterate through the rows
        for (int rowNum = 0; rowNum < allocatedRange.getRowCount(); rowNum++) {
            if (rowNum == 0) {

                // Apply cell color to the header row
                allocatedRange.getRows()[rowNum].getStyle().setColor(Color.black);

                // Change the font color of the header row
                allocatedRange.getRows()[rowNum].getStyle().getFont().setColor(Color.white);
            }

            // Apply alternate colors to other rows
            else if (rowNum % 2 == 1) {
                allocatedRange.getRows()[rowNum].getStyle().setColor(Color.lightGray);
            } else if (rowNum % 2 == 0) {
                allocatedRange.getRows()[rowNum].getStyle().setColor(Color.white);
            }

            // Align text to center
            allocatedRange.getRows()[rowNum].setHorizontalAlignment(HorizontalAlignType.Center);
            allocatedRange.getRows()[rowNum].setVerticalAlignment(VerticalAlignType.Center);

            // Set the row height
            allocatedRange.getRows()[rowNum].setRowHeight(20);
        }

        // Iterate through the columns
        for (int columnNum = 0; columnNum < allocatedRange.getColumnCount(); columnNum++) {

            // Set the column width
            if (columnNum > 0) {
                allocatedRange.getColumns()[columnNum].setColumnWidth(10);
            }
        }

        // Save the workbook to a different
        workbook.saveToFile("FormatExcel.xlsx", ExcelVersion.Version2016);

        // Dispose resources
        workbook.dispose();
    }
}
Find and Replace Text in Excel in Java
The find and replace feature streamlines data management and enhances productivity by simplifying updates and corrections. With Spire.XLS for Java, you can quickly locate a cell containing a specific string using the Worksheet.findString() method and replace its value with the CellRange.setValue() method.
To find and replace text in Excel using Java, follow these steps:
- Create a Workbook object.
- Load an Excel file from the specified file path.
- Access a specific worksheet using the Workbook.getWorksheets().get() method.
- Locate the cell containing the specified string with Worksheet.findString().
- Update the cell's value using the CellRange.setValue() method.
- Save the workbook to a different Excel file.
- Java
import com.spire.xls.CellRange;
import com.spire.xls.ExcelVersion;
import com.spire.xls.Workbook;
import com.spire.xls.Worksheet;

public class FindAndReplace {

    public static void main(String[] args) {

        // Create a Workbook object
        Workbook workbook = new Workbook();

        // Load an Excel file
        workbook.loadFromFile("C:\\Users\\Administrator\\Desktop\\Input4.xlsx");

        // Get a specific worksheet
        Worksheet worksheet = workbook.getWorksheets().get(0);

        // Define an array of department names for replacement
        String[] departments = new String[] { "Sales", "Marketing", "R&D", "HR", "IT", "Finance", "Support" };

        // Define an array of placeholders that will be replaced in the Excel sheet
        String[] placeholders = new String[] { "#dept_one", "#dept_two", "#dept_three", "#dept_four", "#dept_five", "#dept_six", "#dept_seven" };

        // Iterate through the placeholder strings
        for (int i = 0; i < placeholders.length; i++)
        {
            // Find the cell containing the current placeholder string
            CellRange cell = worksheet.findString(placeholders[i], false, false);

            // Replace the text in the found cell with the corresponding department name
            cell.setValue(departments[i]);
        }

        // Save the workbook to a different
        workbook.saveToFile("ReplaceText.xlsx", ExcelVersion.Version2016);

        // Dispose resources
        workbook.dispose();
    }
}

Add Formulas and Charts to Excel in Java
Besides basic file operations, Spire.XLS for Java offers a range of advanced techniques for working with Excel files. These methods allow you to automate complex tasks, perform calculations, and create dynamic reports.
To add formulas and create a chart in Excel using Java, follow these steps:
- Create a Workbook object.
- Load an Excel file from the specified file path.
- Access a specific worksheet using the Workbook.getWorksheets().get() method.
- Select a specific cell with the Worksheet.getRange().get() method.
- Insert a formula into the cell using the CellRange.setFormula() method.
- Add a column chart to the worksheet with the Worksheet.getCharts().add() method.
- Configure the chart's data range, position, title, and other attributes using methods from the Chart object.
- Save the workbook to a different Excel file.
- Java
import com.spire.xls.*;

public class AddFormulaAndChart {

    public static void main(String[] args) {

        // Create a Workbook object
        Workbook workbook = new Workbook();

        // Load an Excel file
        workbook.loadFromFile("C:\\Users\\Administrator\\Desktop\\Input.xlsx");

        // Get a specific worksheet
        Worksheet worksheet = workbook.getWorksheets().get(0);

        // Get all located range
        CellRange allocatedRange = worksheet.getAllocatedRange();

        // Iterate through the rows
        for (int rowNum = 0; rowNum < allocatedRange.getRowCount(); rowNum++) {
            if (rowNum == 0) {
                // Write text in cell G1
                worksheet.getRange().get(rowNum + 1, 6).setText("Total");

                // Apply style to the cell
                worksheet.getRange().get(rowNum + 1, 6).getStyle().getFont().isBold(true);
                worksheet.getRange().get(rowNum + 1, 6).getStyle().setHorizontalAlignment(HorizontalAlignType.Right);
            } else {
                // Add formulas to the cells from G2 to G8
                worksheet.getRange().get(rowNum + 1, 6).setFormula("=SUM(B" + (rowNum + 1) + ":E" + (rowNum + 1) + ")");
            }

        }

        // Add a clustered column chart
        Chart chart = worksheet.getCharts().add(ExcelChartType.ColumnClustered);

        // Set data range for the chart
        chart.setDataRange(worksheet.getCellRange("A1:E8"));
        chart.setSeriesDataFromRange(false);

        // Set position of the chart
        chart.setLeftColumn(1);
        chart.setTopRow(10);
        chart.setRightColumn(8);
        chart.setBottomRow(23);

        // Set and format chart title
        chart.setChartTitle("Sales by Department per Quarter");
        chart.getChartTitleArea().setSize(13);
        chart.getChartTitleArea().isBold(true);

        // Save the workbook to a different
        workbook.saveToFile("AddFormulaAndChart.xlsx", ExcelVersion.Version2016);

        // Dispose resources
        workbook.dispose();
    }
}

Apply for a Temporary License
If you'd like to remove the evaluation message from the generated documents, or to get rid of the function limitations, please request a 30-day trial license for yourself.
Spire.XLS for JavaScript is an independent Word API that allows developers to integrate Microsoft Word document creation capabilities into their JavaScript applications, without installing Microsoft Word on either development or target systems.
Spire.XLS for JavaScript is fully compatible with popular frameworks such as Vue, React, Angular, and JavaScript, enabling developers to create and distribute their own JavaScript applications seamlessly across the web.
This versatile JavaScript Excel API operates independently, with no reliance on Microsoft Office Excel. Spire.XLS for JavaScript supports both the legacy Excel 97-2003 format (.xls) and the most recent Excel versions, including Excel 2007, 2010, 2013, 2016, and 2019 (.xlsx, .xlsb, .xlsm), as well as Open Office (.ods) format.
