Add or Remove Excel AutoFilters with JavaScript in React
During daily Excel data processing, filtering is one of the most common ways to quickly locate and view target data. The AutoFilter feature allows users to quickly filter out data rows that match the conditions by clicking the drop-down arrow on the column header, avoiding the need to search manually through large amounts of data. Spire.XLS for JavaScript, powered by WebAssembly, completes this operation directly in the browser, managing input and output files through a Virtual File System (VFS) with no backend service required.
This article covers three key features:
For installation and project configuration, please refer to How to Integrate Spire.XLS for JavaScript in a React Project. The examples below assume that Spire.XLS is already installed and the WebAssembly module has been initialized.
Add AutoFilters
In Excel, the AutoFilter is an important feature for quickly processing large amounts of data. Through the drop-down arrow on the right side of the column header, you can set filter conditions for each column. Spire.XLS for JavaScript provides the AutoFilters.Range property — you can add AutoFilters to a worksheet simply by setting the worksheet's auto-filter range to the cell range of the header row.
function App() {
  const addAutoFilter = async () => {
    // Get the Spire.XLS WASM module
    const xlsModule = window.wasmModule?.spirexls;

    // Check if the module is ready
    if (!xlsModule) {
      alert('Spire.Xls is not ready yet');
      return;
    }

    // Load the font and Excel file into VFS
    await window.spire.FetchFileToVFS('ARIAL.TTF', '/Library/Fonts/', `${process.env.PUBLIC_URL}/font/`);
    const inputFileName = 'FilterData.xlsx';
    await window.spire.FetchFileToVFS(inputFileName, '', `${process.env.PUBLIC_URL}data/`);

    // Load the workbook
    const workbook = new xlsModule.Workbook();
    workbook.LoadFromFile({ fileName: inputFileName });

    // Get the first worksheet
    const sheet = workbook.Worksheets.get(0);

    // Set the auto filter range: columns A to C of the header row
    sheet.AutoFilters.Range = sheet.Range.get("A1:C1");

    // Save the result file, specifying Excel version 2016
    const outputFileName = "AddAutoFilter_output.xlsx";
    workbook.SaveToFile({ fileName: outputFileName, version: xlsModule.ExcelVersion.Version2016 });

    // Dispose of the workbook object to release resources
    workbook.Dispose();

    // Read the converted file from VFS and trigger the download
    const fileArray = window.dotnetRuntime.Module.FS.readFile(outputFileName);
    const blob = new Blob([fileArray], { type: "application/vnd.openxmlformats-officedocument.spreadsheetml.sheet" });
    const url = URL.createObjectURL(blob);
    const a = document.createElement('a');
    a.href = url;
    a.download = outputFileName;
    a.click();
    URL.revokeObjectURL(url);
  };

  return (
    <div style={{ textAlign: 'center', height: '300px' }}>
      <h1>Add AutoFilter</h1>
      <button onClick={addAutoFilter}>
        Start
      </button>
    </div>
  );
}

export default App;
Add AutoFilters 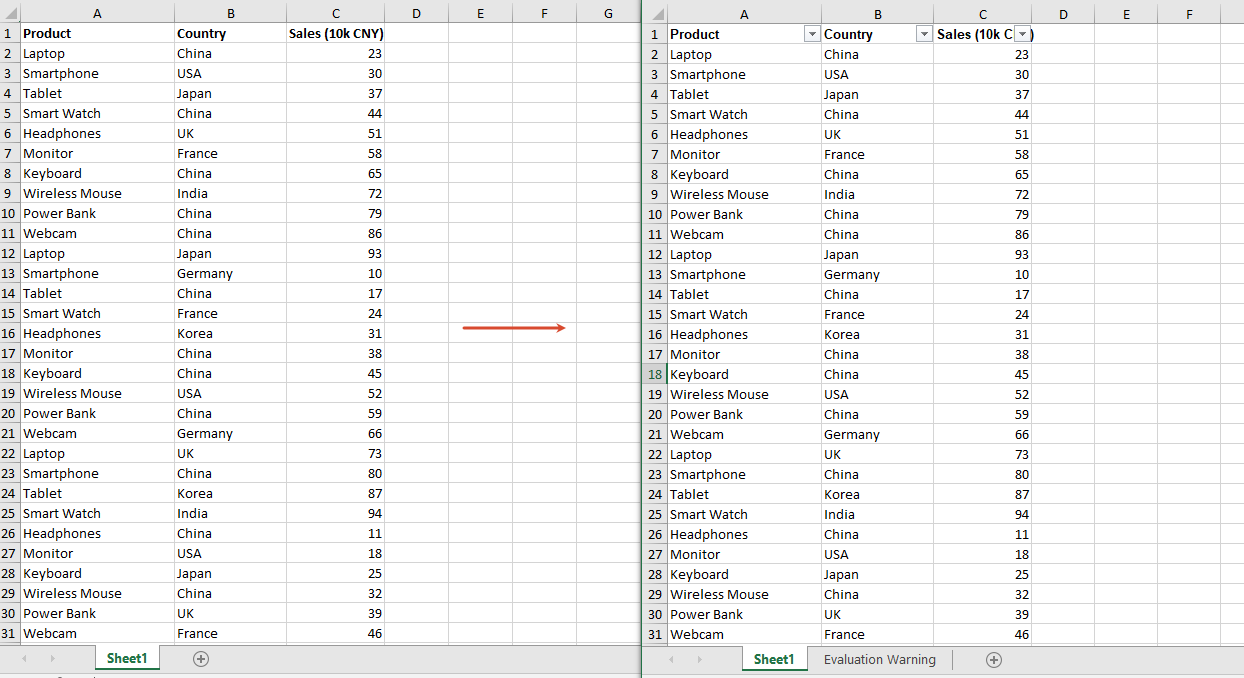
Apply Filter Conditions to Filter Data
After adding AutoFilters, you can also set a custom filter condition for a specified column through the CustomFilter method in code, and then call the Filter method to apply the filter, so that data rows matching the condition are automatically filtered out. For example, the following code sets the filter condition of the second column (Country) to equal "China"; after applying the filter, only data rows whose country is "China" are kept, and the remaining rows are hidden.
function App() {
  const applyFilter = async () => {
    // Get the Spire.XLS WASM module
    const xlsModule = window.wasmModule?.spirexls;

    // Check if the module is ready
    if (!xlsModule) {
      alert('Spire.Xls is not ready yet');
      return;
    }

    // Load the font and Excel file into VFS
    await window.spire.FetchFileToVFS('ARIAL.TTF', '/Library/Fonts/', `${process.env.PUBLIC_URL}/font/`);
    const inputFileName = 'FilterData.xlsx';
    await window.spire.FetchFileToVFS(inputFileName, '', `${process.env.PUBLIC_URL}data/`);

    // Load the workbook
    const workbook = new xlsModule.Workbook();
    workbook.LoadFromFile({ fileName: inputFileName });

    // Get the first worksheet
    const sheet = workbook.Worksheets.get(0);

    // Set the auto filter range: the header and data rows of the second column (Country)
    sheet.AutoFilters.Range = sheet.Range.get("B1:B51");

    // Get the first column of the auto filters
    const filterColumn = sheet.AutoFilters.get(0);

    // Set the custom filter condition: filter rows whose country is "China"
    const strCrt = "China";
    sheet.AutoFilters.CustomFilter({
      column: filterColumn,
      operatorType: xlsModule.FilterOperatorType.Equal,
      criteria: new xlsModule.String(strCrt)
    });

    // Apply the filter
    sheet.AutoFilters.Filter();

    // Save the result file, specifying Excel version 2016
    const outputFileName = "ApplyFilter_output.xlsx";
    workbook.SaveToFile({ fileName: outputFileName, version: xlsModule.ExcelVersion.Version2016 });

    // Dispose of the workbook object to release resources
    workbook.Dispose();

    // Read the converted file from VFS and trigger the download
    const fileArray = window.dotnetRuntime.Module.FS.readFile(outputFileName);
    const blob = new Blob([fileArray], { type: "application/vnd.openxmlformats-officedocument.spreadsheetml.sheet" });
    const url = URL.createObjectURL(blob);
    const a = document.createElement('a');
    a.href = url;
    a.download = outputFileName;
    a.click();
    URL.revokeObjectURL(url);
  };

  return (
    <div style={{ textAlign: 'center', height: '300px' }}>
      <h1>Apply Filter Condition</h1>
      <button onClick={applyFilter}>
        Start
      </button>
    </div>
  );
}

export default App;
Apply Filter Conditions to Filter Data 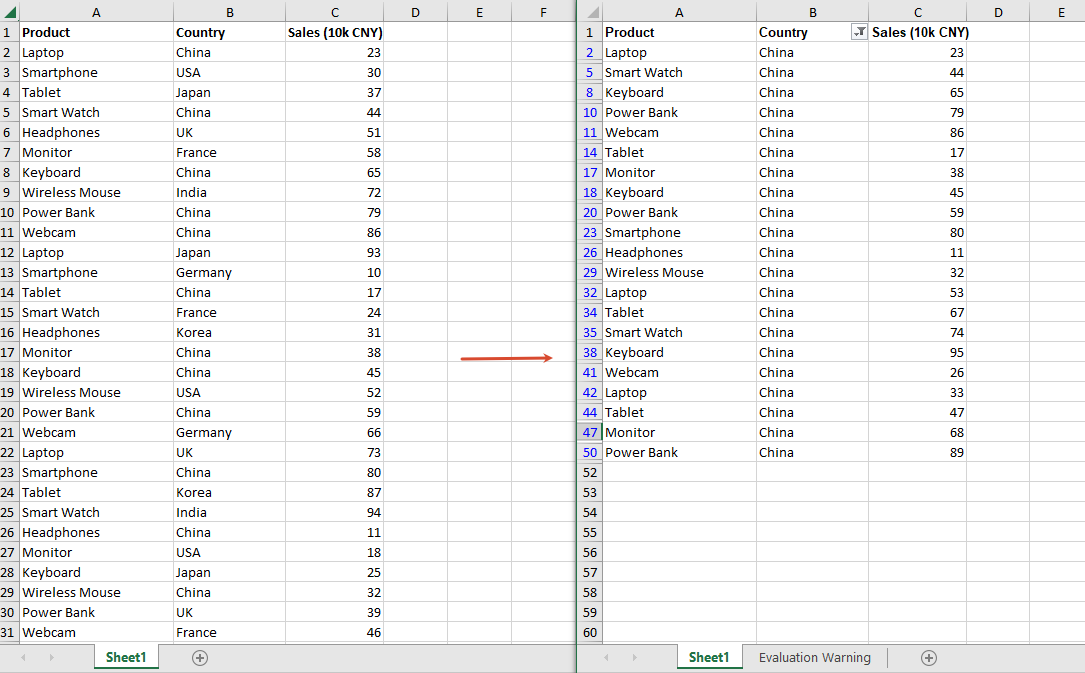
Remove AutoFilters
When you no longer need to filter data, you can remove all AutoFilters from the worksheet through the AutoFilters.Clear method, so that the data is fully displayed again.
function App() {
  const removeAutoFilter = async () => {
    // Get the Spire.XLS WASM module
    const xlsModule = window.wasmModule?.spirexls;

    // Check if the module is ready
    if (!xlsModule) {
      alert('Spire.Xls is not ready yet');
      return;
    }

    // Load the font and Excel file into VFS
    await window.spire.FetchFileToVFS('ARIAL.TTF', '/Library/Fonts/', `${process.env.PUBLIC_URL}/font/`);
    const inputFileName = 'FilteredData.xlsx';
    await window.spire.FetchFileToVFS(inputFileName, '', `${process.env.PUBLIC_URL}data/`);

    // Load the workbook
    const workbook = new xlsModule.Workbook();
    workbook.LoadFromFile({ fileName: inputFileName });

    // Get the first worksheet
    const sheet = workbook.Worksheets.get(0);

    // Remove all AutoFilters from the worksheet
    sheet.AutoFilters.Clear();

    // Save the result file, specifying Excel version 2016
    const outputFileName = "RemoveAutoFilter_output.xlsx";
    workbook.SaveToFile({ fileName: outputFileName, version: xlsModule.ExcelVersion.Version2016 });

    // Dispose of the workbook object to release resources
    workbook.Dispose();

    // Read the converted file from VFS and trigger the download
    const fileArray = window.dotnetRuntime.Module.FS.readFile(outputFileName);
    const blob = new Blob([fileArray], { type: "application/vnd.openxmlformats-officedocument.spreadsheetml.sheet" });
    const url = URL.createObjectURL(blob);
    const a = document.createElement('a');
    a.href = url;
    a.download = outputFileName;
    a.click();
    URL.revokeObjectURL(url);
  };

  return (
    <div style={{ textAlign: 'center', height: '300px' }}>
      <h1>Remove AutoFilter</h1>
      <button onClick={removeAutoFilter}>
        Start
      </button>
    </div>
  );
}

export default App;
Remove AutoFilters 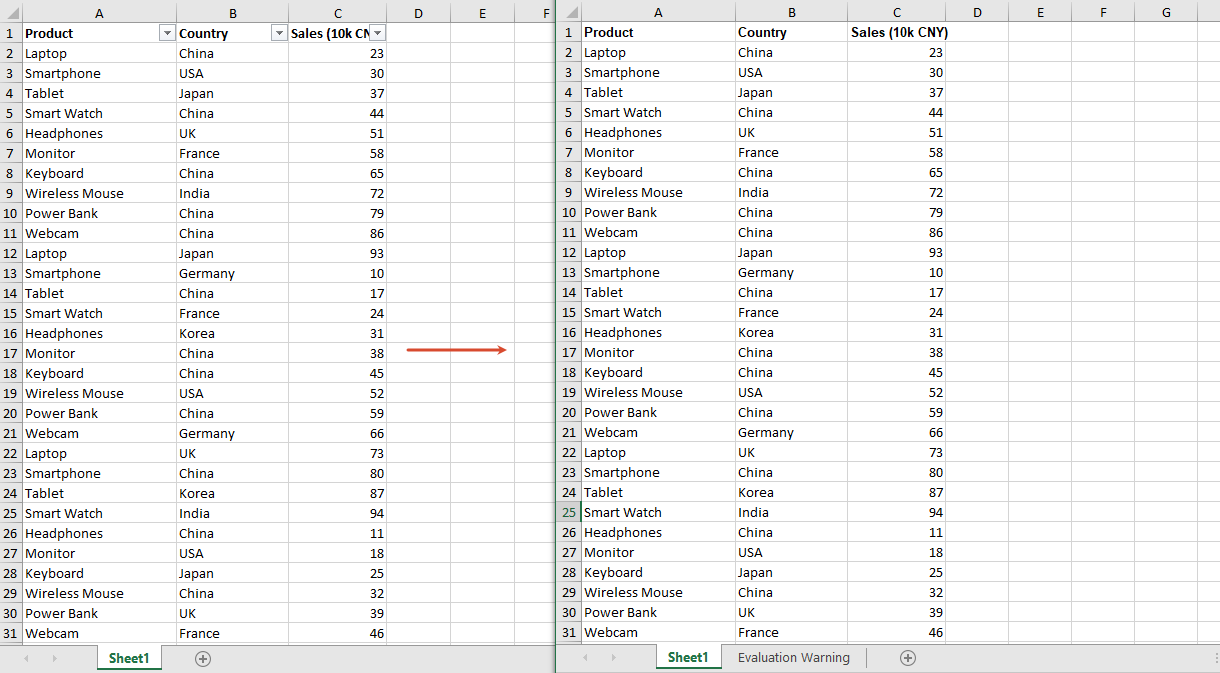
Frequently Asked Questions
Data rows are not hidden after filtering
Reason: The Filter() method was not called to apply the filter after the filter condition was set, or the range set by AutoFilters.Range does not cover the data rows you want to filter.
Solution: Call sheet.AutoFilters.Filter() after setting the filter condition, and make sure AutoFilters.Range covers the header row and all data rows, for example "B1:B51" in the example above.
Filtering by Chinese content fails
Reason: The filter condition is an exact match. If the filter value does not exactly match the cell content (for example, it contains leading or trailing spaces), it will not match.
Solution: Make sure the filter value exactly matches the cell content.
Get a Free License
If you wish to remove the evaluation message from the result documents, or get rid of the feature limitations, please contact sales to get a 30-day temporary license.
How to Split PDF Documents Using JavaScript in React
Splitting PDF documents is a common requirement in web applications. For example, you may need to divide a long report into single-page files, extract the cover page separately, or separate the first page from the remaining pages for further processing. Instead of uploading files to a server, you can perform these operations directly in a React application with JavaScript.
Spire.PDF for JavaScript enables developers to load, manipulate, and save PDF documents in browser-based applications. It works with WebAssembly and a virtual file system, allowing PDF files to be processed on the client side.
This article demonstrates how to split PDF documents using JavaScript in React with Spire.PDF for JavaScript.
Install Spire.PDF for JavaScript in a React Project
Open a terminal in the root directory of your React project and install the spire.office package:
npm i spire.office
After the installation is complete, copy the following runtime files and folder from the installed package to the React project's public folder:
public/
├── _framework/
├── spire.pdf.js
├── Spire.Pdf.Wasm.zip
├── spire.common.js
└── Spire.Common.Wasm.zip
The JavaScript loader, WebAssembly resources, and supporting framework files must remain accessible as static assets when the application runs. For detailed setup instructions and the exact integration process, see How to Integrate Spire.PDF for JavaScript in a React Project.
In the examples below, the PDF file to be split is named input.pdf. Place this file in the public folder as well, so that it can be loaded in the React application.
public/
├── input.pdf
└── ...
Split a PDF into Individual Files by Page in JavaScript
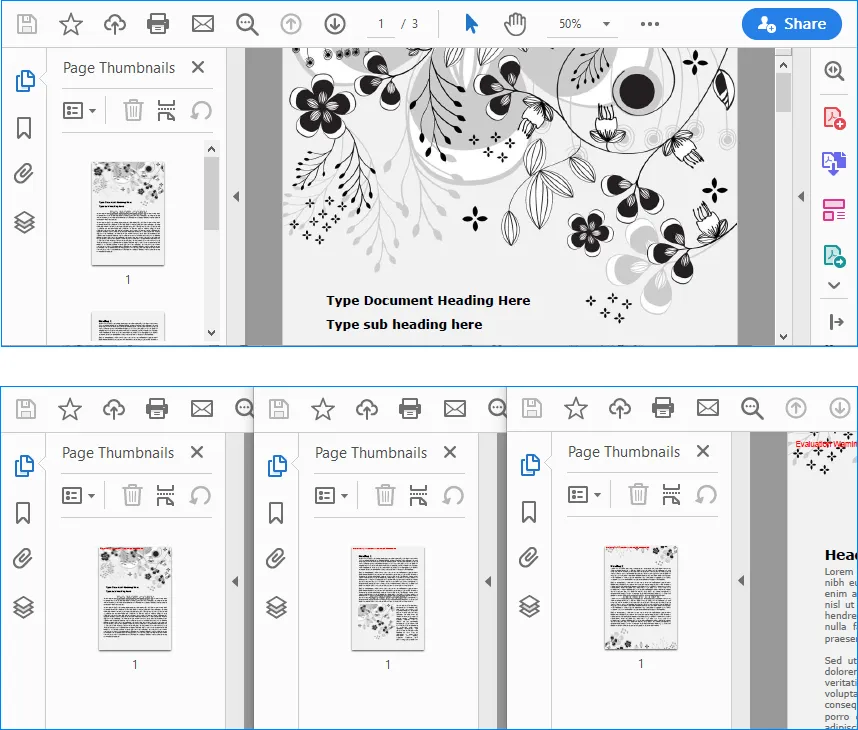
If you want to split a PDF document into multiple single-page PDF files, you can use the Split() method. This method separates the original PDF into individual documents and saves each page as a new PDF file.
The following example loads input.pdf, splits it page by page, and downloads each generated PDF file in the browser.
import React, { useState, useEffect } from 'react';

function App() {
  const [wasmModule, setWasmModule] = useState(null);

  useEffect(() => {
    (async () => {
      const publicUrl = process.env.PUBLIC_URL || '';
      const spireModule = await import(/* webpackIgnore: true */ `${publicUrl}/spire.pdf.js`);
      const rawModule = spireModule.default || spireModule;
      window.wasmModule = typeof rawModule === 'function'
        ? await rawModule({ locateFile: p => p.endsWith('.wasm') ? `${publicUrl}/${p}` : p })
        : rawModule;
      setWasmModule(window.wasmModule);
    })();
  }, []);

  const loadPdfToVfs = async (fileName) => {
    const publicUrl = process.env.PUBLIC_URL || '';
    const response = await fetch(`${publicUrl}/${fileName}`);
    const fileBytes = new Uint8Array(await response.arrayBuffer());
    window.dotnetRuntime.Module.FS.writeFile(fileName, fileBytes, { flags: 'w+' });
    return fileName;
  };

  const SplitPdf = async () => {
    const wasmModule = window.wasmModule?.spirepdf;
    if (!wasmModule) return;

    const inputFile = await loadPdfToVfs('input.pdf');

    const doc = new wasmModule.PdfDocument();
    doc.LoadFromFile(inputFile);

    const pageCount = doc.Pages.Count;
    const outFileName = 'SplitDocument_result-{0}.pdf';
    doc.Split(outFileName);

    for (let i = 0; i < pageCount; i++) {
      const splitFileName = `SplitDocument_result-${i}.pdf`;
      const fileArray = window.dotnetRuntime.Module.FS.readFile(splitFileName);
      const file = new Blob([fileArray], { type: 'application/pdf' });
      const url = URL.createObjectURL(file);
      const a = document.createElement('a');
      a.href = url;
      a.download = splitFileName;
      document.body.appendChild(a);
      a.click();
      document.body.removeChild(a);
      URL.revokeObjectURL(url);
    }
  };

  return (
    <div style={{ textAlign: 'center', height: '300px' }}>
      <h1>Split PDF Documents in React</h1>
      <button onClick={SplitPdf} disabled={!wasmModule}>
        Split PDF
      </button>
    </div>
  );
}

export default App;
Output:
Code Explanation
The code first imports and initializes the Spire.PDF WebAssembly module when the React component is mounted.
const spireModule = await import(/* webpackIgnore: true */ `${publicUrl}/spire.pdf.js`);
Then, the loadPdfToVfs() function loads input.pdf from the public folder and writes it into the virtual file system:
window.dotnetRuntime.Module.FS.writeFile(fileName, fileBytes, { flags: 'w+' });
After the PDF file is loaded, a PdfDocument object is created and the source PDF is opened:
const doc = new wasmModule.PdfDocument();
doc.LoadFromFile(inputFile);
The Split() method splits the PDF document into separate PDF files. The {0} placeholder in the output file name is replaced by the page index:
const outFileName = 'SplitDocument_result-{0}.pdf';
doc.Split(outFileName);
Finally, the generated PDF files are read from the virtual file system, converted into Blob objects, and downloaded in the browser.
Split a PDF by Page Range in JavaScript
In some cases, you may not want to split every page into a separate file. Instead, you may want to extract one page as an individual PDF and save the remaining pages as another PDF. This can be done by creating new PdfDocument objects and inserting selected pages from the source document.
The following example splits input.pdf into two files:
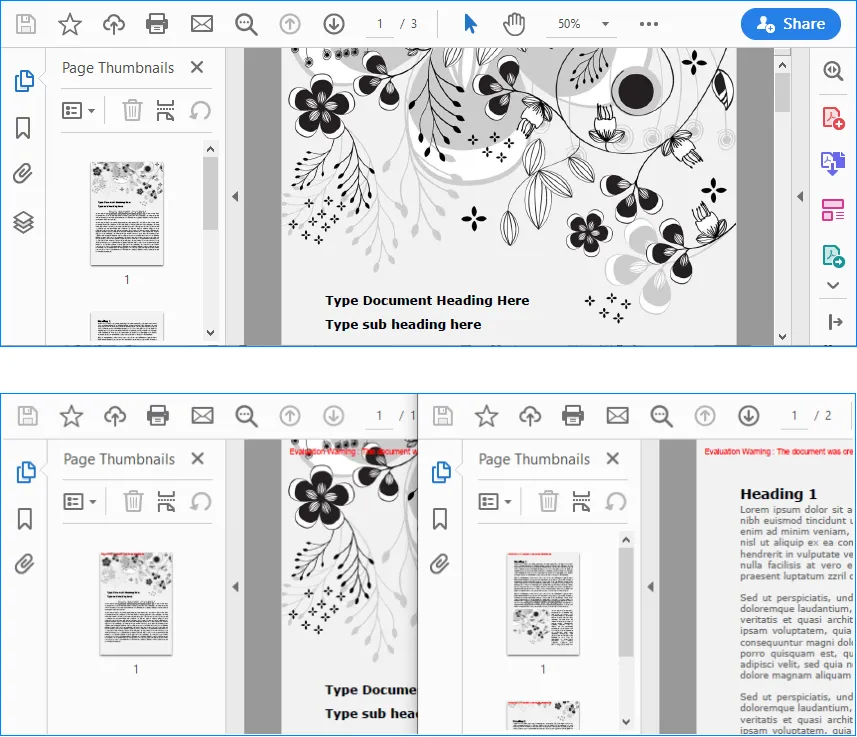
Split-1.pdf: contains the first pageSplit-2.pdf: contains the remaining pages
import React, { useState, useEffect } from 'react';

function App() {
  const [wasmModule, setWasmModule] = useState(null);

  useEffect(() => {
    (async () => {
      const publicUrl = process.env.PUBLIC_URL || '';
      const spireModule = await import(/* webpackIgnore: true */ `${publicUrl}/spire.pdf.js`);
      const rawModule = spireModule.default || spireModule;
      window.wasmModule = typeof rawModule === 'function'
        ? await rawModule({ locateFile: p => p.endsWith('.wasm') ? `${publicUrl}/${p}` : p })
        : rawModule;
      setWasmModule(window.wasmModule);
    })();
  }, []);

  const loadPdfToVfs = async (fileName) => {
    const publicUrl = process.env.PUBLIC_URL || '';
    const response = await fetch(`${publicUrl}/${fileName}`);
    const fileBytes = new Uint8Array(await response.arrayBuffer());
    window.dotnetRuntime.Module.FS.writeFile(fileName, fileBytes, { flags: 'w+' });
    return fileName;
  };

  const SplitPdf = async () => {
    const wasmModule = window.wasmModule?.spirepdf;
    if (!wasmModule) return;

    const inputFile = await loadPdfToVfs('input.pdf');

    const doc = new wasmModule.PdfDocument();
    doc.LoadFromFile(inputFile);

    const newDoc1 = new wasmModule.PdfDocument();
    const newDoc2 = new wasmModule.PdfDocument();

    newDoc1.InsertPage(doc, 0);
    newDoc2.InsertPageRange(doc, 1, doc.Pages.Count - 1);

    newDoc1.SaveToFile('Split-1.pdf');
    newDoc2.SaveToFile('Split-2.pdf');

    for (const splitFileName of ['Split-1.pdf', 'Split-2.pdf']) {
      const fileArray = window.dotnetRuntime.Module.FS.readFile(splitFileName);
      const file = new Blob([fileArray], { type: 'application/pdf' });
      const url = URL.createObjectURL(file);
      const a = document.createElement('a');
      a.href = url;
      a.download = splitFileName;
      document.body.appendChild(a);
      a.click();
      document.body.removeChild(a);
      URL.revokeObjectURL(url);
    }
  };

  return (
    <div style={{ textAlign: 'center', height: '300px' }}>
      <h1>Split PDF Documents in React</h1>
      <button onClick={SplitPdf} disabled={!wasmModule}>
        Split PDF
      </button>
    </div>
  );
}

export default App;
Output:
Code Explanation
This example also starts by loading the source PDF file into the virtual file system and opening it with PdfDocument.
const doc = new wasmModule.PdfDocument();
doc.LoadFromFile(inputFile);
Then, two new PDF documents are created:
const newDoc1 = new wasmModule.PdfDocument();
const newDoc2 = new wasmModule.PdfDocument();
The first page of the source PDF is inserted into newDoc1:
newDoc1.InsertPage(doc, 0);
The remaining pages are inserted into newDoc2 with InsertPageRange():
newDoc2.InsertPageRange(doc, 1, doc.Pages.Count - 1);
Here, page indexes are zero-based. The number 1 means the second page of the original PDF, and doc.Pages.Count - 1 means all remaining pages after the first page.
After inserting the selected pages, the two new PDF documents are saved:
newDoc1.SaveToFile('Split-1.pdf');
newDoc2.SaveToFile('Split-2.pdf');
Finally, both output files are read from the virtual file system and downloaded to the local computer.
Conclusion
This article demonstrated how to split PDF documents in a React application using Spire.PDF for JavaScript. With the Split() method, you can divide a PDF into separate single-page documents. With InsertPage() and InsertPageRange(), you can extract specific pages or page ranges into new PDF files.
These methods are useful for building browser-based PDF tools, document management systems, online file-processing applications, and other React applications that require PDF splitting without server-side processing.
FAQs
Can I split a PDF into one file per page in React?
Yes. You can use the Split() method provided by Spire.PDF for JavaScript to split a PDF document into separate PDF files. Each page of the original PDF will be saved as an individual PDF file.
Can I split only a specific page range from a PDF?
Yes. Instead of splitting every page, you can create a new PdfDocument object and use InsertPage() or InsertPageRange() to copy selected pages from the source PDF into a new PDF document.
Are page indexes zero-based in Spire.PDF for JavaScript?
Yes. Page indexes start from 0. For example, page index 0 refers to the first page, and page index 1 refers to the second page. When using InsertPageRange(), make sure the start index and page count are set correctly.
Do I need a server to split PDF documents in React?
No. With Spire.PDF for JavaScript, the PDF can be loaded, processed, and saved in the browser using WebAssembly and the virtual file system. This makes it possible to split PDF documents directly in a React application without sending the file to a server.
How to Merge PDF Documents Using JavaScript in React
Combining PDF files is a common requirement in document management applications. For example, a React application may need to assemble invoices, reports, contracts, or scanned pages into a single PDF before the file is archived or shared. When the source documents do not need to be uploaded to a server, performing the operation in the browser can also simplify the workflow.
In this tutorial, you will learn how to merge PDF documents in a React application using Spire.PDF for JavaScript. The first example combines several complete PDF files in one operation. The second example provides more precise control by taking selected pages from different PDFs and adding them to a new document.
On this page:
- Install Spire.PDF for JavaScript in a React Project
- Merge Multiple PDF Documents in React
- Merge Selected Pages from Different PDF Documents in React
- Important Implementation Notes
- Conclusion
Install Spire.PDF for JavaScript in a React Project
Open a terminal in the root directory of your React project and install the spire.office package:
npm i spire.office
After the installation is complete, copy the following runtime files and folder from the installed package to the React project's public folder:
public/
├── _framework/
├── spire.pdf.js
├── Spire.Pdf.Wasm.zip
├── spire.common.js
└── Spire.Common.Wasm.zip
The JavaScript loader, WebAssembly resources, and supporting framework files must remain accessible as static assets when the application runs. For detailed setup instructions and the exact integration process, see How to Integrate Spire.PDF for JavaScript in a React Project.
For the examples in this article, also place the input PDF files in the public folder so that the application can retrieve them with fetch():
public/
├── input_1.pdf
├── input_2.pdf
├── input_3.pdf
└── ...
Merge Multiple PDF Documents in React
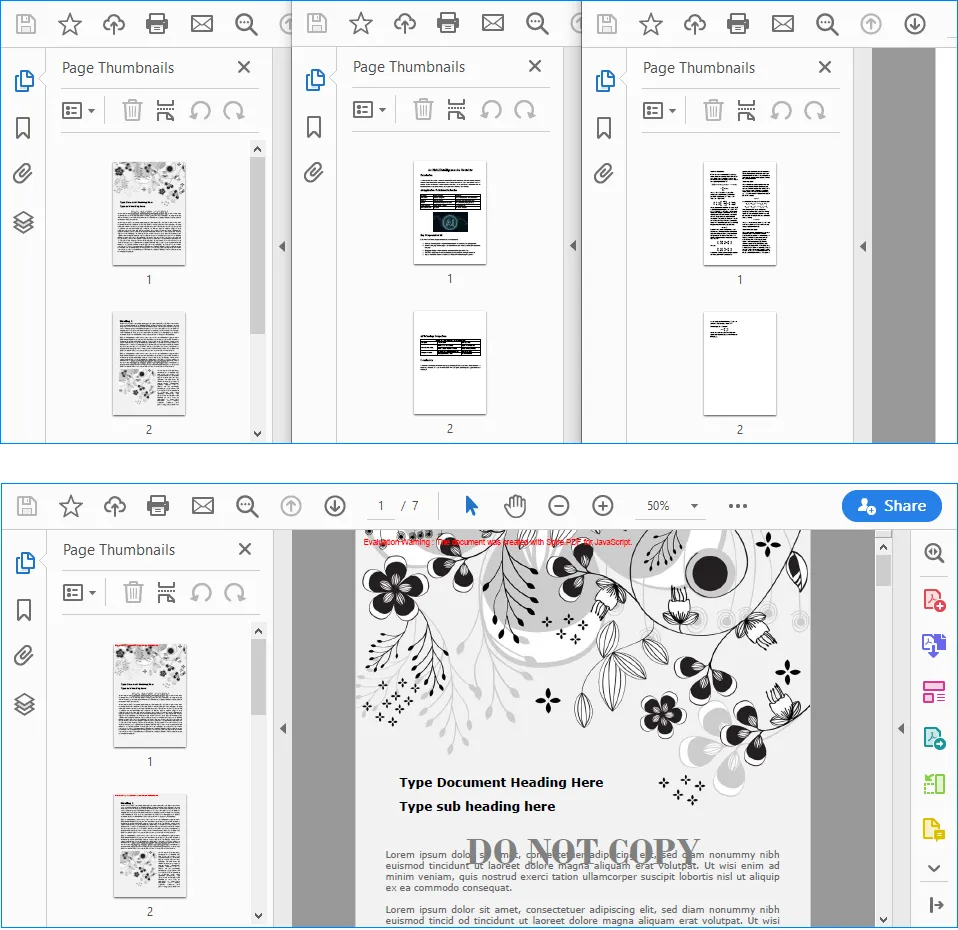
If every page in every source file should appear in the result, the most direct approach is to use the PdfMerger.Merge() method. It accepts an array of input file paths, merges the files in the order in which they appear in the array, and writes the result to the WebAssembly virtual file system.
The following React component merges input_1.pdf, input_2.pdf, and input_3.pdf into a single document named MergedPdf.pdf:
import React, { useState, useEffect } from 'react';

function App() {
  const [wasmModule, setWasmModule] = useState(null);
  const [isGenerating, setIsGenerating] = useState(false);
  const [errorMessage, setErrorMessage] = useState('');

  useEffect(() => {
    (async () => {
      try {
        const publicUrl = process.env.PUBLIC_URL || '';
        const spireModule = await import(/* webpackIgnore: true */ `${publicUrl}/spire.pdf.js`);
        const rawModule = spireModule.default || spireModule;
        window.wasmModule = typeof rawModule === 'function'
          ? await rawModule({ locateFile: p => p.endsWith('.wasm') ? `${publicUrl}/${p}` : p })
          : rawModule;
        setWasmModule(window.wasmModule);
      } catch (error) {
        console.error('Failed to load spire.pdf.js:', error);
      }
    })();
  }, []);

  const loadPdfToVfs = async (fileName) => {
    const publicUrl = process.env.PUBLIC_URL || '';
    const response = await fetch(`${publicUrl}/${fileName}`);

    if (!response.ok) {
      throw new Error(`Failed to load ${fileName}: ${response.status} ${response.statusText}`);
    }

    const fileBytes = new Uint8Array(await response.arrayBuffer());
    const pdfHeader = String.fromCharCode(...fileBytes.slice(0, 4));

    if (pdfHeader !== '%PDF') {
      throw new Error(`${fileName} was loaded, but it is not a valid PDF file.`);
    }

    window.dotnetRuntime.Module.FS.writeFile(fileName, fileBytes, { flags: 'w+' });
    return fileName;
  };

  const MergePdfs = async () => {
    const wasmModule = window.wasmModule?.spirepdf;
    if (!wasmModule || isGenerating) {
      return;
    }

    setIsGenerating(true);
    setErrorMessage('');

    try {
      const inputFiles = await Promise.all([
        loadPdfToVfs('input_1.pdf'),
        loadPdfToVfs('input_2.pdf'),
        loadPdfToVfs('input_3.pdf'),
      ]);

      const outputFileName = 'MergedPdf.pdf';
      const mergeOp = new wasmModule.MergerOptions();
      wasmModule.PdfMerger.Merge({
        inputFiles,
        outputFile: outputFileName,
        pdfMergeOptions: mergeOp
      });

      const modifiedFileArray = window.dotnetRuntime.Module.FS.readFile(outputFileName);
      const modifiedFile = new Blob([modifiedFileArray], { type: 'application/pdf' });
      const url = URL.createObjectURL(modifiedFile);
      const a = document.createElement('a');

      a.href = url;
      a.download = outputFileName;
      document.body.appendChild(a);
      a.click();
      document.body.removeChild(a);
      URL.revokeObjectURL(url);
    } catch (error) {
      console.error('Failed to merge PDFs:', error);
      setErrorMessage(error.message || 'Failed to merge PDFs.');
    } finally {
      setIsGenerating(false);
    }
  };

  return (
    <div style={{ textAlign: 'center', height: '300px' }}>
      <h1>Merge PDF Documents in React</h1>
      <button onClick={MergePdfs} disabled={!wasmModule || isGenerating}>
        {isGenerating ? 'Generating...' : 'Generate'}
      </button>
      {errorMessage && <p style={{ color: 'crimson' }}>{errorMessage}</p>}
    </div>
  );
}

export default App;
Output:
How the Code Works
The component first loads spire.pdf.js inside useEffect(). Because the module is initialized asynchronously, the Generate button remains disabled until the runtime is ready.
The loadPdfToVfs() function then performs three tasks for each source document:
- It retrieves the PDF from the
publicdirectory withfetch(). - It checks the first four bytes for the
%PDFsignature to help catch missing files or non-PDF responses. - It writes the file bytes to the WebAssembly virtual file system, where Spire.PDF can access them.
After all three files have been loaded, PdfMerger.Merge() combines them in the order specified by inputFiles. The output is read from the virtual file system, converted to a PDF Blob, and downloaded through a temporary object URL.
To change the merge order, simply rearrange the entries in the array. For example, the following order would place input_3.pdf first:
const inputFiles = await Promise.all([
  loadPdfToVfs('input_3.pdf'),
  loadPdfToVfs('input_1.pdf'),
  loadPdfToVfs('input_2.pdf'),
]);
Merge Selected Pages from Different PDF Documents in React
Merging complete documents is not always necessary. You may instead need to create a new PDF from a cover page in one file and a page range in another file. In this situation, load the source files as PdfDocument objects and use InsertPage() and InsertPageRange() to construct the output document.
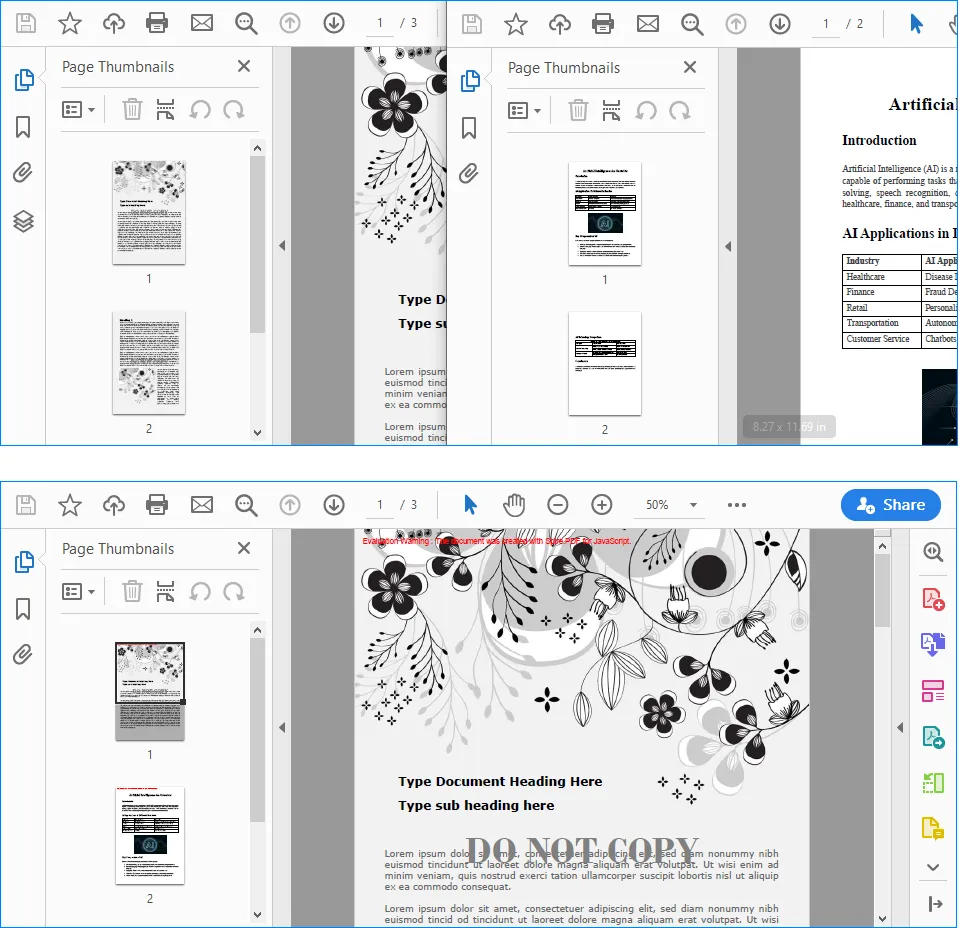
The following example takes the first page from input_1.pdf, appends every page from input_2.pdf, and saves the selected content as MergedPdf.pdf:
import React, { useState, useEffect } from 'react';

function App() {
  const [wasmModule, setWasmModule] = useState(null);
  const [isGenerating, setIsGenerating] = useState(false);
  const [errorMessage, setErrorMessage] = useState('');

  useEffect(() => {
    (async () => {
      try {
        const publicUrl = process.env.PUBLIC_URL || '';
        const spireModule = await import(/* webpackIgnore: true */ `${publicUrl}/spire.pdf.js`);
        const rawModule = spireModule.default || spireModule;
        window.wasmModule = typeof rawModule === 'function'
          ? await rawModule({ locateFile: p => p.endsWith('.wasm') ? `${publicUrl}/${p}` : p })
          : rawModule;
        setWasmModule(window.wasmModule);
      } catch (error) {
        console.error('Failed to load spire.pdf.js:', error);
      }
    })();
  }, []);

  const loadPdfToVfs = async (fileName) => {
    const publicUrl = process.env.PUBLIC_URL || '';
    const response = await fetch(`${publicUrl}/${fileName}`);

    if (!response.ok) {
      throw new Error(`Failed to load ${fileName}: ${response.status} ${response.statusText}`);
    }

    const fileBytes = new Uint8Array(await response.arrayBuffer());
    const pdfHeader = String.fromCharCode(...fileBytes.slice(0, 4));

    if (pdfHeader !== '%PDF') {
      throw new Error(`${fileName} was loaded, but it is not a valid PDF file.`);
    }

    window.dotnetRuntime.Module.FS.writeFile(fileName, fileBytes, { flags: 'w+' });
    return fileName;
  };

  const MergePdfs = async () => {
    const wasmModule = window.wasmModule?.spirepdf;
    if (!wasmModule || isGenerating) {
      return;
    }

    setIsGenerating(true);
    setErrorMessage('');

    try {
      const [firstInputFile, secondInputFile] = await Promise.all([
        loadPdfToVfs('input_1.pdf'),
        loadPdfToVfs('input_2.pdf'),
      ]);

      const outputFileName = 'MergedPdf.pdf';
      const firstDocument = new wasmModule.PdfDocument();
      const secondDocument = new wasmModule.PdfDocument();
      const mergedDocument = new wasmModule.PdfDocument();

      firstDocument.LoadFromFile({ fileName: firstInputFile });
      secondDocument.LoadFromFile({ fileName: secondInputFile });

      if (firstDocument.Pages.Count < 1) {
        throw new Error('The first PDF does not contain any pages.');
      }

      if (secondDocument.Pages.Count < 1) {
        throw new Error('The second PDF does not contain any pages.');
      }

      mergedDocument.InsertPage({ ldDoc: firstDocument, pageIndex: 0 });
      mergedDocument.InsertPageRange(secondDocument, 0, secondDocument.Pages.Count - 1);
      mergedDocument.SaveToFile({ fileName: outputFileName });

      const modifiedFileArray = window.dotnetRuntime.Module.FS.readFile(outputFileName);
      const modifiedFile = new Blob([modifiedFileArray], { type: 'application/pdf' });
      const url = URL.createObjectURL(modifiedFile);
      const a = document.createElement('a');

      a.href = url;
      a.download = outputFileName;
      document.body.appendChild(a);
      a.click();
      document.body.removeChild(a);
      URL.revokeObjectURL(url);
    } catch (error) {
      console.error('Failed to merge PDFs:', error);
      setErrorMessage(error.message || 'Failed to merge PDFs.');
    } finally {
      setIsGenerating(false);
    }
  };

  return (
    <div style={{ textAlign: 'center', height: '300px' }}>
      <h1>Merge PDF Documents in React</h1>
      <button onClick={MergePdfs} disabled={!wasmModule || isGenerating}>
        {isGenerating ? 'Generating...' : 'Generate'}
      </button>
      {errorMessage && <p style={{ color: 'crimson' }}>{errorMessage}</p>}
    </div>
  );
}

export default App;
Output:
Understanding the Page Selection Logic
The three PdfDocument instances have different roles:
firstDocumentrepresentsinput_1.pdf.secondDocumentrepresentsinput_2.pdf.mergedDocumentis the new PDF that receives the selected pages.
PDF page indexes are zero-based in this example. Therefore, pageIndex: 0 refers to the first page:
mergedDocument.InsertPage({ ldDoc: firstDocument, pageIndex: 0 });
The following statement inserts a continuous range from secondDocument. Its start index is 0, while its end index is secondDocument.Pages.Count - 1, so the complete document is appended:
mergedDocument.InsertPageRange(
  secondDocument,
  0,
  secondDocument.Pages.Count - 1
);
You can change these indexes to merge only the pages required by your application. For instance, this statement inserts pages 2 through 5 from secondDocument because their zero-based indexes are 1 through 4:
mergedDocument.InsertPageRange(secondDocument, 1, 4);
Before using fixed page indexes, make sure the source document contains enough pages. The sample already checks for empty PDFs, but a production application should also validate user-supplied start and end indexes against Pages.Count.
Important Implementation Notes
Keep Runtime and Input Paths Correct
Files stored in the React public directory are requested by URL at runtime. The code uses process.env.PUBLIC_URL so it can construct paths correctly when the application is deployed under a non-root public path. A missing or incorrect file path may return an HTML error page instead of a PDF, which is why the sample verifies the %PDF header before writing the data to the virtual file system.
Wait for WebAssembly Initialization
Spire.PDF cannot process a document until its runtime has finished loading. The wasmModule state controls the button's disabled status, while isGenerating prevents the same operation from being started repeatedly before the current merge has finished.
Validate Page Ranges
When pages are chosen dynamically, check that the start and end indexes are non-negative, that the start index does not exceed the end index, and that both values fall within the source document's page count. This avoids invalid range errors and makes it easier to show a useful message in the React interface.
Release the Download URL
URL.createObjectURL() creates a temporary URL for the generated Blob. Calling URL.revokeObjectURL(url) after the download starts releases that URL and prevents it from remaining in browser memory longer than necessary.
Conclusion
Spire.PDF for JavaScript enables React applications to combine PDF content through a WebAssembly-based workflow. When all pages are required, PdfMerger.Merge() provides a concise way to merge several complete documents in a defined order. When the output must contain only specific content, PdfDocument, InsertPage(), and InsertPageRange() provide page-level control over the result.
With the runtime files configured in the public directory, these techniques can be integrated into document portals, reporting tools, contract workflows, and other React applications that need to assemble PDFs directly in the browser.
How to Create a Pie Chart in Excel: A Step-by-Step Guide
Table of Contents

Pie charts are a simple but effective way to visualize how different categories contribute to a whole. In Microsoft Excel, creating a pie chart only takes a few clicks, making it a popular choice for reports, presentations, and data analysis.
However, creating a chart manually is not always the best option. When working with complex data or repeated reporting tasks, AI tools and programming methods can provide a more efficient workflow.
In this article, we will explore three ways to create a pie chart in Excel:
- Creating a pie chart directly using Microsoft Excel
- Using an AI Agent to generate and refine charts through conversation
- Creating pie charts programmatically with Python
Each method has its own advantages depending on your workflow, technical skills, and automation needs.
Part 1. Create a Pie Chart Using Microsoft Excel
Microsoft Excel provides a built-in chart feature that allows you to create a pie chart in just a few clicks. This method is suitable when you need to quickly visualize a small dataset, such as sales distribution, budget allocation, or market share.
In this section, we will use a simple sales dataset to demonstrate how to create and customize a pie chart in Excel.
Step 1: Prepare Your Data
Before creating a pie chart, organize your data into two columns: one for categories and another for values.
For example:

Excel uses the category column as the labels for each slice and the value column to calculate the size of each slice.
For better results, make sure your dataset contains clear category names and numeric values. Avoid leaving empty rows inside the selected range, as they may affect how Excel interprets the chart data.
Step 2: Select Your Data
Select the complete dataset, including the column headers.
In this example, select the range A1:B5. Including headers helps Excel automatically recognize the data structure and use the first row as chart labels.
Step 3: Insert a Pie Chart
After selecting the data, go to the Insert tab on the Excel ribbon.
Then:
- Click Insert Pie or Doughnut Chart in the Charts section.
- Choose your preferred pie chart style.
- Excel will automatically generate the chart based on your selected data.
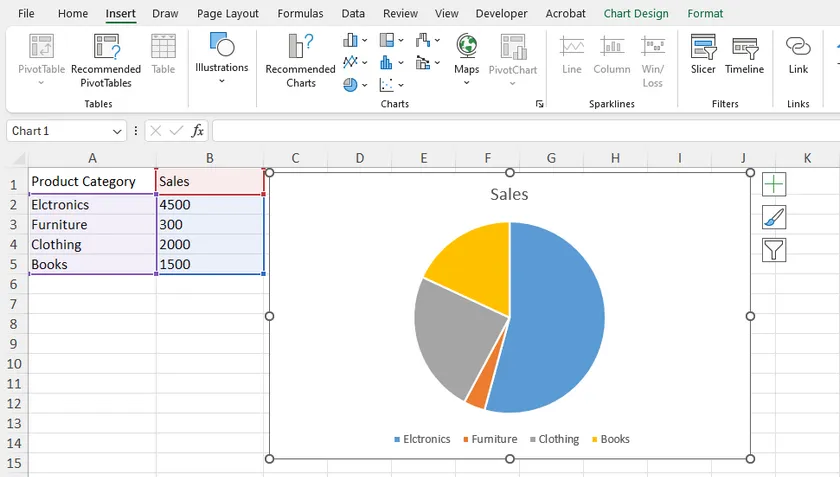
Excel provides several pie chart variations, including standard 2-D Pie, 3-D Pie, Doughnut Chart, and Pie of Pie Chart.
For most situations, the standard 2-D Pie Chart is recommended because it provides a clear comparison without unnecessary visual effects.
Step 4: Customize the Pie Chart
After inserting the chart, you can adjust its appearance and displayed information.
Click the chart, and Excel will show the Chart Design and Format tabs. From here, you can change the chart style, colors, title, and layout.
For example, you can add data labels to display percentages directly on each slice. This is especially useful for pie charts because the main purpose of this chart type is to show how each category contributes to the whole.
To add data labels:
- Select the chart.
- Click the Chart Elements (+) button.
- Enable Data Labels .
Step 5: Highlight Important Data (Optional)
Sometimes, you may want to emphasize a specific category in your pie chart.
For example, if Electronics represents the largest sales segment, you can separate this slice from the rest of the chart.
To highlight a slice, click the slice twice and drag it slightly away from the center. You can also adjust the separation distance through the Format Data Point panel.
This feature is useful when presenting key information in reports or presentations.
Step 6: Save or Export the Chart
Once your pie chart is complete, you can reuse it in other applications.
Excel allows you to copy the chart directly into PowerPoint or Word, save the worksheet as PDF, or export the chart as an image.
This makes Excel pie charts a practical choice for business reports, presentations, and data analysis.
Why Use Excel to Create Pie Charts?
Creating a pie chart directly in Excel is usually the fastest approach because all chart tools are already integrated into the application.
It is especially useful when:
- You are working with Excel data already.
- You need to quickly adjust the chart manually.
- You want full control over the chart appearance.
However, if you need to analyze large datasets or generate charts repeatedly, AI tools and programming methods can provide a more efficient workflow. We will cover these approaches in the following sections.
Part 2. Create a Pie Chart with an AI Agent
Creating a pie chart directly in Excel is straightforward, but it still requires users to manually select data, choose a chart type, and adjust the appearance.
An AI Agent provides a different approach. Instead of working through multiple Excel menus, you can describe what you want to create in natural language. The AI can analyze your spreadsheet, recommend a suitable chart, generate the result, and help you refine it through follow-up conversations.
For this method, we will use CloudXDocs AI Agent, which supports working with Office documents, including Excel files, through conversational interaction.
Step 1: Upload Your Excel File
Start by uploading the Excel workbook that contains your data.
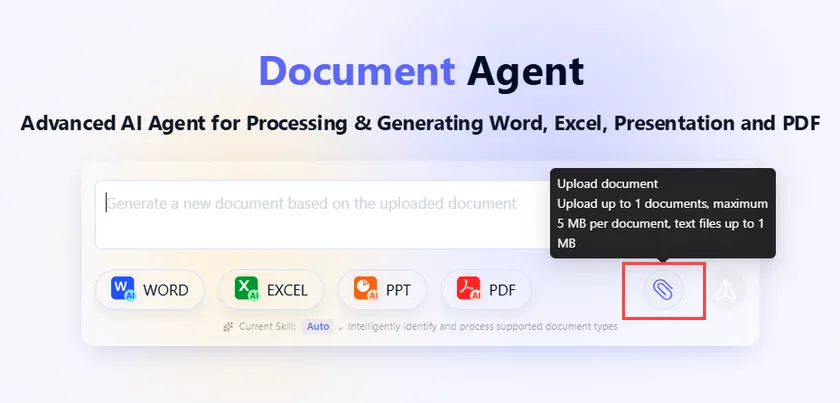
After uploading the file, the AI Agent can understand the structure of your spreadsheet and use the existing data to create a chart.
Step 2: Describe Your Chart Requirements
Instead of manually selecting ranges and chart options, you can explain your goal using a simple prompt.
For example:
Create a pie chart showing sales distribution by product category.
Display percentages on each slice and use a clear title.

The AI Agent can interpret your request, identify the relevant data, and generate a pie chart based on your instructions.
This approach is especially useful when you know what information you want to present but are unsure which Excel settings or chart options to use.
Step 3: Review and Refine the Chart Through Conversation
One advantage of using an AI Agent is that chart creation does not have to be a one-time action.
After reviewing the generated result, you can continue the conversation and request changes.
For example, you can ask:
Change the chart style to make it suitable for a business presentation.
or:
Highlight the Electronics category and move it away from the center.
The AI can adjust the output based on your feedback, allowing you to refine the chart through multiple rounds of interaction.
Step 4: Export and Continue Working with the Result
Once the pie chart meets your requirements, you can continue editing the generated Excel file or use it in other documents.
Compared with creating a pie chart manually in Excel, an AI Agent can save time when you need additional analysis, formatting suggestions, or repeated adjustments.
Why Use an AI Agent to Create Pie Charts?
An AI Agent is not necessarily faster for every simple chart. If you only need a basic pie chart from a small table, Excel's built-in chart tools are usually enough.
However, an AI Agent becomes more useful when your workflow involves understanding data, choosing the right visualization, or making multiple changes through conversation.
It is especially helpful when:
- You need assistance analyzing spreadsheet data before creating a chart.
- You want to generate charts through natural language instructions.
- You need to refine the result through multiple iterations.
Part 3. Create a Pie Chart Programmatically with Python
When working with a small dataset, creating a pie chart directly in Excel is usually the simplest option. However, manual creation becomes inefficient when you need to generate charts repeatedly, process multiple Excel files, or build automated reporting workflows.
In these scenarios, creating pie charts programmatically with Python provides more flexibility. Developers can generate charts, control their appearance, and save the results automatically without manually opening Excel.
In this example, we will use Spire.XLS for Python to create a pie chart in an Excel workbook.
Step 1: Install Spire.XLS for Python
Before creating a pie chart, install the required library:
pip install spire.xls
Spire.XLS for Python provides APIs for creating and manipulating Excel workbooks, including worksheets, charts, formatting, and other spreadsheet elements.
Step 2: Create an Excel Workbook and Add Data
First, create a workbook and add the source data that will be displayed in the pie chart.
from spire.xls import *
from spire.xls.common import *

# Create a workbook
workbook = Workbook()

# Get the first worksheet
sheet = workbook.Worksheets[0]

# Add data
sheet.Range["A1"].Value = "Year"
sheet.Range["A2"].Value = "2002"
sheet.Range["A3"].Value = "2003"
sheet.Range["A4"].Value = "2004"
sheet.Range["A5"].Value = "2005"

sheet.Range["B1"].Value = "Sales"
sheet.Range["B2"].NumberValue = 4000
sheet.Range["B3"].NumberValue = 6000
sheet.Range["B4"].NumberValue = 7000
sheet.Range["B5"].NumberValue = 8500
The first column contains category labels, while the second column provides the numerical values used to calculate the pie slices.
Step 3: Add a Pie Chart
After preparing the data, create a pie chart and specify the data range.
# Add a pie chart
chart = sheet.Charts.Add(ExcelChartType.Pie)

# Set chart data
chart.DataRange = sheet.Range["B2:B5"]
chart.SeriesDataFromRange = False

# Set category labels and values
cs = chart.Series[0]

cs.CategoryLabels = sheet.Range["A2:A5"]
cs.Values = sheet.Range["B2:B5"]
The ExcelChartType.Pie option creates a standard pie chart. You can also use other chart types provided by Spire.XLS, such as ExcelChartType.PieExploded for an exploded pie chart, or ExcelChartType.PieOfPie for a pie-of-pie chart.
The chart creation workflow remains the same; only the chart type and specific formatting options need to be changed.
Step 4: Customize the Chart Appearance
After creating the chart, you can customize its position, title, and data labels.
# Set chart position
chart.LeftColumn = 4
chart.TopRow = 2
chart.RightColumn = 12
chart.BottomRow = 20

# Set chart title
chart.ChartTitle = "Sales by Year"

# Display data labels
cs.DataPoints.DefaultDataPoint.DataLabels.HasValue = True
These settings allow you to create charts that match the style requirements of automated reports.
Step 5: Save the Excel File
Finally, save the workbook containing the generated pie chart.
workbook.SaveToFile("output/PieChart.xlsx", ExcelVersion.Version2016)
workbook.Dispose()
The generated Excel file can be opened directly in Microsoft Excel, where users can continue editing the chart if needed.
Why Create Pie Charts with Python?
Compared with manually creating charts in Excel, a programming approach provides better automation capabilities.
It is useful when you need to:
- Generate charts from large amounts of data automatically.
- Create consistent reports with predefined formatting.
- Integrate Excel chart generation into applications or data processing workflows.
For occasional chart creation, Excel's built-in tools are usually enough. However, Python automation is a better choice when chart generation becomes part of a repeated workflow.
Tips for Creating Better Pie Charts
Creating a pie chart in Excel is easy, but choosing the right design can make the chart much clearer and more effective.
Keep the Number of Categories Limited
Pie charts work best when showing a small number of categories. When too many slices are displayed, the differences between categories become difficult to identify.
If your dataset contains many categories, consider combining smaller categories into an "Others" group or using a bar chart instead.
Use Percentages to Highlight Proportions
The main purpose of a pie chart is to show how each category contributes to the total.
Displaying percentages can often make the chart easier to understand than showing only raw values. For example, showing that a product category represents 35% of total sales provides more context than displaying only the sales amount.
Avoid Unnecessary 3D Effects
Excel provides several visual styles, including 3D pie charts. While these effects may look attractive, they can make it harder to compare slice sizes accurately.
For professional reports and presentations, a simple 2-D pie chart is usually the better choice.
Choose the Right Situation for a Pie Chart
Pie charts are most useful when you want to show a part-to-whole relationship.
For example, they work well for:
- Sales distribution by category.
- Budget allocation.
- Market share comparison.
However, pie charts are not ideal for showing changes over time or comparing many similar values. In those cases, line charts or bar charts may provide a clearer view.
Comparison Table: Which Method Should You Choose?
The best way to create a pie chart depends on your specific requirements.
| Method | Difficulty | Best For | Main Advantage |
|---|---|---|---|
| Microsoft Excel | Easy | Occasional chart creation | Quick and full manual control |
| AI Agent | Easy | Users who want assistance and flexible editing | Create and refine charts through conversation |
| Python Programming | Advanced | Automated reporting and large-scale workflows | Generate charts programmatically |
For most everyday Excel users, the built-in chart feature is the fastest solution. If you need help understanding data or adjusting charts through natural language, an AI Agent can simplify the process. For developers who need repeatable chart generation, programming provides the greatest flexibility.
Final Thoughts
Creating a pie chart in Excel can be done in several ways depending on your workflow.
For simple tasks, Microsoft Excel remains the most convenient option because it provides all the necessary chart tools without additional setup. Users can quickly create, customize, and export charts directly from their spreadsheets.
If you want a more interactive approach, an AI Agent can help analyze your data, create charts based on your instructions, and refine the results through multiple conversations.
For automated workflows, Python provides a powerful solution for generating Excel charts at scale. It allows developers to create consistent reports and integrate chart generation into applications or data processing systems.
Choosing the right method depends on whether you prioritize simplicity, assistance, or automation.
FAQs
How do I create a pie chart in Excel?
To create a pie chart in Excel, select your data range, go to the Insert tab, choose Pie Chart , and select the desired chart style. You can then customize the title, colors, and data labels.
What type of data is suitable for a pie chart?
Pie charts are best suited for showing how individual categories contribute to a total. Common examples include sales distribution, budget allocation, and market share.
Can AI create a pie chart from an Excel file?
Yes. AI Agents can analyze uploaded Excel files, understand your requirements, and create charts based on natural language instructions. Users can also continue the conversation to request changes and refine the result.
Can I create a pie chart in Excel using Python?
Yes. Python libraries such as Spire.XLS for Python allow developers to create Excel files, add pie charts, customize chart properties, and save the results programmatically.
Should I use a pie chart or a bar chart?
Pie charts are better for showing proportions of a whole, especially when there are only a few categories. Bar charts are usually better when comparing many categories or values with small differences.
See Also
How to Add Images in PowerPoint: 6 Easy Methods
Table of Contents
- Method 1: Insert an Image from Your Computer
- Method 2: Add Images to PowerPoint Using Drag and Drop
- Method 3: Insert Multiple Images into PowerPoint at Once
- Method 4: Add an Image as PowerPoint Background
- Method 5: Add Images to PowerPoint Using VBA
- Method 6: Insert Images into PowerPoint Using Python
- Comparison of the 6 Methods
- Conclusion
- FAQs
Images are an essential part of many PowerPoint presentations, helping explain ideas, highlight important information, and make slides more visually appealing. Whether you are creating a business report, marketing presentation, or educational material, knowing how to add images efficiently can improve your workflow.
PowerPoint offers several ways to insert images, from simple manual operations to automated solutions for large-scale tasks. In this article, we will explore six practical methods to add images in PowerPoint, including built-in features, VBA automation, and Python programming.
Method 1: Insert an Image from Your Computer
The most common way to add images in PowerPoint is by using the built-in Insert Pictures feature. This method is suitable when you only need to add a few images and manually adjust their size, position, or appearance.
PowerPoint allows you to insert local images directly into slides and customize them using built-in editing tools, such as cropping, resizing, and adjusting transparency. If you need the same image to appear in the same position across multiple slides, such as a company logo, watermark, or footer graphic, you can add the image to the slide master instead of inserting it manually on each slide.
Steps to insert an image:
- Open your PowerPoint presentation.
- Select the slide where you want to add an image.
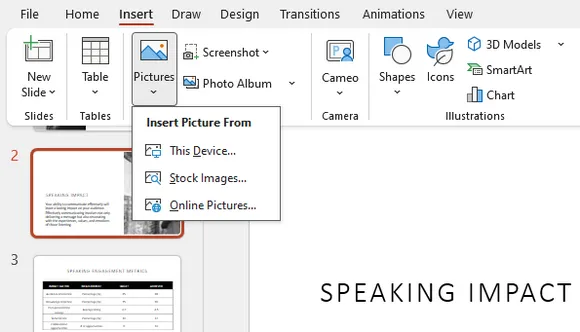
- Go to Insert > Pictures > This Device.
- Select an image file from your computer.
- Click Insert.
The image will be added to the selected slide. You can then resize it, move it to the desired position, or apply PowerPoint's built-in formatting options.
More Image Sources in PowerPoint
Besides adding images from your computer, PowerPoint also provides built-in image sources that allow you to quickly find and insert visual content.
Stock Images provides a collection of royalty-free photos, illustrations, icons, and other visual assets directly inside PowerPoint. It is useful when you need professional-looking graphics without searching for external resources.
Online Pictures allows you to search for images from online sources and insert them directly into your presentation. This option is convenient when you need to quickly find visual materials without downloading files separately.
Method 2: Add Images to PowerPoint Using Drag and Drop
Dragging images directly into PowerPoint is one of the fastest ways to add visual content during presentation editing. Instead of browsing through menus, you can simply move an image file from a folder and place it on the target slide.
This method works especially well when preparing presentations with only a few images because it requires minimal steps. However, manually dragging many images can become time-consuming when working with image-heavy presentations.
Steps:
- Open the folder containing your images.
- Launch your PowerPoint presentation.
- Drag an image file into the target slide.
- Adjust the image size and position if necessary.
For occasional editing, drag and drop is usually the quickest workflow. For larger projects, consider using batch insertion or automation methods.
Method 3: Insert Multiple Images into PowerPoint at Once
When creating photo presentations, product showcases, or image collections, adding pictures individually can slow down the editing process. PowerPoint allows you to select multiple images and insert them into a presentation at the same time.
This approach is useful when you already have a group of images prepared and want to quickly build slides from existing visual assets. For photo-based presentations, the built-in Photo Album feature can also help organize images automatically.
Insert multiple images:
- Open your PowerPoint presentation.
- Select the target slide.
- Go to Insert > Pictures > This Device.
- Hold the Ctrl key and select multiple images.
- Click Insert.
All selected images will be added to the slide together.
Create a Photo Album:
- Go to Insert > Photo Album.
- Click File/Disk.
- Select the images you want to use.
- Click Create.
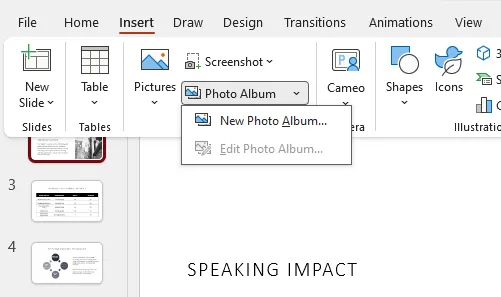
PowerPoint will generate slides containing the selected pictures automatically.
Method 4: Add an Image as PowerPoint Background
Sometimes an image is not meant to be a separate object but the main visual element of a slide. In this case, you can add an image as a PowerPoint background and use it as the foundation of the entire slide layout.
Using a background image is common for presentation covers, branded templates, and full-screen visual designs. Unlike regular inserted pictures, background images stay behind other slide elements, reducing the chance of accidental movement during editing.
Steps to add an image as background:
- Right-click the slide.
- Select Format Background.
- Choose Picture or texture fill.
- Click Insert and select your image.
- Apply the background to the current slide or all slides.
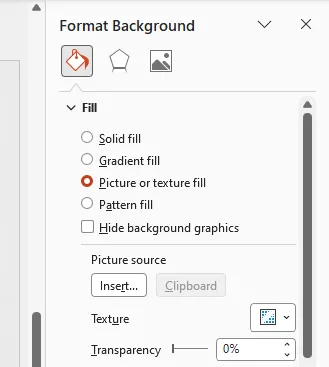
This method is especially useful when creating visually consistent presentations with custom themes or full-page graphics.
Method 5: Add Images to PowerPoint Using VBA
For users who repeatedly perform the same image insertion tasks, VBA can automate the workflow directly inside PowerPoint. Instead of manually adding images and adjusting their positions each time, a macro can complete the process automatically.
VBA is useful for tasks such as inserting company logos, generating image-based reports, or creating presentations from predefined image collections. It is a practical option for Office users who need automation without switching to external programming tools.
Steps to run VBA code:
- Open your PowerPoint presentation.
- Press Alt + F11 to open the VBA editor.
- Click Insert > Module.
- Paste the following code.
- Press F5 to run the macro.
Sub InsertImage()

    Dim slide As Slide
    Dim imgPath As String

    imgPath = "C:\Images\sample.jpg"

    Set slide = ActivePresentation.Slides(1)

    slide.Shapes.AddPicture _
        FileName:=imgPath, _
        LinkToFile:=msoFalse, _
        SaveWithDocument:=msoTrue, _
        Left:=100, _
        Top:=100, _
        Width:=300, _
        Height:=200

End Sub
The macro inserts the specified image into the first slide and places it at the defined location and size.
Method 6: Insert Images into PowerPoint Using Python
For developers building automated presentation workflows, Python provides more flexibility than manual editing or Office macros. A programming approach allows you to control image insertion, positioning, and presentation generation through code.
This method is suitable for batch processing, automated report creation, and applications that need to modify PowerPoint files programmatically. In the following example, we use Spire.Presentation for Python to insert an image into an existing PowerPoint presentation.
Install Spire.Presentation for Python
pip install spire.presentation
Add an Image to a PowerPoint Slide
from spire.presentation.common import *
from spire.presentation import *
import math

# Create a Presentation object
presentation = Presentation()

# Load a PowerPoint presentation
presentation.LoadFromFile("Input.pptx")

# Get the first slide
slide = presentation.Slides[0]

# Image file path
imageFile = "Image.png"

# Calculate image position
left = math.trunc(presentation.SlideSize.Size.Width / float(2)) - 280

# Define image position and size
rect1 = RectangleF.FromLTRB(left, 140, 120 + left, 260)

# Insert image into the slide
image = slide.Shapes.AppendEmbedImageByPath(
    ShapeType.Rectangle,
    imageFile,
    rect1
)

# Remove image border
image.Line.FillType = FillFormatType.none

# Save the presentation
presentation.SaveToFile(
    "AddImageToSlide.pptx",
    FileFormat.Pptx2010
)

presentation.Dispose()
The code loads an existing PowerPoint file, selects a slide, inserts an image at the specified location, and saves the updated presentation.
Compared with manual editing, Python automation is more suitable for workflows that require repeatable image processing or large-scale presentation generation.
Comparison of the 6 Methods
| Method | Difficulty | Best For |
|---|---|---|
| Insert Picture | Easy | Adding individual images manually |
| Drag and Drop | Easy | Quickly adding a few images |
| Insert Multiple Images | Easy | Creating photo-based presentations |
| Background Image | Easy | Full-slide visual designs |
| VBA | Medium | Office automation |
| Python | Advanced | Batch processing and automation |
Conclusion
PowerPoint provides different approaches for adding images depending on the complexity of your workflow. For everyday presentations, built-in features such as Insert Pictures, drag and drop, and Photo Album are usually sufficient.
When working with repetitive tasks or large numbers of images, VBA and Python automation can significantly improve efficiency. Choosing the right method allows you to create presentations faster while maintaining consistent image layouts.
FAQs
1. How do I insert a picture into PowerPoint?
You can insert a picture by selecting a slide and choosing Insert > Pictures > This Device. After selecting an image file, PowerPoint will add it to the current slide.
2. Can I add multiple images to PowerPoint at once?
Yes. You can select multiple image files while using the Insert Pictures option. PowerPoint also provides the Photo Album feature for creating presentations from collections of images.
3. What image formats does PowerPoint support?
PowerPoint supports common image formats including JPG, JPEG, PNG, GIF, BMP, and SVG. Available formats may vary depending on your PowerPoint version.
4. How can I automatically insert images into PowerPoint?
You can use VBA macros or Python libraries to automate image insertion. These approaches are useful for batch processing and generating presentations automatically.
5. How do I set a picture as a PowerPoint background?
You can set an image as a background by opening Format Background , selecting Picture or texture fill , and choosing your image file.
See Also
Как скрыть строки в Excel: 5 простых способов
Оглавление
- Зачем скрывать строки в Excel?
- Способ 1. Скрытие строк с помощью ленты Excel
- Способ 2. Скрытие строк через контекстное меню (правой кнопкой мыши)
- Способ 3. Скрытие строк с помощью горячих клавиш Excel
- Способ 4. Автоматическое скрытие строк с помощью VBA
- Способ 5. Скрытие строк в Excel с помощью C#
- Сравнительная таблица: какой метод выбрать?
- Заключение
- Часто задаваемые вопросы (FAQ)

Скрытие строк в Excel — это простой способ упорядочить рабочий лист, не удаляя данные навсегда. Этот метод часто используется, когда электронная таблица содержит вспомогательные расчеты, временную информацию или разделы, которые не должны отображаться в итоговом отчете.
В этой статье мы рассмотрим пять практических способов скрытия строк в Excel, включая встроенные функции Excel, горячие клавиши, автоматизацию VBA и решение на C# для разработчиков, которым необходимо обрабатывать файлы Excel автоматически.
Зачем скрывать строки в Excel?
При работе с большими листами Excel не вся информация должна быть видна постоянно. Вместо удаления ненужного содержимого скрытие строк позволяет сохранить исходные данные, создавая при этом более чистый и удобный для восприятия вид.
Распространенные сценарии для скрытия строк:
- Удаление строк с расчетами из презентационного отчета
- Временное скрытие неиспользуемых разделов в больших таблицах
- Скрытие конфиденциальной или внутренней информации
- Улучшение читаемости листа перед печатью или отправкой
- Подготовка индивидуальных отчетов для разных аудиторий
Скрытые строки не удаляются с листа. Их можно восстановить в любой момент с помощью функции «Отобразить» (Unhide) в Excel.
Способ 1. Скрытие строк с помощью ленты Excel
Лента Excel предоставляет встроенную опцию для скрытия строк без использования горячих клавиш или дополнительных инструментов. Этот метод подходит для пользователей, предпочитающих работать через интерфейс Excel и скрывающих строки лишь изредка.
Чтобы скрыть строки с помощью ленты:
- Выделите строки, которые нужно скрыть.
- Перейдите на вкладку Главная (Home).
- Нажмите Формат (Format) в группе «Ячейки» (Cells).
- Выберите Видимость > Скрыть или отобразить > Скрыть строки (Hide & Unhide > Hide Rows).
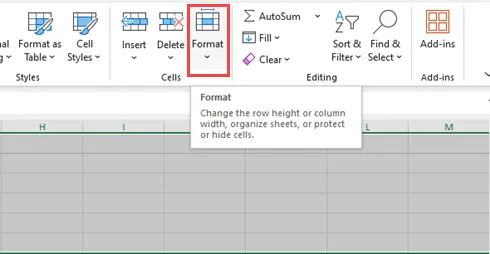
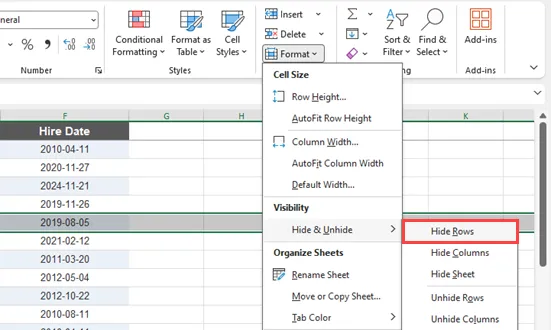
Этот метод хорошо подходит для ручного скрытия нескольких строк. Однако навигация по меню может стать неудобной при частом выполнении операций.
Способ 2. Скрытие строк через контекстное меню
Использование правой кнопки мыши — один из самых быстрых способов скрыть строки в Excel. Это позволяет получить доступ к опции скрытия напрямую с листа, не тратя время на поиск в меню.
Выполните следующие действия:
- Выделите одну или несколько строк, щелкнув по их номерам.
- Нажмите правой кнопкой мыши на выделенные строки.
- Выберите Скрыть (Hide) в появившемся контекстном меню.
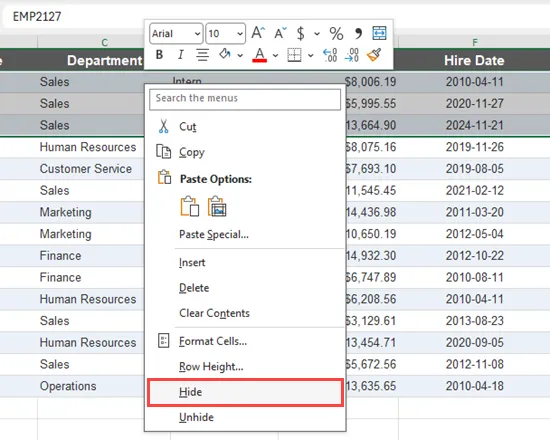
Вы можете скрыть одну строку или несколько последовательных строк сразу. Чтобы скрыть несмежные строки, удерживайте клавишу Ctrl при выделении разных строк перед нажатием правой кнопки мыши.
Способ 3. Скрытие строк с помощью горячих клавиш Excel
Для пользователей, часто работающих с таблицами, горячие клавиши значительно повышают эффективность. В Excel предусмотрена специальная комбинация клавиш для мгновенного скрытия выделенных строк.
Чтобы скрыть строки:
Ctrl + 9
Чтобы отобразить скрытые строки:
Ctrl + Shift + 9
Этот метод особенно полезен при просмотре больших таблиц, так как позволяет не переключаться между листом и меню Excel. Просто выделите строки и нажмите комбинацию клавиш.
Способ 4. Автоматическое скрытие строк с помощью VBA
Когда скрытие строк становится частью повторяющегося рабочего процесса, VBA позволяет автоматизировать этот процесс прямо внутри Excel. Это полезно для таких задач, как подготовка отчетов, очистка таблиц или скрытие строк на основе определенных условий.
Выполните следующие шаги для запуска макроса VBA:
- Откройте книгу Excel.
- Нажмите Alt + F11, чтобы открыть редактор VBA.
- Нажмите Insert > Module (Вставка > Модуль), чтобы создать новый модуль.
- Скопируйте и вставьте следующий код VBA в модуль.
- Нажмите F5 или кнопку Run (Выполнить), чтобы запустить макрос.
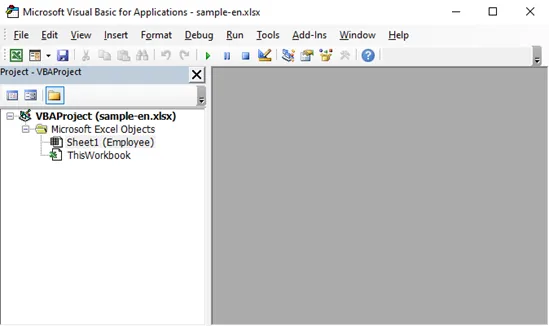
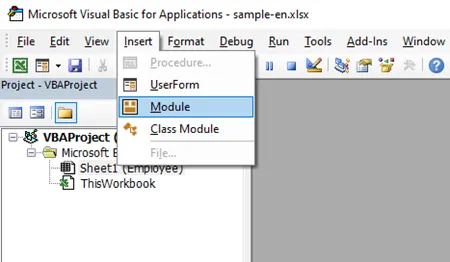
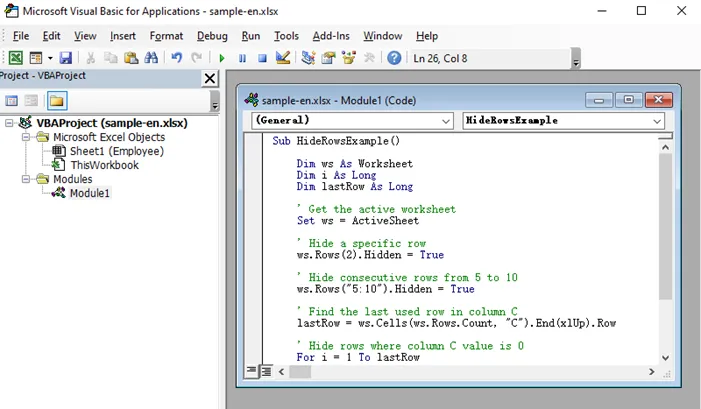
Приведенный ниже пример VBA скрывает строку 2, строки с 5 по 10, а также автоматически скрывает строки, где значение в столбце C равно 0.
Sub HideRowsExample()

    Dim ws As Worksheet
    Dim i As Long
    Dim lastRow As Long

    ' Получить активный лист
    Set ws = ActiveSheet

    ' Скрыть конкретную строку
    ws.Rows(2).Hidden = True

    ' Скрыть последовательные строки с 5 по 10
    ws.Rows("5:10").Hidden = True

    ' Найти последнюю заполненную строку в столбце C
    lastRow = ws.Cells(ws.Rows.Count, "C").End(xlUp).Row

    ' Скрыть строки, где значение в столбце C равно 0
    For i = 1 To lastRow
        If ws.Cells(i, "C").Value = 0 Then
            ws.Rows(i).Hidden = True
        End If
    Next i

End Sub
В этом примере:
Rows(2).Hidden = Trueскрывает конкретную строку.Rows("5:10").Hidden = Trueскрывает несколько последовательных строк.- Цикл проверяет значения в столбце C и автоматически скрывает строки, соответствующие условию.
VBA — практичный выбор для пользователей Excel, которым нужна автоматизация, но которые работают преимущественно внутри Microsoft Excel. Однако этот метод требует включения макросов и менее подходит для приложений, обрабатывающих файлы Excel вне среды Excel.
Способ 5. Скрытие строк в Excel с помощью C#
Для разработчиков, которым необходимо программно создавать или обрабатывать файлы Excel, скрытие строк можно автоматизировать без запуска Microsoft Excel. Этот подход полезен для систем управления документами, приложений для отчетности и пакетной обработки файлов.
Используя Free Spire.XLS for .NET, вы можете скрывать отдельные или несколько последовательных строк с помощью простых методов API. Библиотека обеспечивает прямой контроль над строками листа, сохраняя при этом структуру документа Excel.
Шаг 1. Установка Spire.XLS for .NET
Перед написанием кода установите пакет Free Spire.XLS через NuGet Package Manager.
Откройте консоль диспетчера пакетов NuGet в Visual Studio и выполните:
Install-Package FreeSpire.XLS
Шаг 2. Скрытие строк с помощью C#
После установки библиотеки вы можете загрузить существующий файл Excel и скрыть строки с помощью методов HideRow() и HideRows().
Следующий пример скрывает конкретную строку и несколько последовательных строк:
using Spire.Xls;

class Program
{
    static void Main()
    {
        // Создать объект Workbook
        Workbook workbook = new Workbook();

        // Загрузить файл Excel
        workbook.LoadFromFile("Input.xlsx");

        // Получить первый лист
        Worksheet sheet = workbook.Worksheets[0];

        // Скрыть конкретную строку
        sheet.HideRow(2);

        // Скрыть последовательные строки с 5 по 7
        sheet.HideRows(5, 3);

        // Сохранить результат
        workbook.SaveToFile("HideRows.xlsx", ExcelVersion.Version2016);

        workbook.Dispose();
    }
}
В этом примере:
HideRow()скрывает указанную строку на листе.HideRows(startRow, count)скрывает несколько последовательных строк.- Книга может обрабатываться напрямую через код без необходимости установки Microsoft Excel.
Помимо скрытия строк, Spire.XLS поддерживает другие задачи автоматизации, такие как удаление дубликатов, закрепление областей и применение условного форматирования. Эти функции позволяют разработчикам создавать более структурированные и удобные отчеты Excel программным путем.
Сравнительная таблица: какой метод выбрать?
| Метод | Для чего лучше всего подходит | Автоматизация | Сложность |
|---|---|---|---|
| Лента Excel | Редкое ручное редактирование | Нет | Просто |
| Контекстное меню | Быстрое скрытие строк | Нет | Просто |
| Горячие клавиши | Частые ручные операции | Нет | Очень просто |
| VBA | Повторяющиеся задачи в Excel | Да | Средне |
| C# с Spire.XLS | Автоматизация на уровне приложений | Да | Средне |
Заключение
Excel предоставляет несколько способов скрытия строк в зависимости от ваших задач. Для быстрой корректировки обычно достаточно встроенных функций: ленты, контекстного меню или горячих клавиш. При работе с повторяющимися операциями VBA поможет автоматизировать задачи прямо внутри Excel.
Для разработчиков, которым необходимо скрывать строки в рамках автоматизированного процесса обработки данных, библиотека C#, такая как Spire.XLS, предоставляет надежный способ программного изменения листов без зависимости от установленного Microsoft Excel.
Часто задаваемые вопросы (FAQ)
1. Как скрыть несколько строк в Excel?
Выделите строки, которые нужно скрыть, затем нажмите правой кнопкой мыши на их номера и выберите Скрыть. Вы также можете использовать комбинацию Ctrl + 9 после выделения строк.
2. Какая горячая клавиша в Excel для скрытия строк?
Комбинация для скрытия выделенных строк — Ctrl + 9. Чтобы снова отобразить скрытые строки, используйте Ctrl + Shift + 9.
3. Удаляет ли скрытие строк данные в Excel?
Нет. Скрытие строк лишь меняет их видимость. Данные остаются сохраненными на листе и могут быть отображены снова с помощью опции «Отобразить».
4. Можно ли скрывать строки автоматически на основе условий в Excel?
Да. Вы можете использовать VBA для проверки значений ячеек и скрытия строк, соответствующих определенным условиям (например, скрытие пустых строк или строк с нулевыми значениями).
5. Можно ли скрывать строки в Excel программно с помощью C#?
Да. Библиотеки, такие как Spire.XLS, позволяют разработчикам скрывать отдельные или несколько строк с помощью кода C#, что делает их идеальными для автоматизированных рабочих процессов.
Смотрите также
How to Hide Rows in Excel: 5 Easy Methods
Table of Contents
- Why Hide Rows in Excel?
- Method 1. Hide Rows Using the Excel Ribbon
- Method 2. Hide Rows by Right-Clicking
- Method 3. Hide Rows Using Excel Keyboard Shortcuts
- Method 4. Hide Rows Automatically with VBA
- Method 5. Hide Rows in Excel with C#
- Comparison Table: Which Method Should You Choose?
- Conclusion
- FAQs
Hiding rows in Excel is a simple way to keep worksheets organized without permanently deleting data. It is commonly used when a spreadsheet contains supporting calculations, temporary information, or sections that should not appear in a final report.
In this article, we will explore five practical methods to hide rows in Excel, including built-in Excel features, keyboard shortcuts, VBA automation, and a C# programming solution for developers who need to process Excel files automatically.
Why Hide Rows in Excel?
When working with large Excel worksheets, not every piece of information needs to be visible all the time. Instead of deleting unnecessary content, hiding rows allows you to keep the original data while creating a cleaner and more focused view.
Common scenarios for hiding rows include:
- Removing calculation rows from a presentation report
- Temporarily hiding unused sections in large worksheets
- Keeping sensitive or internal information out of view
- Improving worksheet readability before printing or sharing
- Preparing customized reports for different audiences
Hidden rows are not deleted from the worksheet. They can be restored whenever needed using Excel’s Unhide feature.
Method 1. Hide Rows Using the Excel Ribbon
The Excel Ribbon provides a built-in option for hiding rows without using any shortcuts or additional tools. This method is suitable for users who prefer working through Excel’s interface and need to hide rows occasionally.
To hide rows using the Ribbon:
- Select the rows you want to hide.
- Go to the Home tab.
- Click Format in the Cells group.
- Select Hide & Unhide > Hide Rows .
This method works well when you need to hide a few rows manually. However, navigating through multiple menus can become inconvenient when performing frequent operations.
Method 2. Hide Rows by Right-Clicking
Right-clicking is one of the fastest ways to hide rows in Excel. It allows you to access the Hide option directly from the worksheet without searching through Excel menus.
Follow these steps:
- Select one or more rows by clicking their row numbers.
- Right-click the selected rows.
- Choose Hide from the context menu.
You can hide a single row or multiple consecutive rows at once. To hide non-adjacent rows, hold the Ctrl key while selecting different rows before right-clicking.
Method 3. Hide Rows Using Excel Keyboard Shortcuts
For users who frequently work with spreadsheets, keyboard shortcuts can significantly improve efficiency. Excel provides a dedicated shortcut that allows you to hide selected rows instantly.
To hide rows:
Ctrl + 9
To unhide rows:
Ctrl + Shift + 9
This method is especially useful when reviewing large worksheets because it avoids switching between the worksheet and Excel menus. Simply select the rows and press the shortcut to hide or restore them.
Method 4. Hide Rows Automatically with VBA
When hiding rows becomes part of a repeated workflow, VBA provides a way to automate the process directly inside Excel. It is useful for tasks such as preparing reports, cleaning worksheets, or hiding rows based on specific conditions.
Follow these steps to run the VBA macro:
- Open the Excel workbook.
- Press Alt + F11 to open the VBA editor.
- Click Insert > Module to create a new module.
- Copy and paste the following VBA code into the module.
- Press F5 or click Run to execute the macro.
The following VBA example hides row 2, hides rows 5 to 10, and automatically hides rows where the value in column C is 0.
Sub HideRowsExample()

    Dim ws As Worksheet
    Dim i As Long
    Dim lastRow As Long

    ' Get the active worksheet
    Set ws = ActiveSheet

    ' Hide a specific row
    ws.Rows(2).Hidden = True

    ' Hide consecutive rows from 5 to 10
    ws.Rows("5:10").Hidden = True

    ' Find the last used row in column C
    lastRow = ws.Cells(ws.Rows.Count, "C").End(xlUp).Row

    ' Hide rows where column C value is 0
    For i = 1 To lastRow
        If ws.Cells(i, "C").Value = 0 Then
            ws.Rows(i).Hidden = True
        End If
    Next i

End Sub
In this example:
Rows(2).Hidden = Truehides a specific row.Rows("5:10").Hidden = Truehides multiple consecutive rows.- The loop checks values in column C and automatically hides rows that meet the condition.
VBA is a practical choice for Excel users who need automation but still work primarily within Microsoft Excel. However, it requires enabling macros and is less suitable for applications that process Excel files outside of Excel.
Method 5. Hide Rows in Excel with C#
For developers who need to generate or process Excel files programmatically, hiding rows can be automated without opening Microsoft Excel. This approach is useful for document management systems, reporting applications, and batch Excel processing workflows.
Using Free Spire.XLS for .NET, you can hide individual rows or multiple consecutive rows with simple API methods. The library provides direct control over worksheet rows while preserving the rest of the Excel document structure.
Step 1. Install Spire.XLS for .NET
Before writing the code, install the Free Spire.XLS package through NuGet Package Manager.
Open the NuGet Package Manager Console in Visual Studio and run:
Install-Package FreeSpire.XLS
Step 2. Hide Rows Using C#
After installing the library, you can load an existing Excel file and hide rows using the HideRow() and HideRows() methods.
The following example hides a specific row and multiple consecutive rows:
using Spire.Xls;

class Program
{
    static void Main()
    {
        // Create a Workbook object
        Workbook workbook = new Workbook();

        // Load an Excel file
        workbook.LoadFromFile("Input.xlsx");

        // Get the first worksheet
        Worksheet sheet = workbook.Worksheets[0];

        // Hide a specific row
        sheet.HideRow(2);

        // Hide consecutive rows from 5 to 7
        sheet.HideRows(5, 3);

        // Save the result file
        workbook.SaveToFile("HideRows.xlsx", ExcelVersion.Version2016);

        workbook.Dispose();
    }
}
In this example:
HideRow()hides a specific row in the worksheet.HideRows(startRow, count)hides multiple consecutive rows.- The workbook can be processed directly through code without requiring Microsoft Excel to be installed.
Besides hiding rows, Spire.XLS supports other worksheet automation tasks that are useful for organizing Excel data, such as removing duplicate rows, freezing rows or columns, and applying conditional formatting to highlight specific records. These features allow developers to build more structured and user-friendly Excel reports through code.
Comparison Table: Which Method Should You Choose?
| Method | Best For | Automation | Difficulty |
|---|---|---|---|
| Excel Ribbon | Occasional manual editing | No | Easy |
| Right-click Menu | Quick row hiding | No | Easy |
| Keyboard Shortcut | Frequent manual operations | No | Very Easy |
| VBA | Repetitive Excel tasks | Yes | Medium |
| C# with Spire.XLS | Application-level automation | Yes | Medium |
Conclusion
Excel provides several ways to hide rows depending on your workflow. For quick adjustments, built-in options such as the Ribbon, right-click menu, and keyboard shortcuts are usually enough. When dealing with repeated operations, VBA can help automate tasks directly inside Excel.
For developers who need to hide rows as part of an automated Excel processing workflow, a C# library such as Spire.XLS provides a reliable way to modify worksheets programmatically without relying on Microsoft Excel.
FAQs
1. How do I hide multiple rows in Excel?
Select the rows you want to hide, then right-click the selected row numbers and choose Hide . You can also use the shortcut Ctrl + 9 after selecting multiple rows.
2. What is the Excel shortcut for hiding rows?
The shortcut for hiding selected rows in Excel is Ctrl + 9 . To show hidden rows again, use Ctrl + Shift + 9 .
3. Does hiding rows delete data in Excel?
No. Hiding rows only changes their visibility. The data remains stored in the worksheet and can be displayed again using the Unhide option.
4. Can I hide rows automatically based on conditions in Excel?
Yes. You can use VBA to check cell values and hide rows that meet specific conditions, such as hiding rows with empty cells or zero values.
5. Can I hide rows in Excel programmatically with C#?
Yes. Libraries such as Spire.XLS allow developers to hide individual rows or multiple rows directly through C# code, making it suitable for automated Excel processing workflows.
See Also
Convert PowerPoint to High-Resolution TIFF: 4 Practical Methods
Table of Contents
- Method 1: Modify the Windows Registry and Export from PowerPoint
- Method 2: Export PowerPoint Slides to TIFF with a VBA Macro
- Method 3: Convert PowerPoint to TIFF with Convertio
- Method 4: Convert PowerPoint to a High-Resolution TIFF Using Python
- Bonus Tips: Combine Single-Page TIFFs into a Multi-Page TIFF
- Comparison Table: Choose the Right Method
- Conclusion
- FAQs

PowerPoint presentations often contain charts, diagrams, product designs, technical illustrations, and other visual content that may need to be reused outside Microsoft PowerPoint. Converting slides to TIFF is particularly useful for professional printing, document archiving, publishing, faxing, and workflows that require lossless raster images.
However, simply exporting slides from PowerPoint may not produce the resolution you expect. On Windows, PowerPoint normally exports slides as bitmap images at 96 DPI by default. This is generally sufficient for screen viewing, but the resulting images may appear blurry when enlarged or printed. For print-ready output, 300 DPI is usually a more practical target.
This article introduces four ways to convert PowerPoint presentations to high-resolution TIFF files. The methods range from PowerPoint’s built-in export feature to VBA automation, an online converter, and a Python-based solution for generating high-resolution multi-page TIFF files.
Method 1: Modify the Windows Registry and Export from PowerPoint
PowerPoint can save slides directly as TIFF images through its standard Save As or Export feature. The main limitation is that PowerPoint uses a default export resolution of 96 DPI on Windows.
To generate higher-resolution images, you can add a registry value that changes PowerPoint’s bitmap export resolution. For example, setting the value to 300 produces a 4000 × 2250-pixel image from a standard 16:9 widescreen slide.
Editing the Windows Registry incorrectly can affect system or application behavior. Consider backing up the relevant registry key before making changes.
Step 1: Change the PowerPoint Export Resolution
- Close PowerPoint and other Microsoft Office applications.
- Press Windows + R to open the Run dialog.
- Enter
regeditand click OK . - Navigate to the following location for PowerPoint 2016, 2019, 2021, 2024, or Microsoft 365:
HKEY_CURRENT_USER\Software\Microsoft\Office\16.0\PowerPoint\Options
- Right-click an empty area in the right pane.
- Select New → DWORD (32-bit) Value .
- Name the new value:
ExportBitmapResolution
- Double-click the value and select Decimal .
- Enter
300in the Value data field. - Click OK and close Registry Editor.
You can use other values, such as 150 or 200, when you need a balance between image quality and file size. Microsoft’s export calculations show that a 16:9 slide produces approximately 2000 × 1125 pixels at 150 DPI, 2667 × 1500 pixels at 200 DPI, and 4000 × 2250 pixels at 300 DPI.
Step 2: Export the Slides as TIFF
- Open the presentation in PowerPoint.
- Go to File → Save As or File → Export → Change File Type .
- Choose TIFF Tag Image File Format (*.tif) .
- Select an output folder and click Save .
- When prompted, choose All Slides or Just This One .
When all slides are exported, PowerPoint creates a folder containing a separate TIFF file for each slide.
This method is convenient when you only occasionally need high-resolution TIFF images and already have Microsoft PowerPoint installed. Its main disadvantage is that it modifies a user-level Office setting and does not offer a convenient way to process many presentations automatically.
Method 2: Export PowerPoint Slides to TIFF with a VBA Macro
A VBA macro is more efficient when a presentation contains many slides or when you frequently repeat the same export task. Unlike the standard export dialog, the PowerPoint Slide.Export method allows you to specify the output width and height directly in pixels. Microsoft documents both ScaleWidth and ScaleHeight as optional pixel dimensions for the exported slide.
The following macro exports every slide as a 4000 × 2250-pixel TIFF image, which matches the 16:9 dimensions commonly associated with a 300-DPI widescreen slide.
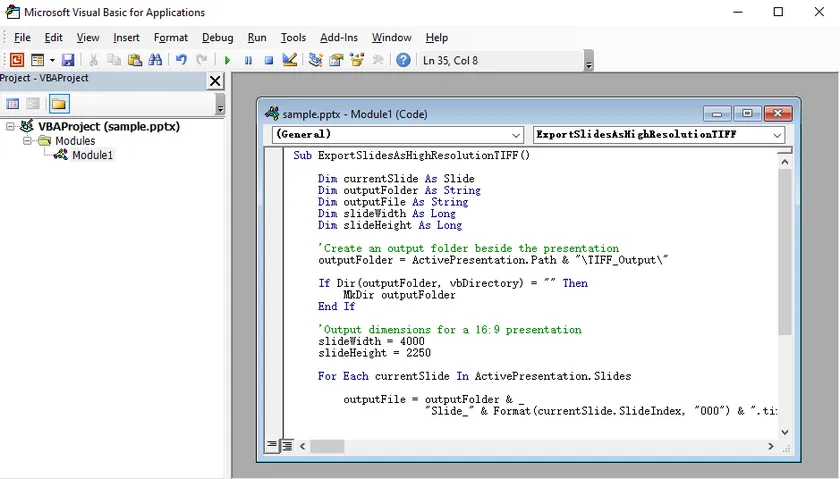
Add and Run the VBA Macro
- Open your PowerPoint presentation.
- Press Alt + F11 to open the Visual Basic Editor.
- Select Insert → Module .
- Paste the following code into the module:
Sub ExportSlidesAsHighResolutionTIFF()

    Dim currentSlide As Slide
    Dim outputFolder As String
    Dim outputFile As String
    Dim slideWidth As Long
    Dim slideHeight As Long

    'Create an output folder beside the presentation
    outputFolder = ActivePresentation.Path & "\TIFF_Output\"

    If Dir(outputFolder, vbDirectory) = "" Then
        MkDir outputFolder
    End If

    'Output dimensions for a 16:9 presentation
    slideWidth = 4000
    slideHeight = 2250

    For Each currentSlide In ActivePresentation.Slides

        outputFile = outputFolder & _
                     "Slide_" & Format(currentSlide.SlideIndex, "000") & ".tif"

        currentSlide.Export _
            outputFile, _
            "TIFF", _
            slideWidth, _
            slideHeight

    Next currentSlide

    MsgBox "All slides have been exported to:" & vbCrLf & outputFolder

End Sub
- Press F5 or click Run .
- Open the
TIFF_Outputfolder created beside the presentation.
The macro uses numbered filenames such as Slide_001.tif, Slide_002.tif, and Slide_003.tif. Zero-padded numbering helps maintain the correct slide order when the images are sorted by filename.
For a 4:3 presentation, replace the dimensions with values that match that aspect ratio, such as:
slideWidth = 3000
slideHeight = 2250
The advantage of VBA is that it automates the entire presentation without requiring another application. It also gives you direct control over pixel dimensions. However, macros must be enabled, and the code runs through the installed PowerPoint application, making it less suitable for unattended server environments.
Method 3: Convert PowerPoint to TIFF with Convertio
An online converter is useful when you cannot install software, do not have access to PowerPoint, or only need to convert a small number of files.
Convertio provides dedicated PPT-to-TIFF and PPTX-to-TIFF conversion pages. It accepts files from a local computer and may also support imports from cloud storage or a URL. The service converts the presentation in the cloud and provides the resulting TIFF file for download.

Steps to Convert PowerPoint Online
- Open the Convertio PowerPoint-to-TIFF converter.
- Upload a
.pptor.pptxpresentation. - Click Convert .
- Wait for the conversion to finish.
- Download the converted TIFF file.
This is the easiest option for a quick, one-time conversion because there are no registry changes, macros, or development tools involved. It also works on operating systems other than Windows.
The main limitation is control. Online converters may not provide precise DPI, pixel-size, compression, or color-profile settings. Free plans may also impose restrictions on file size, conversion frequency, or batch processing.
More importantly, uploading a presentation sends its contents to a third-party server. Avoid this method for presentations containing confidential business information, customer data, financial records, unpublished research, or other sensitive material.
Method 4: Convert PowerPoint to a High-Resolution TIFF Using Python
For automated conversion or integration into document-processing applications, you can use Spire.Presentation for Python together with Pillow. Spire.Presentation can render each slide at a specified pixel size without requiring Microsoft PowerPoint to be installed.
Unlike directly saving the presentation as TIFF, which may produce images at only 1280 × 720 pixels, the SaveAsImageByWH() method lets you specify the output width and height. The rendered slide images can then be combined into a single multi-page TIFF using Pillow.
Install the Required Libraries
Install Spire.Presentation for Python and Pillow using pip:
pip install Spire.Presentation Pillow
Python Code: Convert PowerPoint to a Multi-Page TIFF
from spire.presentation import *
from PIL import Image
from io import BytesIO

# Create a Presentation object
presentation = Presentation()

# Load a PowerPoint presentation
presentation.LoadFromFile("Input.pptx")

# Store the converted slide images
images = []

# Convert each slide to a high-resolution image
for i in range(presentation.Slides.Count):
    slide = presentation.Slides[i]

    # Render the slide at 4000 × 2250 pixels
    stream = slide.SaveAsImageByWH(4000, 2250)

    # Convert the image stream to a PIL image
    image = Image.open(BytesIO(stream.ToArray())).convert("RGB")
    images.append(image)

    stream.Dispose()

# Save all slide images as a multi-page TIFF
images[0].save(
    "Output/PowerPointToTIFF.tiff",
    format="TIFF",
    save_all=True,
    append_images=images[1:],
    compression="tiff_lzw",
    dpi=(300, 300)
)

# Dispose resources
presentation.Dispose()
How It Works
The code first loads the PowerPoint presentation and loops through its slides. Each slide is rendered as a 4000 × 2250-pixel image, which is suitable for a standard 16:9 presentation intended for high-quality printing.
The image stream returned by SaveAsImageByWH() is then opened with Pillow and added to a list. Finally, Pillow saves the first image as a TIFF file and appends the remaining images as additional pages.
The following arguments are important:
save_all=Trueenables multi-page image output.append_images=images[1:]adds the remaining slides to the TIFF file.compression="tiff_lzw"applies lossless LZW compression to reduce the output file size.dpi=(300, 300)records 300-DPI resolution information in the TIFF metadata.
The actual visual detail is primarily determined by the 4000 × 2250 rendering dimensions. The DPI setting mainly tells compatible applications how densely those pixels should be printed.
For a lower-resolution output with a smaller file size, you can change the slide dimensions to:
stream = slide.SaveAsImageByWH(2667, 1500)
This method is suitable for batch processing, server-side conversion, and workflows in which multiple presentations must be converted automatically. It also creates a multi-page TIFF directly, so there is no need to merge the individual slide images afterward.
What's More
Beyond TIFF conversion, Spire.Presentation for Python can also be used to convert PowerPoint slides to other image formats, such as PNG, JPG, and SVG, depending on the output requirements. For broader document-sharing workflows, presentations can also be converted to formats such as PDF and HTML. These options make it easier to reuse slide content for websites, reports, archives, previews, and cross-platform distribution.
Bonus Tips: Combine Single-Page TIFFs into a Multi-Page TIFF
Methods 1 and 2 export each slide as a separate TIFF file. If you prefer one multi-page TIFF containing all slides, IrfanView is a practical Windows tool that supports creating and editing multi-page TIFF files. Method 3 and 4, however, create a multi-page TIFF directly and do not require this additional merging step.
Combine TIFF Files with IrfanView
- Open IrfanView and go to File → Thumbnails , or press T .
- In the Thumbnails window, navigate to the folder containing the exported TIFF files.
- Select all the TIFF files you want to merge. Use Ctrl or Shift while clicking to select multiple files.
- Right-click one of the selected files.
- Choose Start Multipage-TIF dialog with selected files .
- Review the file order in the multipage TIFF dialog.
- Set the output folder and filename.
- Click Create TIF Image .
After processing, IrfanView creates a single TIFF file in which each slide appears as a separate page.
Check the order carefully before creating the file. Naming the source images with padded numbers—such as Slide_001, Slide_002, and Slide_010—prevents incorrect alphabetical sorting.
Free online TIFF merger tools are another option, but the same privacy concerns apply when uploading sensitive images.
Comparison Table: Choose the Right Method
| Method | Best suited for | Resolution control | Batch support | Requires PowerPoint | Main limitation |
|---|---|---|---|---|---|
| Registry + PowerPoint | Occasional manual export | DPI-based | One presentation at a time | Yes | Requires registry modification |
| VBA macro | Repeated slide export | Exact pixel dimensions | Yes | Yes | Macros must be enabled |
| Convertio | Quick conversion without installation | Limited | Limited by service plan | No | Privacy and upload restrictions |
| Spire.Presentation for Python | Automated application workflows | Programmable | Yes | No | Requires coding and licensing consideration |
Conclusion
The best way to convert PowerPoint to high-resolution TIFF depends on how often you perform the conversion and how much control you require.
For a one-time export on Windows, changing PowerPoint’s registry setting and using the native TIFF export feature is straightforward. A VBA macro is more efficient when you need to export every slide repeatedly at fixed pixel dimensions. Convertio is convenient for occasional browser-based conversions, provided the presentation is not confidential.
For automated document workflows, Spire.Presentation for Python provides greater control over the output dimensions without requiring Microsoft PowerPoint. Combined with Pillow, it can also place all rendered slides into a single multi-page TIFF file.
When separate slide images are not convenient, the exported TIFF files can also be combined into a single multi-page TIFF with IrfanView.
FAQs
Can PowerPoint export slides directly as TIFF files?
Yes. In PowerPoint, select File → Save As and choose TIFF as the output format. PowerPoint can export the current slide or every slide in the presentation.
Why do TIFF files exported from PowerPoint look blurry?
PowerPoint’s default bitmap export resolution on Windows is normally 96 DPI. This may be sufficient for screens but inadequate for enlargement or professional printing. Changing the ExportBitmapResolution registry value or specifying larger pixel dimensions through VBA produces sharper output.
Is 300 DPI always necessary?
Not always. Around 96 to 150 DPI may be sufficient for screen-based documents and internal previews. A resolution of 300 DPI is more appropriate for high-quality printing, publishing, and detailed diagrams. Higher resolution also produces larger TIFF files.
Does increasing the DPI improve low-quality images inside the presentation?
No. A higher export resolution preserves slide elements more clearly, but it cannot restore details that are missing from a low-resolution source image. For the best result, use high-quality original images and disable unnecessary image compression in PowerPoint.
Can multiple PowerPoint slides be stored in one TIFF file?
Yes. TIFF supports multiple pages. PowerPoint and VBA normally export each slide as a separate image, which can be combined using IrfanView. In Python, you can render the slides with Spire.Presentation and use Pillow to save them directly as a single multi-page TIFF.
See Also
Merge Multiple CSV Files into One Excel (Separate Sheets)
Table of Contents

When working with reports exported from different systems, it's common to end up with dozens of CSV files. For example, each department, store, or month may generate its own CSV report. While this makes data collection straightforward, managing a large number of separate files quickly becomes inconvenient.
A practical solution is to combine all CSV files into one Excel workbook , while keeping each CSV as a separate worksheet . This preserves the original file structure, makes navigation easier, and allows you to share a single workbook instead of multiple individual files.
In this article, we'll introduce three practical methods—from a simple manual approach to Excel automation with VBA and a fully programmatic Python solution.
Methods covered:
- Method 1. Copy and Paste CSV Files into Separate Worksheets
- Method 2. Use a VBA Macro to Import Multiple CSV Files
- Method 3. Merge Multiple CSV Files in Python Using Spire.XLS
Method 1. Copy and Paste CSV Files into Separate Worksheets
If you only have a few CSV files to merge, the simplest solution is to copy their contents into different worksheets manually.
One important detail is that you should open each CSV file with Microsoft Excel instead of a text editor such as Notepad . When a CSV is opened in Excel, its rows and columns are parsed correctly based on the delimiter. If you copy the text directly from Notepad, Excel may paste everything into a single column rather than separating the values automatically.
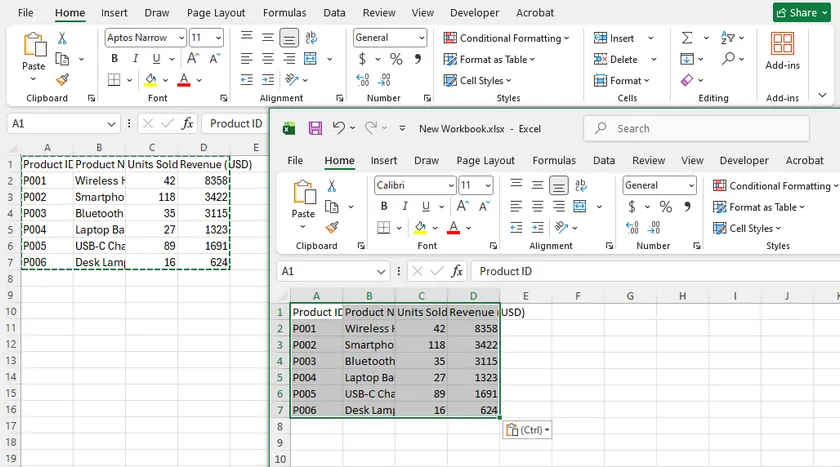
Steps
- Open Microsoft Excel and create a new workbook.
- Open the first CSV file using Excel .
- Select all data ( Ctrl + A ) and copy it ( Ctrl + C ).
- Return to the new workbook and paste the data into the first worksheet.
- Rename the worksheet if necessary.
- Repeat the process for each remaining CSV file, creating a new worksheet each time.
- Save the workbook as an .xlsx file.
Pros
- No programming required.
- Works in every Excel installation.
- Preserves one CSV per worksheet.
- Ideal for occasional tasks involving only a few files.
Cons
- Time-consuming when processing many files.
- Entirely manual.
- Easy to make mistakes when handling dozens of CSV files.
Method 2. Use a VBA Macro to Import Multiple CSV Files
If you frequently perform this task inside Excel, a VBA macro can automate the entire process. The macro scans a folder, opens every CSV file, copies its worksheet into the current workbook, and names the worksheet after the CSV file.
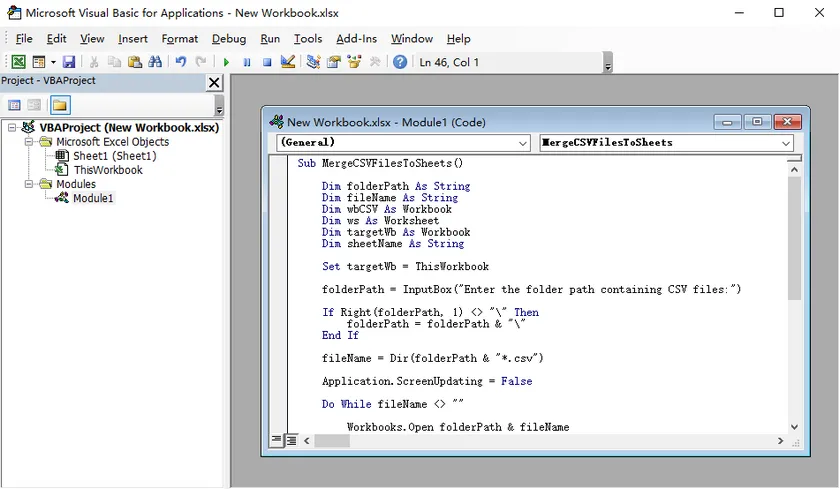
Step 1. Create a Blank Workbook
Open Excel and create a new workbook. This workbook will become the destination workbook that stores all imported worksheets.
Step 2. Open the VBA Editor
Press Alt + F11 to open the Visual Basic Editor.
Choose Insert > Module , then paste the following code into the new module.
Sub MergeCSVFilesToSheets()

    Dim folderPath As String
    Dim fileName As String
    Dim wbCSV As Workbook
    Dim ws As Worksheet
    Dim targetWb As Workbook
    Dim sheetName As String

    Set targetWb = ThisWorkbook

    folderPath = InputBox("Enter the folder path containing CSV files:")

    If Right(folderPath, 1) <> "\" Then
        folderPath = folderPath & "\"
    End If

    fileName = Dir(folderPath & "*.csv")

    Application.ScreenUpdating = False

    Do While fileName <> ""

        Workbooks.Open folderPath & fileName
        Set wbCSV = ActiveWorkbook

        sheetName = Left(fileName, InStrRev(fileName, ".") - 1)

        wbCSV.Worksheets(1).Copy After:=targetWb.Sheets(targetWb.Sheets.Count)
        Set ws = targetWb.Sheets(targetWb.Sheets.Count)

        On Error Resume Next
        ws.Name = Left(sheetName, 31)
        On Error GoTo 0

        wbCSV.Close SaveChanges:=False

        fileName = Dir
    Loop

    Application.ScreenUpdating = True

    MsgBox "CSV files have been merged successfully."

End Sub
Step 3. Run the Macro
Press F5 , enter the folder containing your CSV files, and the macro will automatically import every CSV into its own worksheet.
Pros
- Much faster than manual copying.
- Runs entirely inside Microsoft Excel.
- Automatically creates one worksheet for each CSV file.
- Suitable for users who regularly work with Excel.
Cons
- Requires macro-enabled workbooks.
- Users must enable VBA macros.
- Less suitable for unattended or server-side automation.
Method 3. Merge Multiple CSV Files in Python Using Spire.XLS
For recurring workflows, scheduled jobs, or business applications, programmatic automation is often the most efficient solution.
Many developers immediately think of Pandas for CSV processing. Pandas is an excellent library for reading, analyzing, and transforming tabular data. However, its primary focus is data analysis rather than document generation.
If your workflow continues beyond simply importing CSV files—for example, formatting worksheets, applying styles, inserting charts, protecting workbooks, or exporting the final workbook to PDF—a spreadsheet library such as Free Spire.XLS for Python provides a more complete solution.
First, install the library:
pip install Spire.XLS
Then use the following code to merge every CSV file in a folder into a single Excel workbook, with each CSV becoming a separate worksheet.
import os
from spire.xls import Workbook, WorksheetCopyType, FileFormat

input_folder = "input"
output_folder = "output"

# Create the destination workbook
merged_workbook = Workbook()
merged_workbook.Worksheets.Clear()

# Process every CSV file
for csv_file in os.listdir(input_folder):
    if csv_file.endswith(".csv"):

        input_path = os.path.join(input_folder, csv_file)

        workbook = Workbook()
        workbook.LoadFromFile(input_path, ",", 1, 1)

        sheet = workbook.Worksheets[0]
        merged_workbook.Worksheets.AddCopy(
            sheet,
            WorksheetCopyType.CopyAll
        )

merged_workbook.SaveToFile(
    os.path.join(output_folder, "Merged.xlsx"),
    FileFormat.Version2013
)
Output:
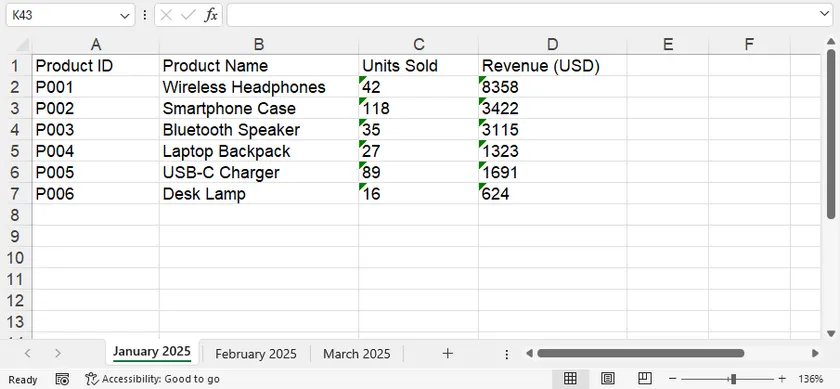
Compared with manual methods or VBA, this approach is much easier to integrate into automated workflows. After generating the workbook, you can continue processing it with Spire.XLS—for example:
- Apply fonts, colors, borders, and number formats.
- Freeze panes or adjust column widths automatically.
- Create charts and pivot tables.
- Protect worksheets or the workbook.
- Export the completed workbook to PDF or other formats.
These capabilities make it suitable not only for CSV merging, but also for end-to-end report generation pipelines.
Comparison of the Three Methods
| Method | Programming Required | Batch Processing | Best For |
|---|---|---|---|
| Copy and Paste | No | Limited | One-time tasks with only a few CSV files |
| VBA Macro | Basic VBA | Yes | Excel users who regularly import CSV files |
| Python + Free Spire.XLS | Python | Excellent | Automated workflows, business applications, and batch processing |
Conclusion
The best method depends on how often you need to perform the task.
If you only need to combine a few CSV files occasionally, manually copying and pasting the data into separate worksheets is the quickest solution.
If you work primarily in Excel and perform this task regularly, a VBA macro can automate the process with minimal effort.
For developers building repeatable workflows or integrating CSV processing into applications, Python with Spire.XLS offers the greatest flexibility. Beyond merging CSV files, it enables advanced spreadsheet manipulation and document generation, making it suitable for a wide range of automation scenarios.
FAQs
Can I merge hundreds of CSV files into one Excel workbook?
Yes. VBA can handle many files, but for very large batches or automated workflows, a Python solution is generally more reliable and scalable.
Will each CSV file become its own worksheet?
Yes. All three methods described in this article preserve each CSV as a separate worksheet instead of combining all data into a single sheet.
Can the worksheet names be based on the CSV filenames?
Yes. Both the VBA macro and the Python example automatically use the CSV filename (without the extension) as the worksheet name.
What if my CSV files use UTF-8 or other encodings?
Most CSV files can be imported without issues. If your files use a different encoding or delimiter, adjust the import settings accordingly before processing.
Can I continue editing the workbook after merging the CSV files?
Absolutely. After the workbook is created, you can format worksheets, insert charts, add formulas, protect the workbook, or export it to PDF just like any other Excel file.
See Also
How to Combine Multiple Word Files into One PDF (4 Easy Methods)
Table of Contents
When you're working with reports, contracts, invoices, or project documentation, it's common to end up with several Word files that need to be shared as a single PDF. Combining them into one document not only makes distribution easier but also keeps the content organized and professional.
Fortunately, there are several ways to accomplish this task. Some methods are ideal for occasional use, while others are better suited for batch processing or automated workflows.
In this guide, we'll explore four practical methods to combine multiple Word documents into a single PDF, ranging from Microsoft Word and online tools to desktop software and C# automation.
Methods covered:
- Method 1. Merge Word Documents in MS Word and Save as PDF
- Method 2. Combine Word Files into One PDF Online
- Method 3. Combine Word Files into One PDF with PDF24 Toolbox
- Method 4. Merge Word Files into One PDF in C#
Method 1. Merge Word Documents in MS Word and Save as PDF
If you only need to combine a few documents occasionally, Microsoft Word provides a built-in solution without requiring additional software. You can insert multiple Word documents into one master document and then export the final result as a PDF.
This method preserves most formatting and is easy to follow, making it a good choice for personal or office use.
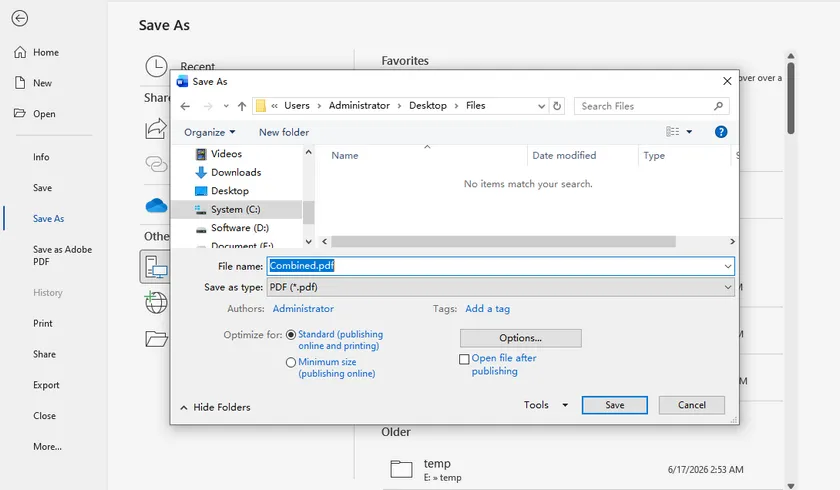
Steps
- Open the Word document that will become the main document.
- Place the cursor where you want to insert another document.
- Select Insert > Object > Text from File.
- Choose the Word files you want to insert.
- Repeat until all documents have been added.
- Click File > Save As or Export.
- Select PDF as the output format and save the file.
Pros
- No additional software required
- Keeps original formatting well
- Suitable for small numbers of documents
Cons
- Documents must be inserted manually
- Not practical for large batches
- No automation support
Method 2. Combine Word Files into One PDF Online
If you don't have Microsoft Word installed or simply want a quick solution, an online document merger can be a convenient alternative. These services work directly in your browser, allowing you to upload multiple Word files and download a merged PDF within minutes.
Online tools are especially useful when you're using a shared computer or only need to merge documents occasionally. However, they may impose file size limits and aren't recommended for confidential documents.
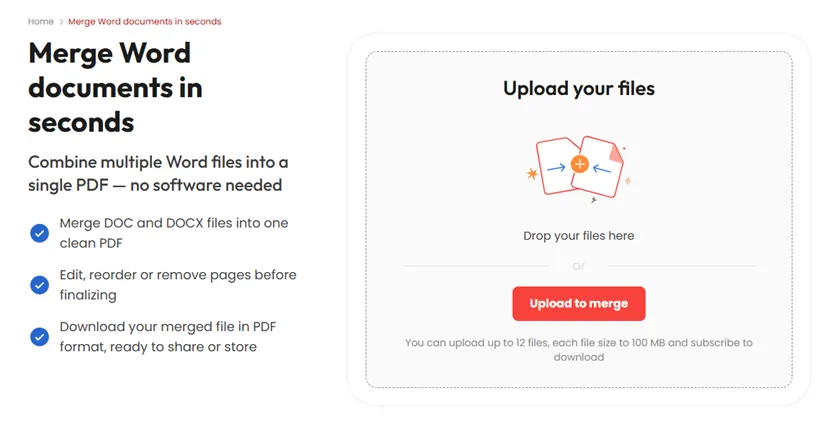
Steps
- Open the Word Merge page (https://pdfaid.com/word-to-merge) on PDFaid.
- Upload all Word documents.
- Arrange the files in the desired order.
- Start the merging process.
- Download the merged PDF.
Pros
- No software installation
- Works on any operating system
- Simple and beginner-friendly
Cons
- Requires an internet connection
- Upload speed depends on file size
- Not ideal for sensitive documents
Method 3. Combine Word Files into One PDF with PDF24 Toolbox
If you frequently work with documents on Windows, PDF24 Toolbox offers a convenient desktop solution. Unlike many PDF utilities, it allows you to load multiple Word documents and combine them directly into a single PDF without first converting each file individually.
Because everything is processed locally, PDF24 Toolbox is also a better choice for documents that shouldn't be uploaded to online services.
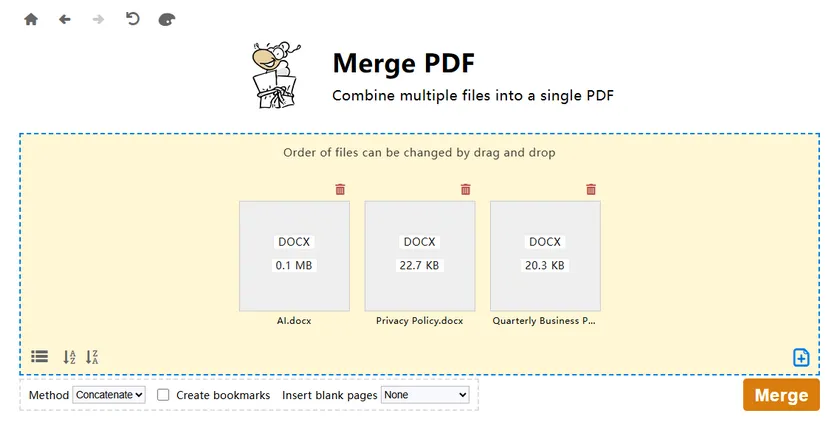
Steps
- Launch PDF24 Toolbox.
- Open the Merge PDF tool.
- Add all Word documents.
- Arrange them in the desired order.
- Click Create PDF .
- Save the merged PDF document.
Pros
- Completely offline
- Free to use
- Supports batch processing
- Better privacy than online tools
Cons
- Windows desktop only
- Requires software installation
Method 4. Merge Word Documents into One PDF in C#
For developers or organizations that regularly generate PDF documents, automating the merging process can save considerable time. Instead of manually combining files, you can load every Word document from a folder, merge them programmatically, and export the final document as a PDF.
Using Spire.Doc for .NET , the entire process requires only a few lines of code while preserving document formatting, images, tables, headers, footers, and other layout elements. It's an ideal solution for report generation, document archiving, and other server-side workflows.
Install Spire.Doc for .NET
PM> Install-Package Spire.Doc
C# Code
using System.IO;
using System.Linq;
using Spire.Doc;

namespace MergeWordFolder
{
    class Program
    {
        static void Main(string[] args)
        {
            // Create the destination document
            Document mergedDocument = new Document();

            // Get all Word files from the folder
            string folderPath = @"Documents";
            string[] files = Directory.GetFiles(folderPath, "*.docx")
                                      .OrderBy(f => f)
                                      .ToArray();

            // Load the first document
            mergedDocument.LoadFromFile(files[0], FileFormat.Docx);

            // Append the remaining documents
            for (int i = 1; i < files.Length; i++)
            {
                mergedDocument.InsertTextFromFile(files[i], FileFormat.Docx);
            }

            // Save as PDF
            mergedDocument.SaveToFile("MergedDocument.pdf", FileFormat.PDF);
        }
    }
}
Why use this approach?
Compared with manual methods, this solution is much more scalable. You can merge dozens or even hundreds of Word documents automatically without user intervention. Since the files are loaded directly from a folder, it's also easy to integrate the code into scheduled tasks, desktop applications, web services, or document management systems.
In addition, Spire.Doc provides many customization options beyond simple merging. For example, you can sort files before merging, adjust page size, add watermarks, protect the generated PDF with passwords, or further process the document after it has been created.
Comparison of the Four Methods
| Method | Installation | Offline | Batch Processing | Best For |
|---|---|---|---|---|
| Microsoft Word | No | Yes | No | Occasional document merging |
| Online Tool | No | No | Limited | Quick one-time tasks |
| PDF24 Toolbox | Yes | Yes | Yes | Frequent desktop users |
| C# + Spire.Doc | Yes | Yes | Excellent | Developers and automation |
Conclusion
Choosing the right method depends on how often you need to combine Word documents.
If you only merge a few files from time to time, Microsoft Word or an online tool will usually be sufficient. If you prefer an offline desktop application, PDF24 Toolbox offers a simple and free solution.
For repetitive tasks, batch processing, or enterprise applications, a C# solution with Spire.Doc for .NET provides the greatest flexibility. By automatically loading all Word documents from a folder, merging them, and exporting the result as a single PDF, it can significantly improve productivity while eliminating repetitive manual work.
FAQs
Can I combine multiple Word documents into one PDF without Microsoft Word?
Yes. You can use an online document merger or desktop software such as PDF24 Toolbox to combine multiple Word files into a single PDF without installing Microsoft Word. These tools are convenient for occasional use, although online services may require uploading your documents to a remote server.
Will the formatting change after merging Word documents?
In most cases, the original formatting—including fonts, images, tables, page orientation, headers, and footers—is preserved. However, the final appearance also depends on the tool you use. Dedicated Word processing libraries, such as Spire.Doc for .NET, generally provide more consistent formatting than browser-based converters.
How can I merge dozens of Word files automatically?
If you need to merge documents on a regular basis, using a programming solution is the most efficient approach. For example, with Spire.Doc for .NET, you can load all Word documents from a folder, merge them in a specified order, and export the combined document as a single PDF with just a few lines of C# code.
Is there a limit to how many Word documents I can merge?
The limit depends on the software or service you use. Microsoft Word and desktop applications are generally constrained only by your system's available memory and processing power, while online tools often impose restrictions on the number of files, total file size, or document length. For large-scale document processing, a desktop or programmatic solution is usually the more reliable choice.