
Knowledgebase (2417)
Children categories
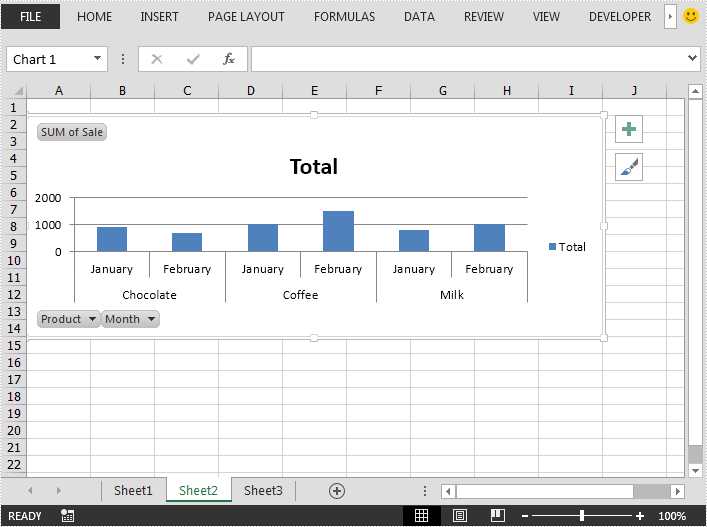
This article demonstrates how to create pivot chart in an Excel file in Java using Spire.XLS for Java.
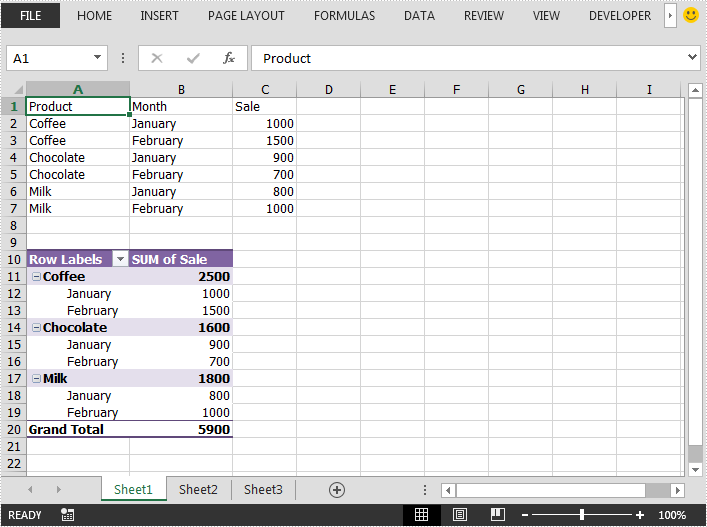
The input Excel file:
import com.spire.xls.*;
import com.spire.xls.core.IPivotTable;

public class CreatePivotChart {
    public static void main(String[] args) {
        //Load the Excel file
        Workbook workbook = new Workbook();
        workbook.loadFromFile("Sample.xlsx");

        //Get the first worksheet
        Worksheet sheet = workbook.getWorksheets().get(0);
        //get the first pivot table in the worksheet
        IPivotTable pivotTable = sheet.getPivotTables().get(0);

        //Add a clustered column chart based on the pivot table data to the second worksheet
        Chart chart = workbook.getWorksheets().get(1).getCharts().add(ExcelChartType.ColumnClustered, pivotTable);
        //Set chart position
        chart.setTopRow(2);
        chart.setBottomRow(15);
        //Set chart title
        chart.setChartTitle("Total");

        //Save the result file
        workbook.saveToFile("CreatPivotChart.xlsx", ExcelVersion.Version2013);
    }
}
Output:
Published in
Pivot Table
Tagged under
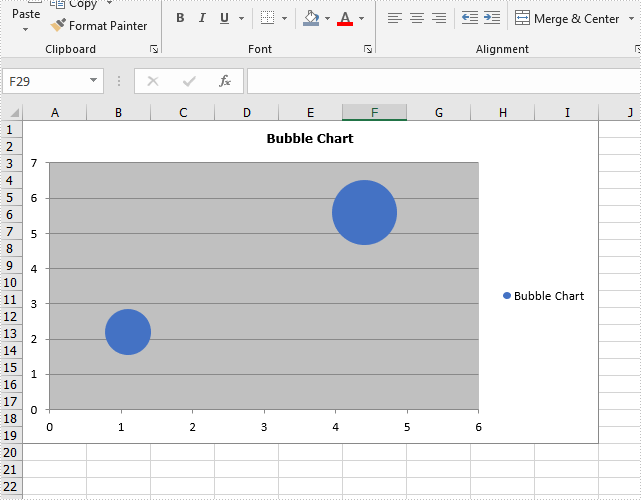
This article will show you how to use Spire.XLS for .NET to create a bubble chart in Excel in C# and VB.NET.
C#
using Spire.Xls;

namespace BubbleChart
{
    class Program
    {
        static void Main(string[] args)

        {
            //Create a new workbook
            Workbook workbook = new Workbook();

            //Add a worksheet and set name
            workbook.CreateEmptySheets(1);
            Worksheet sheet = workbook.Worksheets[0];
            sheet.Name = "Chart data";
            //Initialize chart and set its type
            Chart chart = sheet.Charts.Add(ExcelChartType.Bubble);

            //Set the position of the chart in the worksheet
            chart.LeftColumn = 1;
            chart.RightColumn = 10;
            chart.TopRow = 1;
            chart.BottomRow = 20;

            //Set title for the chart and values
            Spire.Xls.Charts.ChartSerie cs1 = chart.Series.Add("Bubble Chart");
            cs1.EnteredDirectlyValues = new object[] { 2.2, 5.6 };
            cs1.EnteredDirectlyCategoryLabels = new object[] { 1.1, 4.4 };
            cs1.EnteredDirectlyBubbles = new object[] { 3, 6 };

            //Save the document to file
            workbook.SaveToFile("Output.xlsx", ExcelVersion.Version2010);
        }
    }

}
VB.NET
Imports Spire.Xls

Namespace BubbleChart

    Class Program

        Private Shared Sub Main(ByVal args() As String)
            'Create a new workbook
            Dim workbook As Workbook = New Workbook
            'Add a worksheet and set name
            workbook.CreateEmptySheets(1)
            Dim sheet As Worksheet = workbook.Worksheets(0)
            sheet.Name = "Chart data"
            'Initialize chart and set its type
            Dim chart As Chart = sheet.Charts.Add(ExcelChartType.Bubble)
            'Set the position of the chart in the worksheet
            chart.LeftColumn = 1
            chart.RightColumn = 10
            chart.TopRow = 1
            chart.BottomRow = 20
            'Set title for the chart and values
            Dim cs1 As Spire.Xls.Charts.ChartSerie = chart.Series.Add("Bubble Chart")
            cs1.EnteredDirectlyValues = New Object() {2.2, 5.6}
            cs1.EnteredDirectlyCategoryLabels = New Object() {1.1, 4.4}
            cs1.EnteredDirectlyBubbles = New Object() {3, 6}
            'Save the document to file
            workbook.SaveToFile("Output.xlsx", ExcelVersion.Version2010)
        End Sub
    End Class
End Namespace
Effective screenshot of Excel Bubble chart:
Published in
Chart
Tagged under
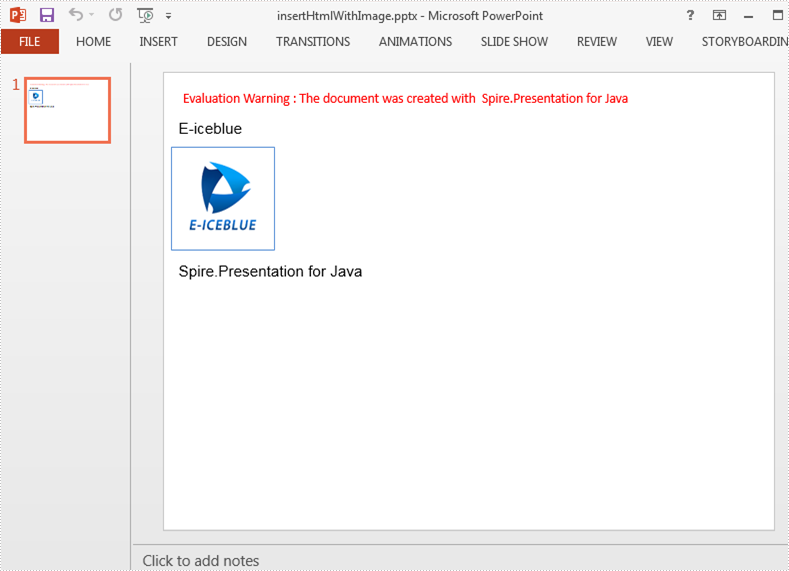
We have already demonstrated how to insert HTML formatted text to a Presentation slide by using Spire.Presentation for Java. This article will introduce the way to insert HTML with images to PowerPoint and each html tag will be added to the slide as a separate shape.
import com.spire.presentation.*;
import com.spire.presentation.collections.*;

public class AddHTMLWithImage {
    public static void main(String[] args) throws Exception {
        //Create an instance of presentation document
        Presentation ppt = new Presentation();
        //Get the shapes on the first slide.
        ShapeList shapes = ppt.getSlides().get(0).getShapes();
        //Add contents to shapes from HTML codes, which includes text and image.
        shapes.addFromHtml("<html><div><p>E-iceblue</p>" +
                "<p><img src='https://cdn.e-iceblue.com/C:\\Users\\Test1\\Desktop\\logo.png'/></p>" +
                "<p>Spire.Presentation for Java</p></html>");

        //Save the document
        String result = "output/insertHtmlWithImage.pptx";
        ppt.saveToFile(result, FileFormat.PPTX_2013);
    }
}
Published in
Paragraph and Text
Tagged under
