
Knowledgebase (2417)
Children categories
Nowadays, we're facing a bigger chance to download a file from URL since more documents are electronically delivered by internet. In this article, I'll introduce how to download a Word document from URL programmatically using Spire.Doc in C#, VB.NET.
Spire.Doc does not provide a method to download a Word file directly from URL. However, you can download the file from URL into a MemoryStream and then use Spire.Doc to load the document from MemoryStream and save as a new Word document to local folder.
Code Snippet:
Step 1: Initialize a new Word document.
Document doc = new Document();
Step 2: Initialize a new instance of WebClient class.
WebClient webClient = new WebClient();
Step 3: Call WebClient.DownloadData(string address) method to load the data from URL. Save the data to a MemoryStream, then call Document.LoadFromStream() method to load the Word document from MemoryStream.
using (MemoryStream ms = new MemoryStream(webClient.DownloadData("http://www.e-iceblue.com/images/test.docx")))
{
    doc.LoadFromStream(ms,FileFormat.Docx);
}
Step 4: Save the file.
doc.SaveToFile("result.docx",FileFormat.Docx);
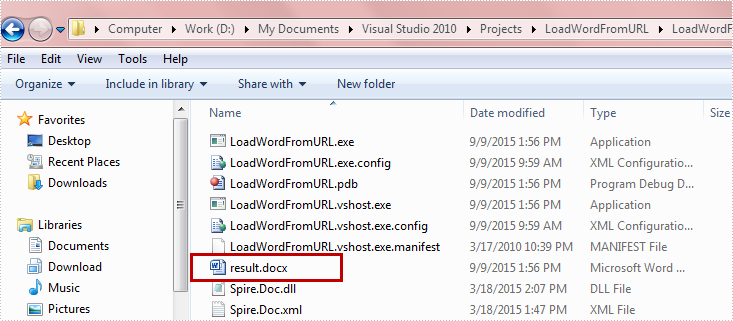
Run the program, the targeted file will be downloaded and saved as a new Word file in Bin folder.
Full Code:
using Spire.Doc;
using System.IO;
using System.Net;

namespace DownloadfromURL
{
    class Program
    {
        static void Main(string[] args)
        {
            Document doc = new Document();
            WebClient webClient = new WebClient();
            using (MemoryStream ms = new MemoryStream(webClient.DownloadData("http://www.e-iceblue.com/images/test.docx")))
            {
                doc.LoadFromStream(ms, FileFormat.Docx);
            }
            doc.SaveToFile("result.docx", FileFormat.Docx);
        }
    }
}
Imports Spire.Doc
Imports System.IO
Imports System.Net
Namespace DownloadfromURL
	Class Program
		Private Shared Sub Main(args As String())
			Dim doc As New Document()
			Dim webClient As New WebClient()
Using ms As New MemoryStream(webClient.DownloadData("http://www.e-iceblue.com/images/test.docx"))
				doc.LoadFromStream(ms, FileFormat.Docx)
			End Using
			doc.SaveToFile("result.docx", FileFormat.Docx)

		End Sub
	End Class
End Namespace
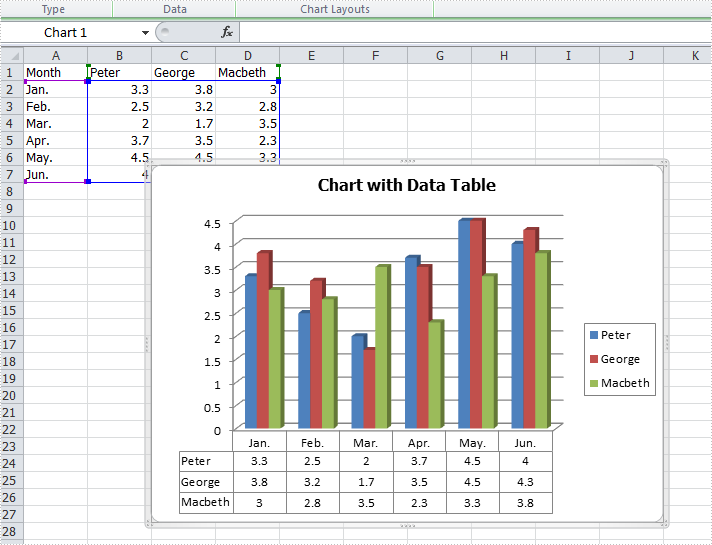
In Excel, we could use charts to visualize and compare data. However, once the charts are created, it becomes much difficult for us to read the data precisely from charts. Adding a data table below the chart is a good solution for which the chart and data are on the same place. This article is going to introduce the method to add a data table to the chart that is based on the data in C# using Spire.XLS.
Note: before start, please download the latest version of Spire.XLS and add the .dll in the bin folder as the reference of Visual studio.
Step 1: Create a new workbook and add an empty sheet.
            Workbook workbook = new Workbook();
            workbook.CreateEmptySheets(1);
            Worksheet sheet = workbook.Worksheets[0];
Step 2: Fill cells with sample data.
            sheet.Name = "Demo";
            sheet.Range["A1"].Value = "Month";
            sheet.Range["A2"].Value = "Jan.";
            sheet.Range["A3"].Value = "Feb.";
            sheet.Range["A4"].Value = "Mar.";
            sheet.Range["A5"].Value = "Apr.";
            sheet.Range["A6"].Value = "May.";
            sheet.Range["A7"].Value = "Jun.";
            sheet.Range["B1"].Value = "Peter";
            sheet.Range["B2"].NumberValue = 3.3;
            sheet.Range["B3"].NumberValue = 2.5;
            sheet.Range["B4"].NumberValue = 2.0;
            sheet.Range["B5"].NumberValue = 3.7;
            sheet.Range["B6"].NumberValue = 4.5;
            sheet.Range["B7"].NumberValue = 4.0;
            sheet.Range["C1"].Value = "George";
            sheet.Range["C2"].NumberValue = 3.8;
            sheet.Range["C3"].NumberValue = 3.2;
            sheet.Range["C4"].NumberValue = 1.7;
            sheet.Range["C5"].NumberValue = 3.5;
            sheet.Range["C6"].NumberValue = 4.5;
            sheet.Range["C7"].NumberValue = 4.3;
            sheet.Range["D1"].Value = "Macbeth";
            sheet.Range["D2"].NumberValue = 3.0;
            sheet.Range["D3"].NumberValue = 2.8;
            sheet.Range["D4"].NumberValue = 3.5;
            sheet.Range["D5"].NumberValue = 2.3;
            sheet.Range["D6"].NumberValue = 3.3;
            sheet.Range["D7"].NumberValue = 3.8;
Step 3: Create a Column3DClustered based on the sample data.
            Chart chart = sheet.Charts.Add(ExcelChartType.Column3DClustered);
            chart.DataRange = sheet.Range["B1:D7"];
            chart.SeriesDataFromRange = false;
            chart.TopRow = 7;
            chart.BottomRow = 28;
            chart.LeftColumn = 3;
            chart.RightColumn =11;
            chart.ChartTitle = "Chart with Data Table";
            chart.ChartTitleArea.IsBold = true;
            chart.ChartTitleArea.Size = 12;
            Spire.Xls.Charts.ChartSerie cs1 = chart.Series[0];
            cs1.CategoryLabels = sheet.Range["A2:A7"];
Step 4: Add a data table to the chart that is based on the data.
chart.HasDataTable = true;
Step 5: Save the document and launch to see effects.
            workbook.SaveToFile("S3.xlsx", ExcelVersion.Version2010);
            System.Diagnostics.Process.Start("S3.xlsx");
Effects:
Full codes:
using System;
using System.Collections.Generic;
using System.Linq;
using System.Text;
using Spire.Xls;
using System.Drawing;

namespace ConsoleApplication2
{
    class Program
    {
        static void Main(string[] args)
        {

            Workbook workbook = new Workbook();
            workbook.CreateEmptySheets(1);
            Worksheet sheet = workbook.Worksheets[0];

            sheet.Name = "Demo";
            sheet.Range["A1"].Value = "Month";
            sheet.Range["A2"].Value = "Jan.";
            sheet.Range["A3"].Value = "Feb.";
            sheet.Range["A4"].Value = "Mar.";
            sheet.Range["A5"].Value = "Apr.";
            sheet.Range["A6"].Value = "May.";
            sheet.Range["A7"].Value = "Jun.";
            sheet.Range["B1"].Value = "Peter";
            sheet.Range["B2"].NumberValue = 3.3;
            sheet.Range["B3"].NumberValue = 2.5;
            sheet.Range["B4"].NumberValue = 2.0;
            sheet.Range["B5"].NumberValue = 3.7;
            sheet.Range["B6"].NumberValue = 4.5;
            sheet.Range["B7"].NumberValue = 4.0;
            sheet.Range["C1"].Value = "George";
            sheet.Range["C2"].NumberValue = 3.8;
            sheet.Range["C3"].NumberValue = 3.2;
            sheet.Range["C4"].NumberValue = 1.7;
            sheet.Range["C5"].NumberValue = 3.5;
            sheet.Range["C6"].NumberValue = 4.5;
            sheet.Range["C7"].NumberValue = 4.3;
            sheet.Range["D1"].Value = "Macbeth";
            sheet.Range["D2"].NumberValue = 3.0;
            sheet.Range["D3"].NumberValue = 2.8;
            sheet.Range["D4"].NumberValue = 3.5;
            sheet.Range["D5"].NumberValue = 2.3;
            sheet.Range["D6"].NumberValue = 3.3;
            sheet.Range["D7"].NumberValue = 3.8;

            Chart chart = sheet.Charts.Add(ExcelChartType.Column3DClustered);
            chart.DataRange = sheet.Range["B1:D7"];
            chart.SeriesDataFromRange = false;
            chart.TopRow = 7;
            chart.BottomRow = 28;
            chart.LeftColumn = 3;
            chart.RightColumn =11;
            chart.ChartTitle = "Chart with Data Table";
            chart.ChartTitleArea.IsBold = true;
            chart.ChartTitleArea.Size = 12;
            Spire.Xls.Charts.ChartSerie cs1 = chart.Series[0];
            cs1.CategoryLabels = sheet.Range["A2:A7"];
            chart.HasDataTable = true;

            workbook.SaveToFile("S3.xlsx", ExcelVersion.Version2010);
            System.Diagnostics.Process.Start("S3.xlsx");
        }
    }
}
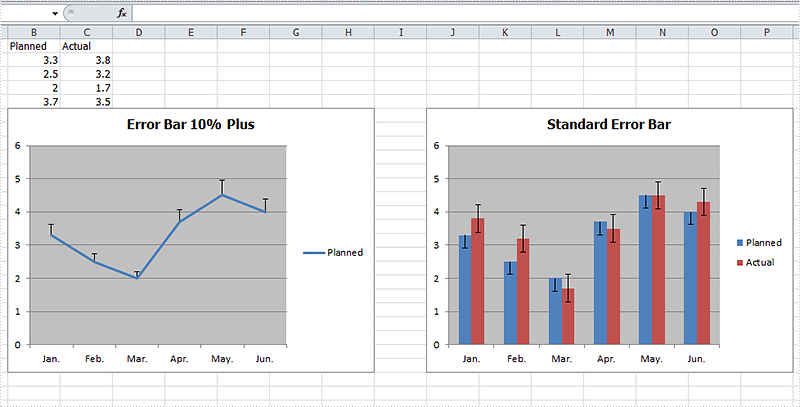
Error bars are a graphical representation of the variability of data and helps us see margins of error and standard deviations immediately in charts with a standard error amount, a percentage, a standard deviation or a custom error amount. Error bars can be used in 2-D area, bar, column, line, scatter, and bubble charts, which are all supported by Spire.XLS. This article is going to introduce the method to add error bars to a chart in C# using Spire.XLS.
Note: before start, please download the latest version of Spire.XLS and add the .dll in the bin folder as the reference of Visual Studio.
Step 1: Create a workbook and fill the sample data in sheet.
            Workbook workbook = new Workbook();
            workbook.CreateEmptySheets(1);
            Worksheet sheet = workbook.Worksheets[0];
            sheet.Name = "Demo";
            sheet.Range["A1"].Value = "Month";
            sheet.Range["A2"].Value = "Jan.";
            sheet.Range["A3"].Value = "Feb.";
            sheet.Range["A4"].Value = "Mar.";
            sheet.Range["A5"].Value = "Apr.";
            sheet.Range["A6"].Value = "May.";
            sheet.Range["A7"].Value = "Jun.";
            sheet.Range["B1"].Value = "Planned";
            sheet.Range["B2"].NumberValue = 3.3;
            sheet.Range["B3"].NumberValue = 2.5;
            sheet.Range["B4"].NumberValue = 2.0;
            sheet.Range["B5"].NumberValue = 3.7;
            sheet.Range["B6"].NumberValue = 4.5;
            sheet.Range["B7"].NumberValue = 4.0;
            sheet.Range["C1"].Value = "Actual";
            sheet.Range["C2"].NumberValue = 3.8;
            sheet.Range["C3"].NumberValue = 3.2;
            sheet.Range["C4"].NumberValue = 1.7;
            sheet.Range["C5"].NumberValue = 3.5;
            sheet.Range["C6"].NumberValue = 4.5;
            sheet.Range["C7"].NumberValue = 4.3;
Step 2: Add a line chart and then add percentage error bar to the chart. The direction of error bars can be set as both, minus and plus and the type of error bars can be set as fixed value, percentage, standard deviation, standard error or custom. After setting the direction and type, we can set the amount.
            Chart chart = sheet.Charts.Add(ExcelChartType.Line);
            chart.DataRange = sheet.Range["B1:B7"];
            chart.SeriesDataFromRange = false;
            chart.TopRow = 6;
            chart.BottomRow = 25;
            chart.LeftColumn = 2;
            chart.RightColumn = 9;
            chart.ChartTitle = "Error Bar 10% Plus";
            chart.ChartTitleArea.IsBold = true;
            chart.ChartTitleArea.Size = 12;
            Spire.Xls.Charts.ChartSerie cs1 = chart.Series[0];
            cs1.CategoryLabels = sheet.Range["A2:A7"];
            cs1.ErrorBar(true, ErrorBarIncludeType.Plus, ErrorBarType.Percentage,10);
Step 3: Add a column chart with standard error bars as comparison.
            Chart chart2 = sheet.Charts.Add(ExcelChartType.ColumnClustered);
            chart2.DataRange = sheet.Range["B1:C7"];
            chart2.SeriesDataFromRange = false;
            chart2.TopRow = 6;
            chart2.BottomRow = 25;
            chart2.LeftColumn = 10;
            chart2.RightColumn = 17;
            chart2.ChartTitle = "Standard Error Bar";
            chart2.ChartTitleArea.IsBold = true;
            chart2.ChartTitleArea.Size = 12;
            Spire.Xls.Charts.ChartSerie cs2 = chart2.Series[0];
            cs2.CategoryLabels = sheet.Range["A2:A7"];
            cs2.ErrorBar(true, ErrorBarIncludeType.Minus, ErrorBarType.StandardError, 0.3);
            Spire.Xls.Charts.ChartSerie cs3 = chart2.Series[1];
            cs3.ErrorBar(true, ErrorBarIncludeType.Both, ErrorBarType.StandardError, 0.5);
Step 4: Save the document and launch to see effects.
            workbook.SaveToFile("S3.xlsx", ExcelVersion.Version2010);
            System.Diagnostics.Process.Start("S3.xlsx");
Effects:
Full Codes:
using System;
using System.Collections.Generic;
using System.Linq;
using System.Text;
using Spire.Xls;
using System.Drawing;

namespace ConsoleApplication2
{
    class Program
    {
        static void Main(string[] args)
        {

            Workbook workbook = new Workbook();
            workbook.CreateEmptySheets(1);
            Worksheet sheet = workbook.Worksheets[0];
            sheet.Name = "Demo";
            sheet.Range["A1"].Value = "Month";
            sheet.Range["A2"].Value = "Jan.";
            sheet.Range["A3"].Value = "Feb.";
            sheet.Range["A4"].Value = "Mar.";
            sheet.Range["A5"].Value = "Apr.";
            sheet.Range["A6"].Value = "May.";
            sheet.Range["A7"].Value = "Jun.";
            sheet.Range["B1"].Value = "Planned";
            sheet.Range["B2"].NumberValue = 3.3;
            sheet.Range["B3"].NumberValue = 2.5;
            sheet.Range["B4"].NumberValue = 2.0;
            sheet.Range["B5"].NumberValue = 3.7;
            sheet.Range["B6"].NumberValue = 4.5;
            sheet.Range["B7"].NumberValue = 4.0;
            sheet.Range["C1"].Value = "Actual";
            sheet.Range["C2"].NumberValue = 3.8;
            sheet.Range["C3"].NumberValue = 3.2;
            sheet.Range["C4"].NumberValue = 1.7;
            sheet.Range["C5"].NumberValue = 3.5;
            sheet.Range["C6"].NumberValue = 4.5;
            sheet.Range["C7"].NumberValue = 4.3;

            Chart chart = sheet.Charts.Add(ExcelChartType.Line);
            chart.DataRange = sheet.Range["B1:B7"];
            chart.SeriesDataFromRange = false;
            chart.TopRow = 6;
            chart.BottomRow = 25;
            chart.LeftColumn = 2;
            chart.RightColumn = 9;
            chart.ChartTitle = "Error Bar 10% Plus";
            chart.ChartTitleArea.IsBold = true;
            chart.ChartTitleArea.Size = 12;
            Spire.Xls.Charts.ChartSerie cs1 = chart.Series[0];
            cs1.CategoryLabels = sheet.Range["A2:A7"];
            cs1.ErrorBar(true, ErrorBarIncludeType.Plus, ErrorBarType.Percentage,10);

            Chart chart2 = sheet.Charts.Add(ExcelChartType.ColumnClustered);
            chart2.DataRange = sheet.Range["B1:C7"];
            chart2.SeriesDataFromRange = false;
            chart2.TopRow = 6;
            chart2.BottomRow = 25;
            chart2.LeftColumn = 10;
            chart2.RightColumn = 17;
            chart2.ChartTitle = "Standard Error Bar";
            chart2.ChartTitleArea.IsBold = true;
            chart2.ChartTitleArea.Size = 12;
            Spire.Xls.Charts.ChartSerie cs2 = chart2.Series[0];
            cs2.CategoryLabels = sheet.Range["A2:A7"];
            cs2.ErrorBar(true, ErrorBarIncludeType.Minus, ErrorBarType.StandardError, 0.3);
            Spire.Xls.Charts.ChartSerie cs3 = chart2.Series[1];
            cs3.ErrorBar(true, ErrorBarIncludeType.Both, ErrorBarType.StandardError, 0.5);

            workbook.SaveToFile("S3.xlsx", ExcelVersion.Version2010);
            System.Diagnostics.Process.Start("S3.xlsx");

        }
    }
}
