
Knowledgebase (2344)
Children categories
Macros in Word documents are small programs created using the Visual Basic for Applications (VBA) language. They are designed to automate repetitive tasks or add advanced functionality. While these macros can be powerful tools for improving productivity, they also pose security risks if used maliciously. Therefore, it is essential to detect and remove potentially harmful macros from Word documents, especially when handling files from untrusted sources. In this article, we will explain how to detect and remove VBA macros in Word documents in Python using Spire.Doc for Python.
- Detect Whether a Word Document Contains VBA Macros in Python
- Remove VBA Macros from a Word Document in Python
Install Spire.Doc for Python
This scenario requires Spire.Doc for Python and plum-dispatch v1.7.4. They can be easily installed in your Windows through the following pip command.
pip install Spire.Doc
If you are unsure how to install, please refer to this tutorial: How to Install Spire.Doc for Python on Windows
Detect Whether a Word Document Contains VBA Macros in Python
Spire.Doc for Python provides the Document.IsContainMacro property, enabling developers to check whether a Word document contains VBA macros easily. This property returns a boolean value: True indicates that the document includes one or more VBA macros, while False indicates that no macros are present in the document.
The following steps explain how to detect whether a Word document contains VBA macros using Spire.Doc for Python:
- Initialize an instance of the Document class.
- Load a Word document using the Document.LoadFromFile() method.
- Detect whether the document includes VBA macros using the Document.IsContainMacro property.
- Python
from spire.doc import *
from spire.doc.common import *
# Initialize an instance of the Document class
document = Document()
# Load a Word document
document.LoadFromFile("Test.docm")
# Detect if the document contains VBA macros
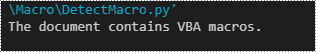
if document.IsContainMacro:
print("The document contains VBA macros.")
else:
print("The document does not contain any VBA macros.")
document.Close()
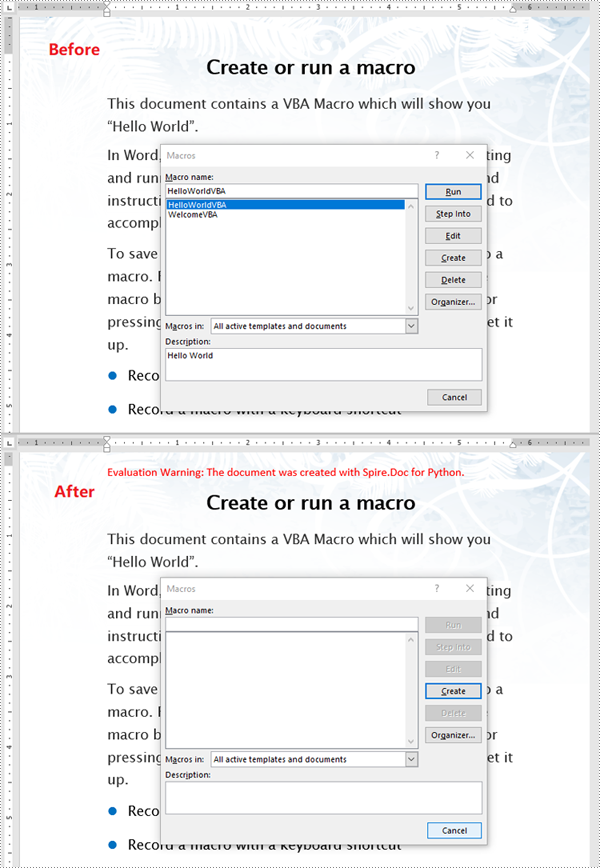
Remove VBA Macros from a Word Document in Python
Developers can remove all macros from a Word document at once by using the Document.ClearMacros() method. The detailed steps are as follows.
- Initialize an instance of the Document class.
- Load a Word document using the Document.LoadFromFile() method.
- Remove all macros from the document using the Document.ClearMacros() method.
- Save the result document using the Document.SaveToFile() method.
- Python
from spire.doc import *
from spire.doc.common import *

# Initialize an instance of the Document class
document = Document()
# Load a Word document
document.LoadFromFile("Test.docm")

# Remove all VBA macros from the document
document.ClearMacros()

# Save the modified document to a docm file
document.SaveToFile("RemoveMacros.docm", FileFormat.Docm2016)
document.Close()
Apply for a Temporary License
If you'd like to remove the evaluation message from the generated documents, or to get rid of the function limitations, please request a 30-day trial license for yourself.
Textboxes in a Word document serve as versatile containers for text, enabling users to enhance layout and design. They allow for the separation of content from the main body, making documents more visually appealing and organized. Extracting or updating textboxes can be essential for improving document efficiency, ensuring information is current, and facilitating data analysis.
In this article, you will learn how to extract or update textboxes in a Word document using Python and Spire.Doc for Python.
Install Spire.Doc for Python
This scenario requires Spire.Doc for Python and plum-dispatch v1.7.4. They can be easily installed in your Windows through the following pip command.
pip install Spire.Doc
If you are unsure how to install, please refer to this tutorial: How to Install Spire.Doc for Python on Windows
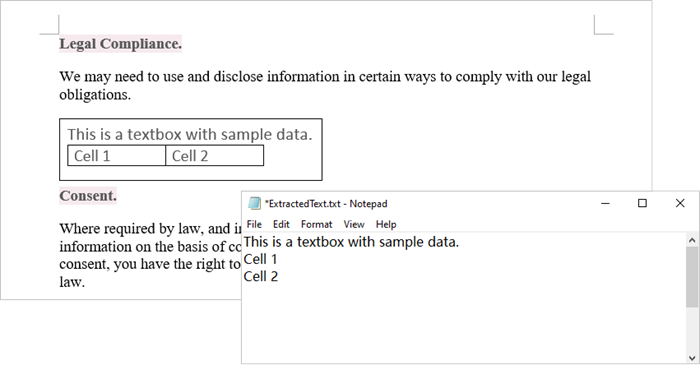
Extract Text from a Textbox in Word
Using Spire.Doc for Python, you can access a specific text box in a document by utilizing the Document.TextBoxes[index] property. After retrieving the text box, you can iterate through its child objects to identify whether each one is a paragraph or a table. If the object is a paragraph, you can retrieve its text using the Paragraph.Text property. In cases where the object is a table, you will need to loop through each cell to extract text from every individual cell within that table.
The steps to extract text from a text box in a Word document are as follows:
- Create a Document object.
- load a Word file by using Document.LoadFromFile() method.
- Access a specific text box using Document.TextBoxes[index] property.
- Iterate through the child objects within the text box.
- Determine if a child object is a paragraph. If it is, retrieve the text from the paragraph using Paragraph.Text property.
- Check if a child object is a table. If so, iterate through the cells in the table to extract text from each cell.
- Python
from spire.doc import *
from spire.doc.common import *

# Create a Document object
document = Document()

# Load a Word file
document.LoadFromFile("C:\\Users\\Administrator\\Desktop\\input.docx")

# Get a specific textbox
textBox = document.TextBoxes.get_Item(0)

with open('ExtractedText.txt','w') as sw:

    # Iterate through the child objects in the textbox
    for i in range(textBox.ChildObjects.Count):

        # Get a specific child object
        object = textBox.ChildObjects.get_Item(i)

        # Determine if the child object is paragraph
        if object.DocumentObjectType == DocumentObjectType.Paragraph:

            # Write paragraph text to txt file
            sw.write((object if isinstance(object, Paragraph) else None).Text + "\n")

        # Determine if the child object is table
        if object.DocumentObjectType == DocumentObjectType.Table:
            table = object if isinstance(object, Table) else None
            for i in range(table.Rows.Count):
                row = table.Rows[i]
                for j in range(row.Cells.Count):
                    cell = row.Cells[j]
                    for k in range(cell.Paragraphs.Count):
                        paragraph = cell.Paragraphs.get_Item(k)

                        # Write paragrah text of a specific cell to txt file
                        sw.write(paragraph.Text + "\n")

# Dispose resources
document.Dispose()
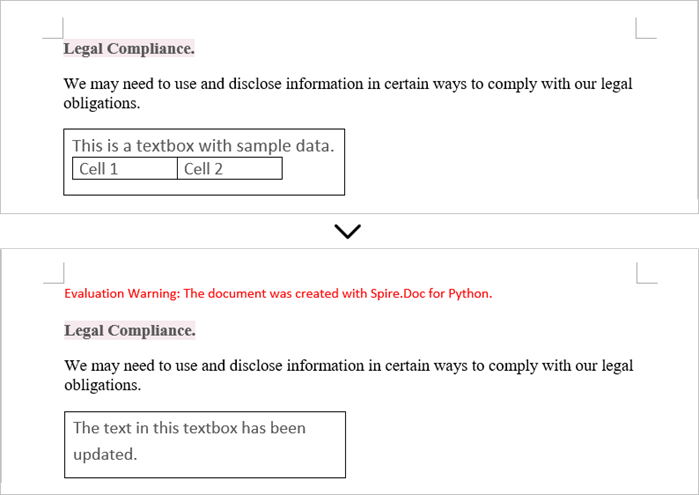
Update Text in a Textbox in Word
To update a textbox in a Word document, start by clearing its existing content with the TextBox.ChildObjects.Clear() method. This action removes all child objects, including any paragraphs or tables currently contained within the textbox. After clearing the content, you can add a new paragraph to the text box. Once the paragraph is created, set its text to the desired value.
The steps to update a textbox in a Word document are as follows:
- Create a Document object.
- Load a Word file using Document.LoadFromFile() method.
- Get a specific textbox using Document.TextBoxes[index] property
- Remove existing content of the textbox using TextBox.ChildObjects.Clear() method.
- Add a paragraph to the textbox using TextBox.Body.AddParagraph() method.
- Add text to the paragraph using Paragraph.AppendText() method.
- Save the document to a different Word file.
- Python
from spire.doc import *
from spire.doc.common import *

# Create a Document object
document = Document()

# Load a Word file
document.LoadFromFile("C:\\Users\\Administrator\\Desktop\\Input.docx")

# Get a specific textbox
textBox = document.TextBoxes.get_Item(0)

# Remove child objects of the textbox
textBox.ChildObjects.Clear()

# Add a new paragraph to the textbox
paragraph = textBox.Body.AddParagraph()

# Set line spacing
paragraph.Format.LineSpacing = 15.0

# Add text to the paragraph
textRange = paragraph.AppendText("The text in this textbox has been updated.")

# Set font size
textRange.CharacterFormat.FontSize = 15.0

# Save the document to a different Word file
document.SaveToFile("UpdateTextbox.docx", FileFormat.Docx2019);

# Dispose resources
document.Dispose()
Apply for a Temporary License
If you'd like to remove the evaluation message from the generated documents, or to get rid of the function limitations, please request a 30-day trial license for yourself.
Python: Save Shapes as Image Files in PowerPoint Presentations
2024-10-21 01:03:20 Written by KoohjiExtracting and repurposing elements from PowerPoint presentations is a valuable skill for cross-platform content sharing. By converting shapes from slides into standalone image files, users can seamlessly integrate them into documents, web pages, or design projects without losing their original formatting and visual effects. With Python, this process becomes straightforward. In this article, we'll explore how to use Spire.Presentation for Python to save shapes from presentation slides as image files with simple Python code.
- Save Shapes from Slides as Image Files with Python
- Save Images from Slides with Formatting as Images Files
Install Spire.Presentation for Python
This scenario requires Spire.Presentation for Python and plum-dispatch v1.7.4. They can be easily installed in your Windows through the following pip command.
pip install Spire.Presentation
If you are unsure how to install, please refer to: How to Install Spire.Presentation for Python on Windows
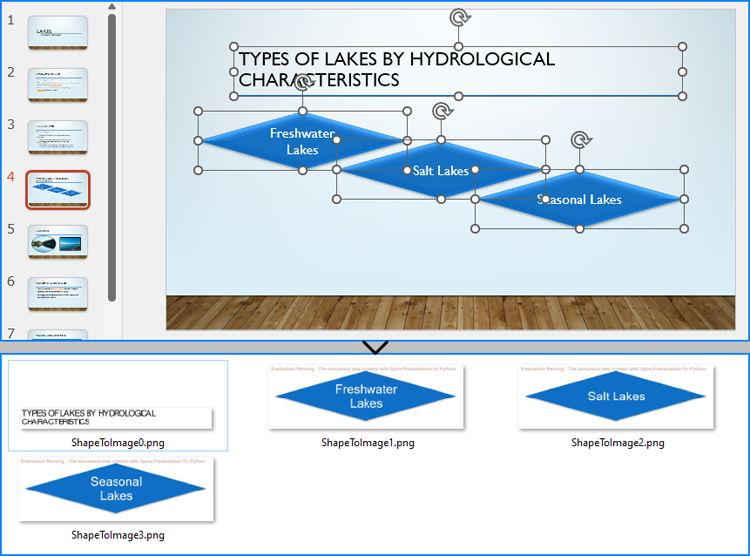
Save Shapes from Slides as Image Files with Python
Spire.Presentation for Python provides the Slide.Shapes.SaveAsImage(shapIndex: int, dpiX: int, dpiY: int) method to save shapes in presentation slides as images with the specified DPI(optional). With this method, developers can save either a specific shape or all shapes in a PowerPoint presentation. The detailed steps are as follows:
- Create an instance of Presentation class.
- Load a PowerPoint presentation using Presentation.LoadFromFile() method.
- Get a slide using Presentation.Slides.get_Item() method.
- Iterate through the shapes in the slide:
- Save each shape as an image stream using Slide.Shapes.SaveAsImage() method.
- Save the image stream as an image file using Stream.Save() method.
- Python
from spire.presentation import *

# Create an instance of Presentation
presentation = Presentation()

# Load a PowerPoint file
presentation.LoadFromFile("Sample.pptx")

# Get the first slide
slide = presentation.Slides.get_Item(3)

# Save the shape as an image stream
for i in range(slide.Shapes.Count):
  imageStream = slide.Shapes.SaveAsImage(i, 256, 256)
  # Save the image
  imageStream.Save(f"output/Shapes/ShapeToImage{i}.png")

# Release resources
presentation.Dispose()
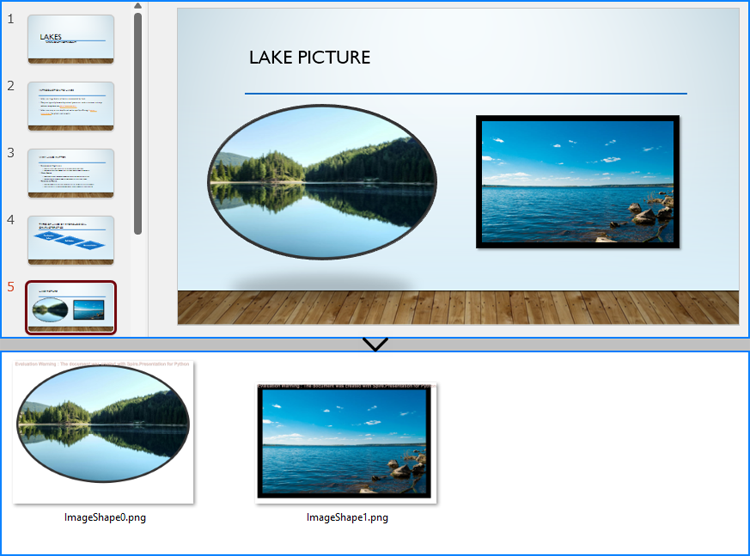
Save Images from Slides with Formatting as Images Files
By using the methods provided by Spire.Presentation for Python, developers can also save images from slides as image files while preserving the edits and formatting applied to them. This requires first checking if the shape is an object of SlidePicture class, and if so, the shape can be saved as an image file. The detailed steps are as follows:
- Create an instance of Presentation class.
- Load a PowerPoint presentation using Presentation.LoadFromFile() method.
- Get a slide using Presentation.Slides.get_Item() method.
- Iterate through the shapes in the slide:
- Check if each shape is an object of SlidePicture class.
- If it is, save the shape as an image stream using Slide.Shapes.SaveAsImage() method.
- Save the image stream to a file using Stream.Save() method.
- Python
from spire.presentation import *

# Create an instance of Presentation
presentation = Presentation()

# Load a PowerPoint file
presentation.LoadFromFile("Sample.pptx")

# Get a slide
slide = presentation.Slides.get_Item(4)

# Iterate through all shapes in the slide
i = 0
for shape in slide.Shapes:
  # Check if the shape is an object of SlidePicture
  if isinstance(shape, SlidePicture):
    # Save the shape as an image
    shape = shape if isinstance(shape, SlidePicture) else None
    image = slide.Shapes.SaveAsImage(slide.Shapes.IndexOf(shape), 256, 256)
    image.Save(f"output/Images/ImageShape{i}.png")
    i += 1

# Release resources
presentation.Dispose()
Apply for a Temporary License
If you'd like to remove the evaluation message from the generated documents, or to get rid of the function limitations, please request a 30-day trial license for yourself.
