
Knowledgebase (2344)
Children categories
How to Integrate Spire.Doc for JavaScript in a Node.js Project
2024-12-09 08:31:04 Written by AdministratorDocument processing is an essential feature in many modern web applications, enabling tasks such as report generation and data management. Node.js, known for its non-blocking I/O model and extensive ecosystem, provides a powerful platform for backend development. By integrating Spire.Doc for JavaScript, you can streamline the creation and manipulation of Word documents effortlessly.
This guide will take you through the steps to integrate Spire.Doc for JavaScript into your Node.js projects, from initial setup to a basic usage example.
- Benefits of Using Spire.Doc for JavaScript in Node.js Projects
- Set Up Your Environment
- Integrate Spire.Doc for JavaScript in Your Project
- Create and Save Word Files Using JavaScript
Benefits of Using Spire.Doc for JavaScript in Node.js Projects
Node.js is a powerful runtime environment that allows developers to build scalable network applications using JavaScript. Spire.Doc for JavaScript, on the other hand, is a versatile library designed to manipulate Word documents within JavaScript environments. It provides a wide range of features, including document creation, editing, conversion, and more, making it a valuable tool for developers working with document-based applications.
Integrating Spire.Doc for JavaScript into your Node.js project offers numerous benefits, including:
- Efficient Document Management: Easily create, edit, and manage Word documents without the need for Microsoft Word.
- Scalability: Leverage Node.js's non-blocking I/O model to handle large volumes of document processing tasks efficiently.
- Cross-Platform Compatibility: Use Spire.Doc for JavaScript across various platforms, including Windows, macOS, and Linux.
- Ease of Integration: Seamlessly integrate Spire.Doc for JavaScript with other Node.js libraries and tools.
These benefits make Spire.Doc for JavaScript an ideal choice for developers looking to enhance their Node.js projects with robust document processing capabilities.
Set Up Your Environment
Step 1
Download and install Node.js from the official website. Make sure to choose the version that matches your operating system.
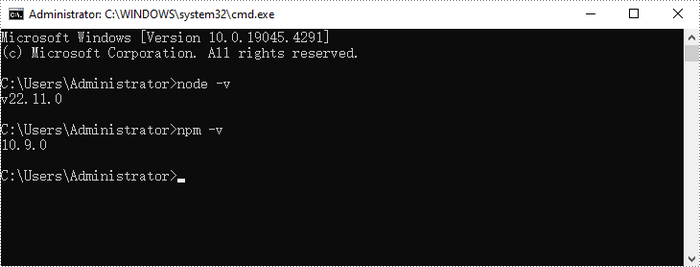
After the installation is complete, you can verify that Node.js and npm are installed correctly, along with the version numbers, by entering the following commands in CMD:
node -v
npm -v
Step 2
Initialize a Node.js project:
npm init -yInstallation dependencies:
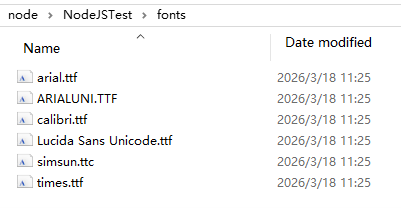
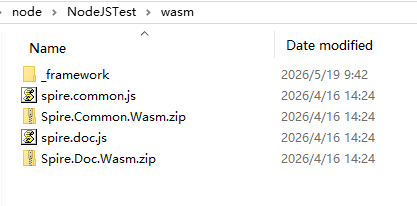
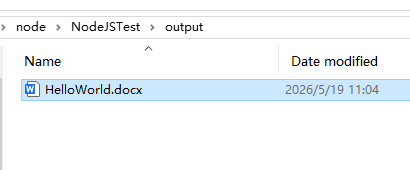
npm install adm-zip@^0.5.16 Configure packaging.json: Customize folder in the root directory to put some font files, you can customize and add fonts based on the font used in your documents. Download Spire.Doc for JavaScript from our website and unzip it to a location on your disk. The downloaded product package integrates Spire.Doc for JavaScript, Spire.XLS for JavaScript, Spire.PDF for JavaScript, and Spire.Presentation for JavaScript. To use the features of Spire.Doc for JavaScript, customize the folder in the root directory, this tutorial defined the 'wasm' folder, and copy the corresponding files (spire.doc.js, Spire.Doc.Wasm.zip, spire.common.js, Spire.Common.Wasm.zip, and the _framework folder) to the “wasm” folder. Add the 'index.js' file to the root directory of the project and set the following content to create a simple Word file Here is the entire JavaScript code: Using “npm start” run the program, you will find the generated Word file in the designated file path. If you'd like to remove the evaluation message from the generated documents, or to get rid of the function limitations, please request a 30-day trial license for yourself.
{
"name": "nodejstest",
"version": "1.0.0",
"description": "Simple test project to generate HelloWorld.docx using spire.doc.js",
"main": "index.js",
"type": "module",
"scripts": {
"start": "node --experimental-modules --experimental-wasm-modules --experimental-vm-modules index.js"
},
"dependencies": {
"adm-zip": "^0.5.16"
}
}
Integrate Spire.Doc for JavaScript in Your Project
//NodeJSTest----create "HelloWorld.docx"
import fs from 'fs/promises';
import path from 'path';
import { fileURLToPath } from 'url';
import AdmZip from 'adm-zip';
const __filename = fileURLToPath(import.meta.url);
const __dirname = path.dirname(__filename);
async function extractWasmFiles() {
const wasmDir = path.join(__dirname, 'wasm');
const frameworkDir = path.join(wasmDir, '_framework');
await fs.mkdir(frameworkDir, { recursive: true });
for (const zipName of ['Spire.Common.Wasm.zip', 'Spire.Doc.Wasm.zip']) {
const zipPath = path.join(wasmDir, zipName);
try {
await fs.access(zipPath);
new AdmZip(zipPath).extractAllTo(wasmDir, true);
} catch {}
}
}
async function main() {
try {
await extractWasmFiles();
const { spiredoc } = await import('./wasm/spire.doc.js');
const spire = globalThis.spire;
if (!spire) throw new Error('WASM module not loaded correctly');
const outputDir = path.join(__dirname, 'output');
await fs.mkdir(outputDir, { recursive: true });
const fontsPath = path.join(__dirname, 'fonts');
try {
await fs.access(fontsPath);
spire.copyLocalPathToVFS(fontsPath, '/Library/Fonts/');
} catch {}
const document = new spiredoc.Document();
document.AddSection().AddParagraph().AppendText('Hello World');
const outputFileName = 'HelloWorld2.docx';
document.SaveToFile({ fileName: outputFileName, fileFormat: spiredoc.FileFormat.Docx2013 });
const outputFile = path.join(outputDir, outputFileName);
spire.copyFileFromFSToLocalStorage(outputFileName, outputFile);
document.Dispose();
console.log(`Document saved to ${outputFile}`);
} catch (error) {
console.error(error);
process.exit(1);
}
}
main();
Apply for a Temporary License
A radar chart, also known as a spider chart, is a graphical method of displaying multivariate data in two dimensions. Each spoke on the chart represents a different variable, and data points are plotted along these spokes. Radar charts are particularly useful for comparing the performance of different entities across several criteria. This article will demonstrate how to create a radar chart in Excel in Python using Spire.XLS for Python.
Install Spire.XLS for Python
This scenario requires Spire.XLS for Python and plum-dispatch v1.7.4. They can be easily installed in your Windows through the following pip command.
pip install Spire.XLS
If you are unsure how to install, please refer to this tutorial: How to Install Spire.XLS for Python on Windows
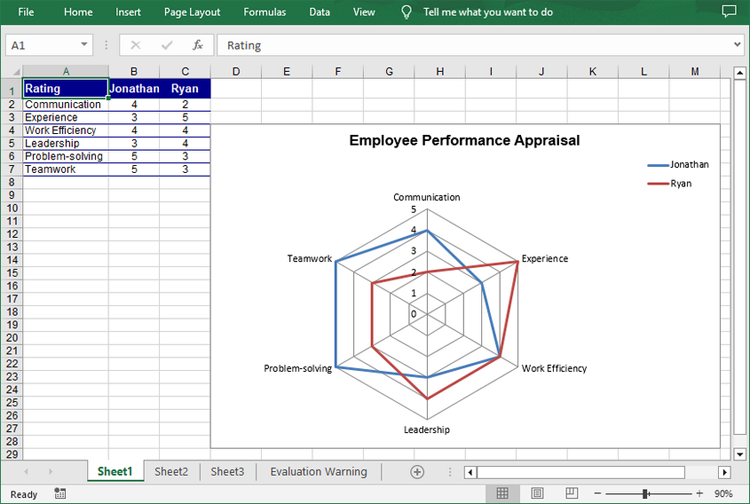
Create a Simple Radar Chart in Excel in Python
Spire.XLS for Python provides the Worksheet.Charts.Add(ExcelChartType.Radar) method to add a standard radar chart to an Excel worksheet. The following are the detailed steps:
- Create a Workbook instance.
- Get a specified worksheet using Workbook.Worksheets[] property.
- Add the chart data to specified cells and set the cell styles.
- Add a simple radar chart to the worksheet using Worksheet.Charts.Add(ExcelChartType.Radar) method.
- Set data range for the chart using Chart.DataRange property.
- Set the position, legend and title of the chart.
- Save the result file using Workbook.SaveToFile() method.
- Python
*from spire.xls import *
from spire.xls.common import *

# Create a Workbook instance
workbook = Workbook()

# Get the first worksheet
sheet = workbook.Worksheets[0]

# Add chart data to specified cells
sheet.Range["A1"].Value = "Rating"
sheet.Range["A2"].Value = "Communication"
sheet.Range["A3"].Value = "Experience"
sheet.Range["A4"].Value = "Work Efficiency"
sheet.Range["A5"].Value = "Leadership"
sheet.Range["A6"].Value = "Problem-solving"
sheet.Range["A7"].Value = "Teamwork"

sheet.Range["B1"].Value = "Jonathan"
sheet.Range["B2"].NumberValue = 4
sheet.Range["B3"].NumberValue = 3
sheet.Range["B4"].NumberValue = 4
sheet.Range["B5"].NumberValue = 3
sheet.Range["B6"].NumberValue = 5
sheet.Range["B7"].NumberValue = 5

sheet.Range["C1"].Value = "Ryan"
sheet.Range["C2"].NumberValue = 2
sheet.Range["C3"].NumberValue = 5
sheet.Range["C4"].NumberValue = 4
sheet.Range["C5"].NumberValue = 4
sheet.Range["C6"].NumberValue = 3
sheet.Range["C7"].NumberValue = 3

# Set font styles
sheet.Range["A1:C1"].Style.Font.IsBold = True
sheet.Range["A1:C1"].Style.Font.Size = 11
sheet.Range["A1:C1"].Style.Font.Color = Color.get_White()

# Set row height and column width
sheet.Rows[0].RowHeight = 20
sheet.Range["A1:C7"].Columns[0].ColumnWidth = 15

# Set cell styles
sheet.Range["A1:C1"].Style.Color = Color.get_DarkBlue()
sheet.Range["A2:C7"].Borders[BordersLineType.EdgeBottom].LineStyle = LineStyleType.Thin
sheet.Range["A2:C7"].Style.Borders[BordersLineType.EdgeBottom].Color = Color.get_DarkBlue()
sheet.Range["B1:C7"].HorizontalAlignment = HorizontalAlignType.Center
sheet.Range["A1:C7"].VerticalAlignment = VerticalAlignType.Center

# Add a radar chart to the worksheet
chart = sheet.Charts.Add(ExcelChartType.Radar)

# Set position of chart
chart.LeftColumn = 4
chart.TopRow = 4
chart.RightColumn = 14
chart.BottomRow = 29

# Set data range for the chart
chart.DataRange = sheet.Range["A1:C7"]
chart.SeriesDataFromRange = False

# Set and format chart title
chart.ChartTitle = "Employee Performance Appraisal"
chart.ChartTitleArea.IsBold = True
chart.ChartTitleArea.Size = 14
chart.PlotArea.Fill.Visible = False
chart.Legend.Position = LegendPositionType.Corner

# Save the result file
workbook.SaveToFile("CreateRadarChart.xlsx", ExcelVersion.Version2016)
workbook.Dispose()
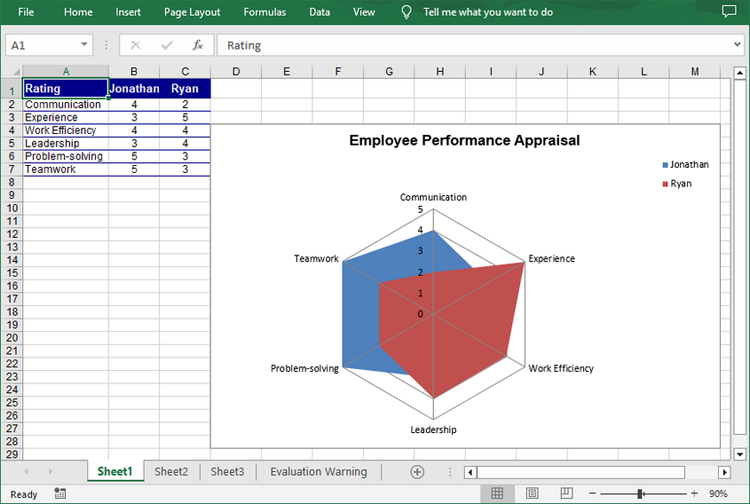
Create a Filled Radar Chart in Excel in Python
A filled radar chart is a variation of a standard radar chart, with the difference that the area between each data point is filled with color. The following are the steps to create a filled radar chart using Python:
- Create a Workbook instance.
- Get a specified worksheet using Workbook.Worksheets[] property.
- Add the chart data to specified cells and set the cell styles.
- Add a filled radar chart to the worksheet using Worksheet.Charts.Add(ExcelChartType.RadarFilled) method.
- Set data range for the chart using Chart.DataRange property.
- Set the position, legend and title of the chart.
- Save the result file using Workbook.SaveToFile() method.
- Python
from spire.xls import *
from spire.xls.common import *

# Create a Workbook instance
workbook = Workbook()

# Get the first worksheet
sheet = workbook.Worksheets[0]

# Add chart data to specified cells
sheet.Range["A1"].Value = "Rating"
sheet.Range["A2"].Value = "Communication"
sheet.Range["A3"].Value = "Experience"
sheet.Range["A4"].Value = "Work Efficiency"
sheet.Range["A5"].Value = "Leadership"
sheet.Range["A6"].Value = "Problem-solving"
sheet.Range["A7"].Value = "Teamwork"

sheet.Range["B1"].Value = "Jonathan"
sheet.Range["B2"].NumberValue = 4
sheet.Range["B3"].NumberValue = 3
sheet.Range["B4"].NumberValue = 4
sheet.Range["B5"].NumberValue = 3
sheet.Range["B6"].NumberValue = 5
sheet.Range["B7"].NumberValue = 5

sheet.Range["C1"].Value = "Ryan"
sheet.Range["C2"].NumberValue = 2
sheet.Range["C3"].NumberValue = 5
sheet.Range["C4"].NumberValue = 4
sheet.Range["C5"].NumberValue = 4
sheet.Range["C6"].NumberValue = 3
sheet.Range["C7"].NumberValue = 3

# Set font styles
sheet.Range["A1:C1"].Style.Font.IsBold = True
sheet.Range["A1:C1"].Style.Font.Size = 11
sheet.Range["A1:C1"].Style.Font.Color = Color.get_White()

# Set row height and column width
sheet.Rows[0].RowHeight = 20
sheet.Range["A1:C7"].Columns[0].ColumnWidth = 15

# Set cell styles
sheet.Range["A1:C1"].Style.Color = Color.get_DarkBlue()
sheet.Range["A2:C7"].Borders[BordersLineType.EdgeBottom].LineStyle = LineStyleType.Thin
sheet.Range["A2:C7"].Style.Borders[BordersLineType.EdgeBottom].Color = Color.get_DarkBlue()
sheet.Range["B1:C7"].HorizontalAlignment = HorizontalAlignType.Center
sheet.Range["A1:C7"].VerticalAlignment = VerticalAlignType.Center

# Add a filled radar chart to the worksheet
chart = sheet.Charts.Add(ExcelChartType.RadarFilled)

# Set position of chart
chart.LeftColumn = 4
chart.TopRow = 4
chart.RightColumn = 14
chart.BottomRow = 29

# Set data range for the chart
chart.DataRange = sheet.Range["A1:C7"]
chart.SeriesDataFromRange = False

# Set and format chart title
chart.ChartTitle = "Employee Performance Appraisal"
chart.ChartTitleArea.IsBold = True
chart.ChartTitleArea.Size = 14
chart.PlotArea.Fill.Visible = False
chart.Legend.Position = LegendPositionType.Corner

# Save the result file
workbook.SaveToFile("FilledRadarChart.xlsx", ExcelVersion.Version2016)
workbook.Dispose()
Apply for a Temporary License
If you'd like to remove the evaluation message from the generated documents, or to get rid of the function limitations, please request a 30-day trial license for yourself.
Setting up the page layout in Excel is an important step to make your worksheets look polished and professional. Whether you’re printing a report or sharing it digitally, customizing options like margins, orientation, paper size, and scaling helps ensure your data is presented clearly and effectively. In this article, you will learn how to programmatically set page setup options in Excel in Java using Spire.XLS for Java.
- Set Page Margins in Excel in Java
- Set Page Orientation in Excel in Java
- Set Paper Size in Excel in Java
- Set Print Area in Excel in Java
- Set Scaling Factor in Excel in Java
- Set FitToPages Options in Excel in Java
- Set Headers and Footers in Excel in Java
Install Spire.XLS for Java
First of all, you're required to add the Spire.Xls.jar file as a dependency in your Java program. The JAR file can be downloaded from this link. If you use Maven, you can easily import the JAR file in your application by adding the following code to your project's pom.xml file.
<repositories>
    <repository>
        <id>com.e-iceblue</id>
        <name>e-iceblue</name>
        <url>https://repo.e-iceblue.com/nexus/content/groups/public/</url>
    </repository>
</repositories>
<dependencies>
    <dependency>
        <groupId>e-iceblue</groupId>
        <artifactId>spire.xls</artifactId>
        <version>16.6.5</version>
    </dependency>
</dependencies>
Set Page Margins in Excel in Java
The PageSetup class in Spire.XLS for Java allows you to customize page setup options for Excel worksheets. It provides methods like setTopMargin(), setBottomMargin(), setLeftMargin(), setRightMargin(), setHeaderMarginInch(), and setFooterMarginInch(), enabling you to adjust the top, bottom, left, right, header, and footer margins of a worksheet. The detailed steps are as follows.
- Create an object of the Workbook class.
- Load an Excel file using the Workbook.loadFromFile() method.
- Get a specific worksheet using the Workbook.getWorksheets().get(index) method.
- Access the PageSetup object of the worksheet using the Worksheet.getPageSetup() method.
- Set the top, bottom, left, right, header, and footer margins using the PageSetup.setTopMargin(), PageSetup.setBottomMargin(), PageSetup.setLeftMargin(), PageSetup.setRightMargin(), PageSetup.setHeaderMarginInch(), and PageSetup.setFooterMarginInch() methods.
- Save the modified workbook to a new file using the Workbook.saveToFile() method.
- Java
import com.spire.xls.ExcelVersion;
import com.spire.xls.PageSetup;
import com.spire.xls.Workbook;
import com.spire.xls.Worksheet;

public class PageMargins {
    public static void main(String[] args) {
        // Create a Workbook object
        Workbook workbook = new Workbook();
        // Load an Excel file
        workbook.loadFromFile("Sample.xlsx");

        // Get the first worksheet
        Worksheet sheet = workbook.getWorksheets().get(0);

        // Get the PageSetup object of the worksheet
        PageSetup pageSetup = sheet.getPageSetup();

        // Set top, bottom, left, and right margins for the worksheet
        // The measure of the unit is Inch (1 inch = 2.54 cm)
        pageSetup.setTopMargin(1);
        pageSetup.setBottomMargin(1);
        pageSetup.setLeftMargin(1);
        pageSetup.setRightMargin(1);
        pageSetup.setHeaderMarginInch(1);
        pageSetup.setFooterMarginInch(1);

        // Save the modified workbook to a new file
        workbook.saveToFile("SetPageMargins.xlsx", ExcelVersion.Version2016);
        workbook.dispose();
    }
}

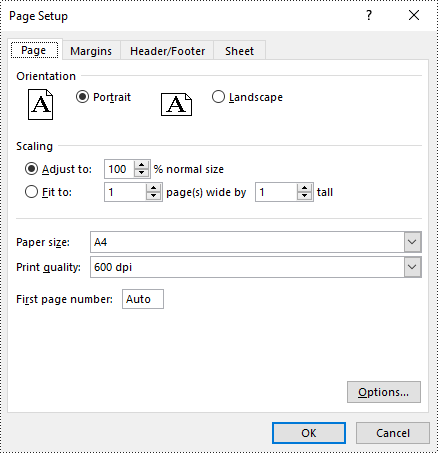
Set Page Orientation in Excel in Java
The PageSetup.setOrientation() method allows you to specify the page orientation for printing. You can choose between two options: portrait mode or landscape mode. The detailed steps are as follows.
- Create an object of the Workbook class.
- Load an Excel file using the Workbook.loadFromFile() method.
- Get a specific worksheet using the Workbook.getWorksheets().get(index) method.
- Access the PageSetup object of the worksheet using the Worksheet.getPageSetup() method.
- Set the page orientation using the PageSetup.setOrientation() method.
- Save the modified workbook to a new file using the Workbook.saveToFile() method.
- Java
import com.spire.xls.*;

public class PageOrientation {
    public static void main(String[] args) {
        // Create a Workbook object
        Workbook workbook = new Workbook();
        // Load an Excel file
        workbook.loadFromFile("Sample.xlsx");

        // Get the first worksheet
        Worksheet sheet = workbook.getWorksheets().get(0);

        // Get the PageSetup object of the worksheet
        PageSetup pageSetup = sheet.getPageSetup();

        pageSetup.setOrientation(PageOrientationType.Landscape);

        // Save the modified workbook to a new file
        workbook.saveToFile("SetPageOrientation.xlsx", ExcelVersion.Version2016);
        workbook.dispose();
    }
}

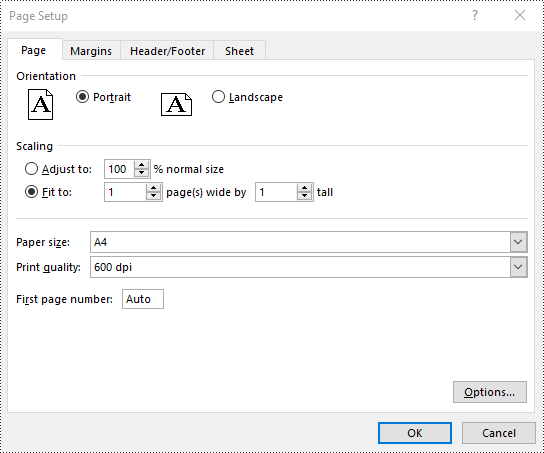
Set Paper Size in Excel in Java
The PageSetup.setPaperSize() method enables you to select from a variety of paper sizes for printing your worksheet. These options include A3, A4, A5, B4, B5, letter, legal, tabloid, and more. The detailed steps are as follows.
- Create an object of the Workbook class.
- Load an Excel file using the Workbook.loadFromFile() method.
- Get a specific worksheet using the Workbook.getWorksheets().get(index) method.
- Access the PageSetup object of the worksheet using the Worksheet.getPageSetup() method.
- Set the paper size using the PageSetup.setPaperSize() method.
- Save the modified workbook to a new file using the Workbook.saveToFile() method.
- Java
import com.spire.xls.*;

public class PaperSize {
    public static void main(String[] args) {
        // Create a Workbook object
        Workbook workbook = new Workbook();
        // Load an Excel file
        workbook.loadFromFile("Sample.xlsx");

        // Get the first worksheet
        Worksheet sheet = workbook.getWorksheets().get(0);

        // Get the PageSetup object of the worksheet
        PageSetup pageSetup = sheet.getPageSetup();

        // Set the paper size to A4
        pageSetup.setPaperSize(PaperSizeType.PaperA4);

        // Save the modified workbook to a new file
        workbook.saveToFile("SetPaperSize.xlsx", ExcelVersion.Version2016);
        workbook.dispose();
    }
}
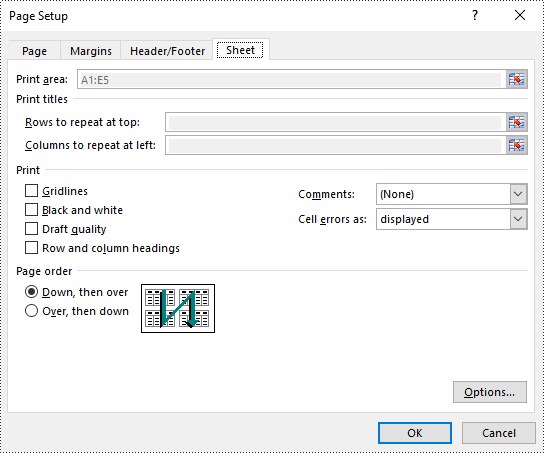
Set Print Area in Excel in Java
You can define the specific area to be printed by using the PageSetup.setPrintArea() method. The detailed steps are as follows.
- Create an object of the Workbook class.
- Load an Excel file using the Workbook.loadFromFile() method.
- Get a specific worksheet using the Workbook.getWorksheets().get(index) method.
- Access the PageSetup object of the worksheet using the Worksheet.getPageSetup() method.
- Set the print area using the PageSetup.setPringArea() method.
- Save the modified workbook to a new file using the Workbook.saveToFile() method.
- Java
import com.spire.xls.ExcelVersion;
import com.spire.xls.PageSetup;
import com.spire.xls.Workbook;
import com.spire.xls.Worksheet;

public class PrintArea {
    public static void main(String[] args) {
        // Create a Workbook object
        Workbook workbook = new Workbook();
        // Load an Excel file
        workbook.loadFromFile("Sample.xlsx");

        // Get the first worksheet
        Worksheet sheet = workbook.getWorksheets().get(0);

        // Get the PageSetup object of the worksheet
        PageSetup pageSetup = sheet.getPageSetup();

        // Set the print area of the worksheet to "A1:E5"
        pageSetup.setPrintArea("A1:E5");

        // Save the modified workbook to a new file
        workbook.saveToFile("SetPrintArea.xlsx", ExcelVersion.Version2016);
        workbook.dispose();
    }
}
Set Scaling Factor in Excel in Java
To scale the content of your worksheet to a specific percentage of its original size, you can use the PageSetup.setZoom() method. The detailed steps are as follows.
- Create an object of the Workbook class.
- Load an Excel file using the Workbook.loadFromFile() method.
- Get a specific worksheet using the Workbook.getWorksheets().get(index) method.
- Access the PageSetup object of the worksheet using the Worksheet.getPageSetup() method.
- Set the scaling factor using the PageSetup.setZoom() method.
- Save the modified workbook to a new file using the Workbook.saveToFile() method.
- Java
import com.spire.xls.ExcelVersion;
import com.spire.xls.PageSetup;
import com.spire.xls.Workbook;
import com.spire.xls.Worksheet;

public class ScalingFactor {
    public static void main(String[] args) {
        // Create a Workbook object
        Workbook workbook = new Workbook();
        // Load an Excel file
        workbook.loadFromFile("Sample.xlsx");

        // Get the first worksheet
        Worksheet sheet = workbook.getWorksheets().get(0);

        // Get the PageSetup object of the worksheet
        PageSetup pageSetup = sheet.getPageSetup();

        // Set the scaling factor of the worksheet to 90%
        pageSetup.setZoom(90);

        // Save the modified workbook to a new file
        workbook.saveToFile("SetScalingFactor.xlsx", ExcelVersion.Version2016);
        workbook.dispose();
    }
}

Set FitToPages Options in Excel in Java
Spire.XLS also provides the ability to adjust your worksheet content to fit a specific number of pages by using the PageSetup.setFitToPagesTall() and PageSetup.setFitToPagesWide() methods. The detailed steps are as follows.
- Create an object of the Workbook class.
- Load an Excel file using the Workbook.loadFromFile() method.
- Get a specific worksheet using the Workbook.getWorksheets().get(index) method.
- Access the PageSetup object of the worksheet using the Worksheet.getPageSetup() method.
- Fit the content of the worksheet to one page using the PageSetup.setFitToPagesTall() and PageSetup.setFitToPagesWide() methods.
- Save the modified workbook to a new file using the Workbook.saveToFile() method.
- Java
import com.spire.xls.ExcelVersion;
import com.spire.xls.PageSetup;
import com.spire.xls.Workbook;
import com.spire.xls.Worksheet;

public class FitToPages {
    public static void main(String[] args) {
        // Create a Workbook object
        Workbook workbook = new Workbook();
        // Load an Excel file
        workbook.loadFromFile("Sample.xlsx");

        // Get the first worksheet
        Worksheet sheet = workbook.getWorksheets().get(0);

        // Get the PageSetup object of the worksheet
        PageSetup pageSetup = sheet.getPageSetup();

        // Fit the content of the worksheet within one page vertically (i.e., all rows will fit on a single page)
        pageSetup.setFitToPagesTall(1);
        // Fit the content of the worksheet within one page horizontally (i.e., all columns will fit on a single page)
        pageSetup.setFitToPagesWide(1);

        // Save the modified workbook to a new file
        workbook.saveToFile("FitToPages.xlsx", ExcelVersion.Version2016);
        workbook.dispose();
    }
}
Set Headers and Footers in Excel in Java
For instructions on setting headers and footers in Excel, please refer to this article: Java: Add Headers and Footers to Excel.
Apply for a Temporary License
If you'd like to remove the evaluation message from the generated documents, or to get rid of the function limitations, please request a 30-day trial license for yourself.
