
Knowledgebase (2407)
Children categories
Data labels are an essential element of Excel charts for displaying detailed information about data points, such as values, series names, and category names. Spire.XLS for JavaScript runs entirely in the browser via WebAssembly, using a virtual file system (VFS) to manage input and output files — no backend server required. It provides a complete API for controlling data label display content, font formatting, number format, position, background, borders, and other appearance properties.
This article covers two core features:
For installation and project setup, refer to Integrating Spire.XLS for JavaScript in a React Project. The examples below assume Spire.XLS is installed and the WebAssembly module is initialized.
Set Data Label Content and Font
Data labels can display various types of information, including values, series names, category names, and legend keys. With Spire.XLS for JavaScript, you can flexibly control the display content of data labels and customize their font styles to make the chart information clearer and more readable. The steps are as follows:
- Create a
Workbookobject and get the default worksheet. - Populate the worksheet with category labels and numeric data for the chart.
- Add a chart using
sheet.Charts.Add()and set the chart type. - Configure the chart's data range, position, and title.
- Enable data label display content (values, series names, category names) via the
DataLabelsproperty. - Set data label font properties (font name, size, color, bold, etc.).
- Save the workbook to an Excel file using
SaveToFile().
Below is a complete code example demonstrating how to set chart data label content and font in React:
function App() {
  const setDataLabelContentAndFont = async () => {
    // Get the Spire.XLS WASM module
    const xlsModule = window.wasmModule?.spirexls;

    // Check if the module is ready
    if (!xlsModule) {
      alert('Spire.Xls is not ready yet');
      return;
    }

    // Create a new workbook and get the default worksheet
    const workbook = new xlsModule.Workbook();
    let sheet = workbook.Worksheets.get(0);
    sheet.Name = "DataLabelDemo";

    // Populate chart data
    sheet.Range.get("A1").Value = "Month";
    sheet.Range.get("A2").Value = "Jan";
    sheet.Range.get("A3").Value = "Feb";
    sheet.Range.get("A4").Value = "Mar";
    sheet.Range.get("A5").Value = "Apr";
    sheet.Range.get("A6").Value = "May";
    sheet.Range.get("A7").Value = "Jun";

    sheet.Range.get("B1").Value = "Sales";
    sheet.Range.get("B2").NumberValue = 25;
    sheet.Range.get("B3").NumberValue = 18;
    sheet.Range.get("B4").NumberValue = 8;
    sheet.Range.get("B5").NumberValue = 13;
    sheet.Range.get("B6").NumberValue = 22;
    sheet.Range.get("B7").NumberValue = 28;

    // Add a line chart and set its data range
    let chart = sheet.Charts.Add({ chartType: xlsModule.ExcelChartType.LineMarkers });
    chart.DataRange = sheet.Range.get("B1:B7");
    chart.SeriesDataFromRange = false;

    // Set the chart position
    chart.TopRow = 5;
    chart.BottomRow = 26;
    chart.LeftColumn = 2;
    chart.RightColumn = 11;

    // Configure chart title
    chart.ChartTitle = "Data Labels Demo";
    chart.ChartTitleArea.IsBold = true;
    chart.ChartTitleArea.Size = 12;

    // Bind category labels
    let cs1 = chart.Series.get(0);
    cs1.CategoryLabels = sheet.Range.get("A2:A7");

    // Set data label display content: show values, series names, and category names
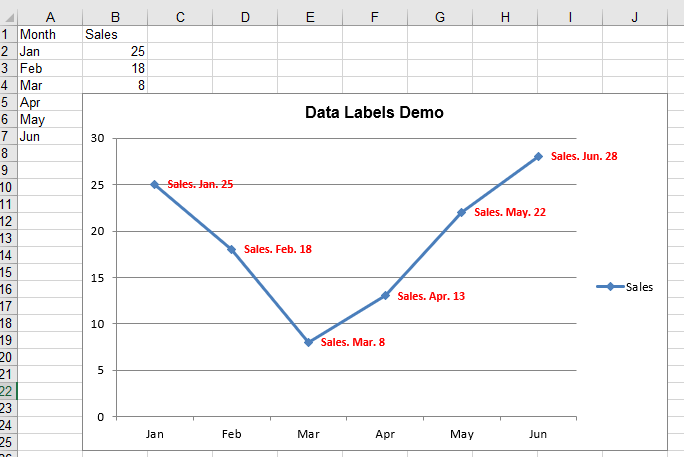
    cs1.DataPoints.DefaultDataPoint.DataLabels.HasValue = true;
    cs1.DataPoints.DefaultDataPoint.DataLabels.HasSeriesName = true;
    cs1.DataPoints.DefaultDataPoint.DataLabels.HasCategoryName = true;

    // Set data label delimiter
    cs1.DataPoints.DefaultDataPoint.DataLabels.Delimiter = ". ";

    // Customize data label font styles
    cs1.DataPoints.DefaultDataPoint.DataLabels.Size = 9;
    cs1.DataPoints.DefaultDataPoint.DataLabels.Color = xlsModule.Color.get_Red();
    cs1.DataPoints.DefaultDataPoint.DataLabels.FontName = "Calibri";
    cs1.DataPoints.DefaultDataPoint.DataLabels.IsBold = true;

    // Save the workbook
    const outputFileName = 'DataLabelContentAndFont.xlsx';
    workbook.SaveToFile(outputFileName);
    workbook.Dispose();

    // Read the file from VFS and trigger download
    const fileArray = window.dotnetRuntime.Module.FS.readFile(outputFileName);
    const blob = new Blob([fileArray], { type: 'application/vnd.openxmlformats-officedocument.spreadsheetml.sheet' });
    const url = URL.createObjectURL(blob);
    const a = document.createElement('a');
    a.href = url;
    a.download = outputFileName;
    a.click();
    URL.revokeObjectURL(url);
  };

  return (
    <div style={{ textAlign: 'center', height: '300px' }}>
      <h1>Set Data Label Content and Font</h1>
      <button onClick={setDataLabelContentAndFont}>
        Generate
      </button>
    </div>
  );
}

export default App;
Data label content and font set with Spire.XLS for JavaScript
Adjust Data Label Position and Appearance
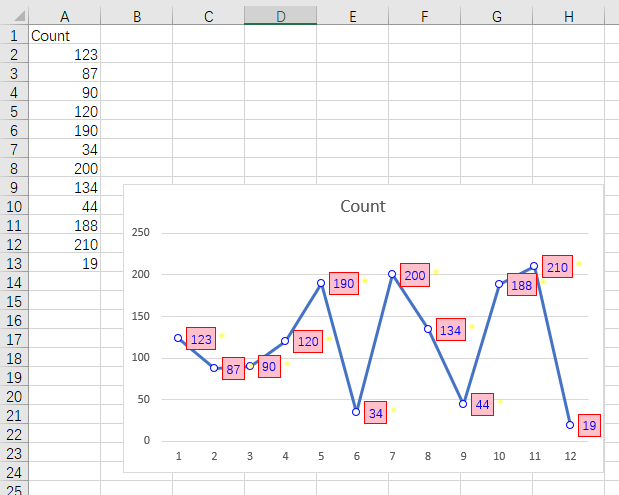
Beyond display content and font styles, the position and appearance of data labels are also important aspects of chart visual enhancement. Spire.XLS for JavaScript supports adjusting the display position of data labels through the DataLabelPositionType enumeration, and allows you to set fill colors, border styles, and shadow effects for data labels. The steps are as follows:
- Create a
Workbookobject and load an existing Excel file containing a chart. - Get the worksheet via
workbook.Worksheets.get(). - Get the chart object using
sheet.Charts.get(). - Iterate through the chart's data series and set the data label position using
DataLabels.Position. - Set a background fill color for the data labels via
FrameFormat.Fill. - Set border color and style for the data labels via
FrameFormat.Border. - Add shadow effects to data labels via
FrameFormat.Shadow(type, color, transparency, size, blur, angle, and distance). - Save the workbook to an Excel file using
SaveToFile().
Below is a complete code example demonstrating how to adjust chart data label position and appearance in React:
function App() {
  const setDataLabelPositionAndAppearance = async () => {
    // Get the Spire.XLS WASM module
    const xlsModule = window.wasmModule?.spirexls;

    // Check if the module is ready
    if (!xlsModule) {
      alert('Spire.Xls is not ready yet');
      return;
    }

    // Load the sample file into the virtual file system (VFS)
    let excelFileName = 'SampleChart.xlsx';
    await window.spire.FetchFileToVFS(excelFileName, '', `${process.env.PUBLIC_URL}data/`);

    // Create a workbook object and load the existing file
    const workbook = new xlsModule.Workbook();
    workbook.LoadFromFile({ fileName: excelFileName });

    // Get the first worksheet
    let sheet = workbook.Worksheets.get(0);

    // Get the first chart
    let chart = sheet.Charts.get(0);

    // Iterate through all data series and adjust data label position and appearance
    for (let i = 0; i < chart.Series.Count; i++) {
      let cs = chart.Series.get(i);
      // Set data point marker style and size to make data points more prominent
      cs.DataFormat.MarkerSize = 6;
      cs.DataFormat.MarkerStyle = xlsModule.ChartMarkerType.Circle;
      cs.DataFormat.MarkerForegroundColor = xlsModule.Color.get_Blue();
      cs.DataFormat.MarkerBackgroundColor = xlsModule.Color.get_White();

      let dataLabels = cs.DataPoints.DefaultDataPoint.DataLabels;

      // Enable value labels
      dataLabels.HasValue = true;

      // Set data label position
      dataLabels.Position = xlsModule.DataLabelPositionType.Right;

      // Set data label font color and size
      dataLabels.Color = xlsModule.Color.get_Blue();
      dataLabels.Size = 10;

      // Set pink fill background
      dataLabels.FrameFormat.Fill.FillType = xlsModule.ShapeFillType.SolidColor;
      dataLabels.FrameFormat.ForeGroundColor = xlsModule.Color.get_Pink();

      // Set red border
      dataLabels.FrameFormat.Border.Pattern = xlsModule.ChartLinePatternType.Solid;
      dataLabels.FrameFormat.Border.Color = xlsModule.Color.get_Red();

      // Set yellow shadow effect
      dataLabels.FrameFormat.Shadow.ShadowOuterType = xlsModule.XLSXChartShadowOuterType.OffsetDiagonalBottomLeft;
      dataLabels.FrameFormat.Shadow.Color = xlsModule.Color.get_Yellow();
      dataLabels.FrameFormat.Shadow.Transparency = 0;
      dataLabels.FrameFormat.Shadow.Size = 10;
      dataLabels.FrameFormat.Shadow.Blur = 2;
      dataLabels.FrameFormat.Shadow.Angle = 45;
      dataLabels.FrameFormat.Shadow.Distance = 8;
    }

    // Save the workbook
    const outputFileName = 'DataLabelPositionAndAppearance.xlsx';
    workbook.SaveToFile(outputFileName);
    workbook.Dispose();

    // Read the file from VFS and trigger download
    const fileArray = window.dotnetRuntime.Module.FS.readFile(outputFileName);
    const blob = new Blob([fileArray], { type: 'application/vnd.openxmlformats-officedocument.spreadsheetml.sheet' });
    const url = URL.createObjectURL(blob);
    const a = document.createElement('a');
    a.href = url;
    a.download = outputFileName;
    a.click();
    URL.revokeObjectURL(url);
  };

  return (
    <div style={{ textAlign: 'center', height: '300px' }}>
      <h1>Set Data Label Position and Appearance</h1>
      <button onClick={setDataLabelPositionAndAppearance}>
        Generate
      </button>
    </div>
  );
}

export default App;
Data label position and appearance adjusted with Spire.XLS for JavaScript
FAQ
How to modify the label content of a specific data point instead of the entire series?
Cause: DefaultDataPoint.DataLabels applies to all data points in a series and cannot control individual data points separately.
Solution: Use DataPoints.get(index) to access a specific data point and set its label:
// Modify the label text of the third data point
chart.Series.get(0).DataPoints.get(2).DataLabels.Text = "Peak";
chart.Series.get(0).DataPoints.get(2).DataLabels.HasValue = false;
How to set number format for data labels (decimal places, currency symbols)
Cause: The number format of data labels matches the cell format by default, but sometimes needs to be controlled independently.
Solution: Use the DataLabels.NumberFormat property to customize the number format:
// Show two decimal places
dataLabels.NumberFormat = "0.00";
// Display as percentage
dataLabels.NumberFormat = "0.0%";
// Display with currency symbol
dataLabels.NumberFormat = "$#,##0";
Get a Free License
Spire.XLS for JavaScript offers a 30-day full-featured free trial license with no functional limitations. Apply here to evaluate before purchasing.
Convert Excel to TXT or TXT to Excel with JavaScript in React
2026-08-03 02:29:40 Written by jie zouIn daily office work, data often needs to be exchanged between Excel spreadsheets and plain text (TXT) files. Spire.XLS for JavaScript runs entirely in the browser via WebAssembly, using a virtual file system (VFS) to manage input and output files — no backend server is required. It provides flexible APIs for controlling conversion parameters such as delimiters and encoding formats.
With Spire.XLS for JavaScript, you can export Excel worksheet data as structured text files, or import delimited text files to create fully formatted Excel workbooks. This makes data migration between different applications more convenient and efficient.
This article covers two core features:
For installation and project setup, refer to Integrating Spire.XLS for JavaScript in a React Project. The examples below assume Spire.XLS is installed and the WebAssembly module is initialized.
Convert Excel Worksheet Data to TXT
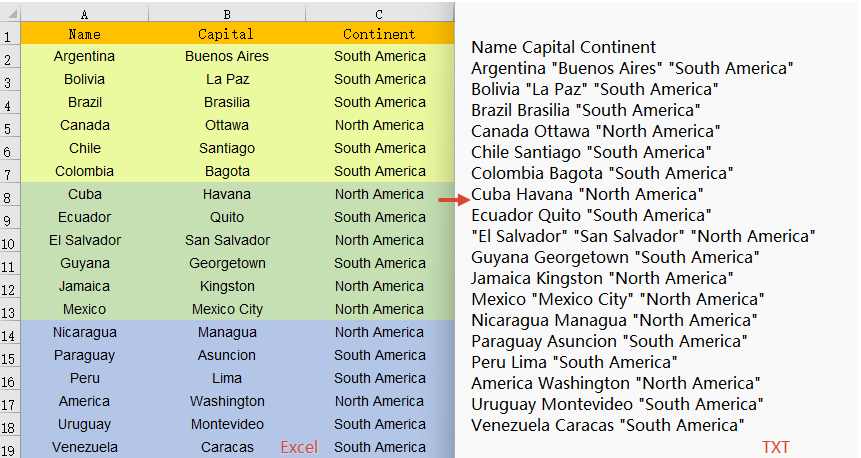
Exporting Excel data as a plain text file makes it convenient for further processing or analysis in other applications. With Spire.XLS for JavaScript, you can save the contents of a specified worksheet as a TXT file, with flexible control over the field separator and character encoding. The steps are as follows:
- Create a
Workbookobject and load an existing Excel file. - Retrieve a specific worksheet via
workbook.Worksheets.get(index). - Call the worksheet's
SaveToFile()method, specifying the output filename, separator, and encoding. - Dispose of the workbook resources, read the result file from VFS, and trigger the download.
Below is a complete code example demonstrating how to convert Excel to TXT in React:
function App() {
  const convertToText = async () => {
    // Get the Spire.XLS WASM module
    const xlsModule = window.wasmModule?.spirexls;

    // Check if the module is ready
    if (!xlsModule) {
      alert('Spire.Xls is not ready yet');
      return;
    }

    // Load the sample file into VFS
    await window.spire.FetchFileToVFS('Sample.xlsx', '', `${process.env.PUBLIC_URL}data/`);

    // Create a workbook object and load the Excel file
    const workbook = new xlsModule.Workbook();
    workbook.LoadFromFile({ fileName: 'Sample.xlsx' });

    // Get the first worksheet
    let sheet = workbook.Worksheets.get(0);

    // Save the worksheet as a TXT file with space separator and UTF-8 encoding
    const outputFileName = 'ExcelToTxt.txt';
    sheet.SaveToFile({
      fileName: outputFileName,
      separator: " ",
      encoding: xlsModule.Encoding.get_UTF8()
    });
    workbook.Dispose();

    // Read the file from VFS and trigger download
    const fileArray = window.dotnetRuntime.Module.FS.readFile(outputFileName);
    const blob = new Blob([fileArray], { type: 'text/plain' });
    const url = URL.createObjectURL(blob);
    const a = document.createElement('a');
    a.href = url;
    a.download = outputFileName;
    a.click();
    URL.revokeObjectURL(url);
  };

  return (
    <div style={{ textAlign: 'center', height: '300px' }}>
      <h1>Convert Excel to TXT</h1>
      <button onClick={convertToText}>
        Generate
      </button>
    </div>
  );
}

export default App;
Excel converted to TXT with Spire.XLS for JavaScript
Convert TXT File to Excel Workbook
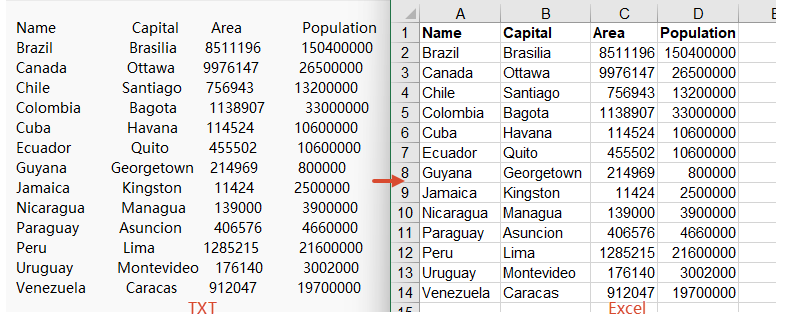
Importing a delimited text file into an Excel spreadsheet allows you to take full advantage of Excel's formatting, calculation, and charting capabilities. Spire.XLS for JavaScript supports TXT-to-Excel conversion by reading the text file content and writing data to the workbook cell by cell. Formatting such as bold headers can also be applied during the process. The steps are as follows:
- Load the font file and TXT sample file into the VFS.
- Read the TXT file content from VFS, split it by lines, and parse the cell data for each line.
- Create a
Workbookobject, iterate through the data array, and write data to worksheet cells row by row and column by column. - Apply bold styling to the header row and call
AllocatedRange.AutoFitColumns()to auto-fit column widths. - Save the workbook as an Excel file and trigger the download.
Below is a complete code example demonstrating how to convert TXT to Excel in React:
function App() {
  const convertToExcel = async () => {
    // Get the Spire.XLS WASM module
    const xlsModule = window.wasmModule?.spirexls;

    // Check if the module is ready
    if (!xlsModule) {
      alert('Spire.Xls is not ready yet');
      return;
    }

    // Load the font file to ensure proper text rendering
    await window.spire.FetchFileToVFS('ARIAL.TTF', '', `${process.env.PUBLIC_URL}font/`);

    // Load the TXT file into VFS
    await window.spire.FetchFileToVFS('Sample.txt', '', `${process.env.PUBLIC_URL}data/`);

    // Read the text file content from VFS
    const txtData = window.dotnetRuntime.Module.FS.readFile('Sample.txt');
    const text = typeof txtData === 'string' ? txtData : new TextDecoder('utf-8').decode(txtData);

    // Split by lines, compatible with \r\n and \n
    const lines = text.trim().split(/\r?\n/);

    // Parse each line of data (try tab delimiter first, then fallback to other delimiters)
    const data = [];
    for (const line of lines) {
      const trimmed = line.trim();
      if (!trimmed) continue;
      let cells = trimmed.split('\t');
      if (cells.length === 1) {
        cells = trimmed.split(/\s+/);
      }
      data.push(cells);
    }

    // Create a Workbook object
    const workbook = new xlsModule.Workbook();

    // Get the first worksheet
    const sheet = workbook.Worksheets.get(0);

    // Iterate through rows and columns in the data array and write to cells
    for (let row = 0; row < data.length; row++) {
      for (let col = 0; col < data[row].length; col++) {
        const cell = sheet.get_Item(row + 1, col + 1);
        cell.Value = data[row][col];
        // Bold the header row
        if (row === 0) {
          cell.Style.Font.IsBold = true;
        }
      }
    }

    // Auto-fit column widths
    sheet.AllocatedRange.AutoFitColumns();

    // Save the workbook and release resources
    const outputFileName = 'TxtToExcel.xlsx';
    workbook.SaveToFile({ fileName: outputFileName, version: xlsModule.ExcelVersion.Version2010 });
    workbook.Dispose();

    // Read the file from VFS and trigger download
    const fileArray = window.dotnetRuntime.Module.FS.readFile(outputFileName);
    const blob = new Blob([fileArray], { type: 'application/vnd.openxmlformats-officedocument.spreadsheetml.sheet' });
    const url = URL.createObjectURL(blob);
    const a = document.createElement('a');
    a.href = url;
    a.download = outputFileName;
    a.click();
    URL.revokeObjectURL(url);
  };

  return (
    <div style={{ textAlign: 'center', height: '300px' }}>
      <h1>Convert TXT to Excel</h1>
      <button onClick={convertToExcel}>
        Generate
      </button>
    </div>
  );
}

export default App;
TXT converted to Excel with Spire.XLS for JavaScript
FAQ
How to handle encoding issues during conversion?
Cause: The TXT file in this example uses UTF-8 encoding. If the TXT file uses a different encoding format (such as GBK, GB2312, etc.), decoding it directly with TextDecoder('utf-8') will result in garbled text.
Solution: Specify the corresponding encoding type in the TextDecoder constructor parameter based on the actual encoding of the TXT file:
// UTF-8 encoding
const text = new TextDecoder('utf-8').decode(txtData);

// GBK encoding
const text = new TextDecoder('gbk').decode(txtData);

// GB2312 encoding
const text = new TextDecoder('gb2312').decode(txtData);

// UTF-16 encoding
const text = new TextDecoder('utf-16').decode(txtData);
How to handle TXT files with different delimiters?
Cause: TXT files may use different delimiters such as tabs (\t), spaces, commas (,), semicolons (;), etc. Choosing the wrong delimiter can lead to data parsing errors.
Solution: In JavaScript, you can specify different delimiters by modifying the parameter of the split() method:
// Tab delimiter
let cells = trimmed.split('\t');

// Comma delimiter
let cells = trimmed.split(',');

// Semicolon delimiter
let cells = trimmed.split(';');

// Regular expression: split by one or more whitespace characters (spaces, tabs, etc.)
let cells = trimmed.split(/\s+/);
Get a Free License
Spire.XLS for JavaScript offers a 30-day full-featured free trial license with no functional limitations. Apply here to evaluate before purchasing.
Hide or Unhide Excel Rows and Columns with JavaScript in React
2026-08-03 02:25:05 Written by jie zouHiding and unhiding rows and columns is a common feature in daily office work. It helps protect sensitive information, simplify data views, or temporarily conceal unnecessary data. Spire.XLS for JavaScript runs entirely in the browser via WebAssembly, using a virtual file system (VFS) to manage input and output files — no backend server required. It provides a simple API for controlling the visibility of rows and columns.
This article covers four core features:
- Hide Specific Rows and Columns in Excel
- Unhide Specific Rows and Columns in Excel
- Hide Multiple Rows and Columns at Once in Excel
- Unhide All Hidden Rows and Columns in Excel
For installation and project setup, refer to Integrating Spire.XLS for JavaScript in a React Project. The examples below assume Spire.XLS is installed and the WebAssembly module is initialized.
Hide Specific Rows and Columns in Excel
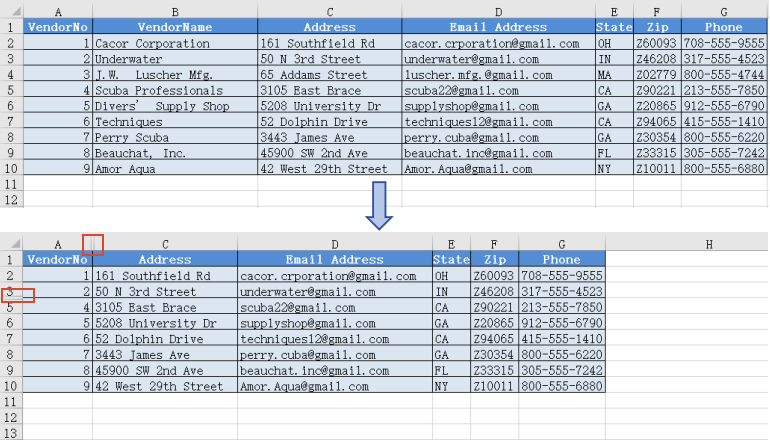
Hiding specific rows and columns can keep your worksheet cleaner and more readable without compromising data integrity. Spire.XLS for JavaScript supports hiding a specific row or column using the HideRow() and HideColumn() methods. The steps are as follows:
- Create a
Workbookobject and load an existing Excel file containing data. - Use
worksheet.HideRow()to hide a specific row. - Use
worksheet.HideColumn()to hide a specific column. - Save the workbook to an Excel file using
SaveToFile().
Below is a complete code example demonstrating how to hide specific rows and columns in Excel in React:
function App() {
  const hideSpecificRowsAndColumns = async () => {
    // Get the Spire.XLS WASM module
    const xlsModule = window.wasmModule?.spirexls;

    // Check if the module is ready
    if (!xlsModule) {
      alert('Spire.Xls is not ready yet');
      return;
    }

    // Load the sample file into the virtual file system (VFS)
    let excelFileName = 'Sample.xlsx';
    await window.spire.FetchFileToVFS(excelFileName, '', `${process.env.PUBLIC_URL}data/`);

    // Create a workbook object and load the existing file
    const workbook = new xlsModule.Workbook();
    workbook.LoadFromFile({ fileName: excelFileName });
    let sheet = workbook.Worksheets.get(0);

    // Hide a specific row (row 4)
    sheet.HideRow(4);

    // Hide a specific column (column 2, i.e., column B)
    sheet.HideColumn(2);

    // Save the workbook
    const outputFileName = 'HideSpecificRowsColumns.xlsx';
    workbook.SaveToFile(outputFileName);
    workbook.Dispose();

    // Read the file from VFS and trigger download
    const fileArray = window.dotnetRuntime.Module.FS.readFile(outputFileName);
    const blob = new Blob([fileArray], { type: 'application/vnd.openxmlformats-officedocument.spreadsheetml.sheet' });
    const url = URL.createObjectURL(blob);
    const a = document.createElement('a');
    a.href = url;
    a.download = outputFileName;
    a.click();
    URL.revokeObjectURL(url);
  };

  return (
    <div style={{ textAlign: 'center', height: '300px' }}>
      <h1>Hide Specific Rows and Columns</h1>
      <button onClick={hideSpecificRowsAndColumns}>
        Generate
      </button>
    </div>
  );
}

export default App;
Specific rows and columns hidden with Spire.XLS for JavaScript
Unhide Specific Rows and Columns in Excel
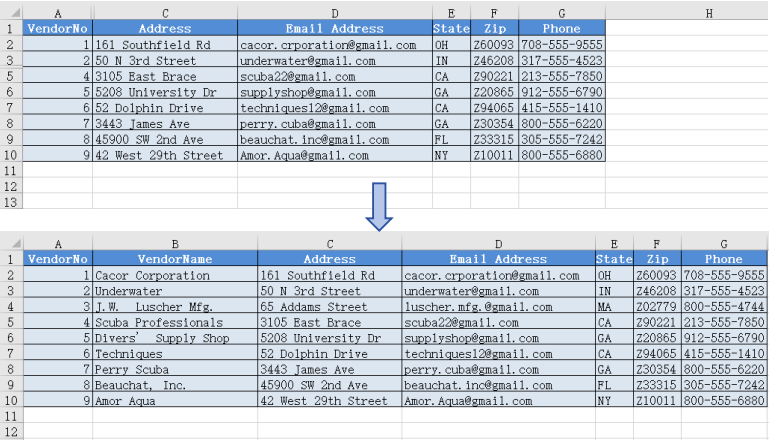
When you need to view or edit specific hidden data, you can unhide a particular row or column individually. Spire.XLS for JavaScript supports unhiding a specific row or column using the ShowRow() and ShowColumn() methods. The steps are as follows:
- Create a
Workbookobject and load an existing Excel file containing hidden rows/columns. - Use
sheet.ShowRow()to unhide a specific row. - Use
sheet.ShowColumn()to unhide a specific column. - Save the workbook to an Excel file using
SaveToFile().
Below is a complete code example demonstrating how to unhide specific rows and columns in Excel in React:
function App() {
  const unhideSpecificRowsAndColumns = async () => {
    // Get the Spire.XLS WASM module
    const xlsModule = window.wasmModule?.spirexls;

    // Check if the module is ready
    if (!xlsModule) {
      alert('Spire.Xls is not ready yet');
      return;
    }

    // Load the sample file into the virtual file system (VFS)
    let excelFileName = 'HideSpecificRowsColumns.xlsx';
    await window.spire.FetchFileToVFS(excelFileName, '', `${process.env.PUBLIC_URL}data/`);

    // Create a workbook object and load the existing file
    const workbook = new xlsModule.Workbook();
    workbook.LoadFromFile({ fileName: excelFileName });

    // Get the first worksheet
    let sheet = workbook.Worksheets.get(0);

    // Unhide a specific row (row 4)
    sheet.ShowRow(4);

    // Unhide a specific column (column 2, i.e., column B)
    sheet.ShowColumn(2);

    // Save the workbook
    const outputFileName = 'UnhideSpecificRowsColumns.xlsx';
    workbook.SaveToFile(outputFileName);
    workbook.Dispose();

    // Read the file from VFS and trigger download
    const fileArray = window.dotnetRuntime.Module.FS.readFile(outputFileName);
    const blob = new Blob([fileArray], { type: 'application/vnd.openxmlformats-officedocument.spreadsheetml.sheet' });
    const url = URL.createObjectURL(blob);
    const a = document.createElement('a');
    a.href = url;
    a.download = outputFileName;
    a.click();
    URL.revokeObjectURL(url);
  };

  return (
    <div style={{ textAlign: 'center', height: '300px' }}>
      <h1>Unhide Specific Rows and Columns</h1>
      <button onClick={unhideSpecificRowsAndColumns}>
        Generate
      </button>
    </div>
  );
}

export default App;
Specific rows and columns unhidden with Spire.XLS for JavaScript
Hide Multiple Rows and Columns at Once in Excel
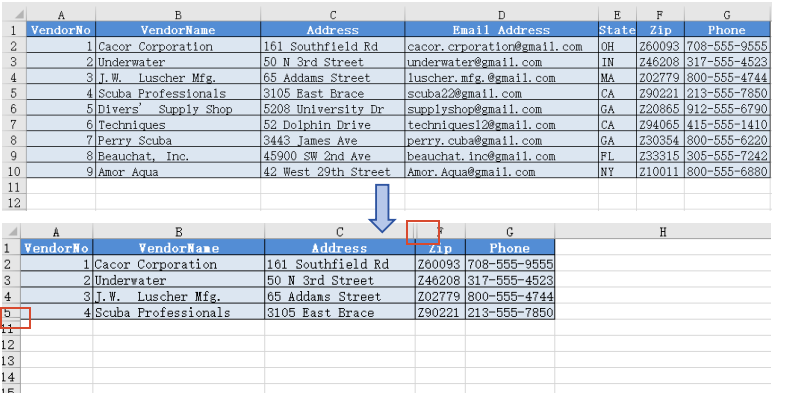
When there are multiple rows or columns that you don't need to display, hiding them one by one is inefficient. Spire.XLS for JavaScript supports hiding multiple rows and columns at once through loops, greatly improving operational efficiency. The steps are as follows:
- Create a
Workbookobject and load an existing Excel file containing data. - Use a loop to call
worksheet.HideRow()to hide multiple rows at once. - Use a loop to call
worksheet.HideColumn()to hide multiple columns at once. - Save the workbook to an Excel file using
SaveToFile().
Below is a complete code example demonstrating how to hide multiple rows and columns at once in Excel in React:
function App() {
  const hideMultipleRowsAndColumns = async () => {
    // Get the Spire.XLS WASM module
    const xlsModule = window.wasmModule?.spirexls;

    // Check if the module is ready
    if (!xlsModule) {
      alert('Spire.Xls is not ready yet');
      return;
    }

    // Load the sample file into the virtual file system (VFS)
    let excelFileName = 'Sample.xlsx';
    await window.spire.FetchFileToVFS(excelFileName, '', `${process.env.PUBLIC_URL}data/`);

    // Create a workbook object and load the existing file
    const workbook = new xlsModule.Workbook();
    workbook.LoadFromFile({ fileName: excelFileName });
    let sheet = workbook.Worksheets.get(0);

    // Hide multiple rows at once (rows 6 through 10)
    for (let i = 6; i <= 10; i++) {
      sheet.HideRow(i);
    }

    // Hide multiple columns at once (columns 4 through 5, i.e., columns D to E)
    for (let j = 4; j <= 5; j++) {
      sheet.HideColumn(j);
    }

    // Save the workbook
    const outputFileName = 'HideMultipleRowsColumns.xlsx';
    workbook.SaveToFile(outputFileName);
    workbook.Dispose();

    // Read the file from VFS and trigger download
    const fileArray = window.dotnetRuntime.Module.FS.readFile(outputFileName);
    const blob = new Blob([fileArray], { type: 'application/vnd.openxmlformats-officedocument.spreadsheetml.sheet' });
    const url = URL.createObjectURL(blob);
    const a = document.createElement('a');
    a.href = url;
    a.download = outputFileName;
    a.click();
    URL.revokeObjectURL(url);
  };

  return (
    <div style={{ textAlign: 'center', height: '300px' }}>
      <h1>Hide Multiple Rows and Columns</h1>
      <button onClick={hideMultipleRowsAndColumns}>
        Generate
      </button>
    </div>
  );
}

export default App;
Multiple rows and columns hidden at once with Spire.XLS for JavaScript
Unhide All Hidden Rows and Columns in Excel
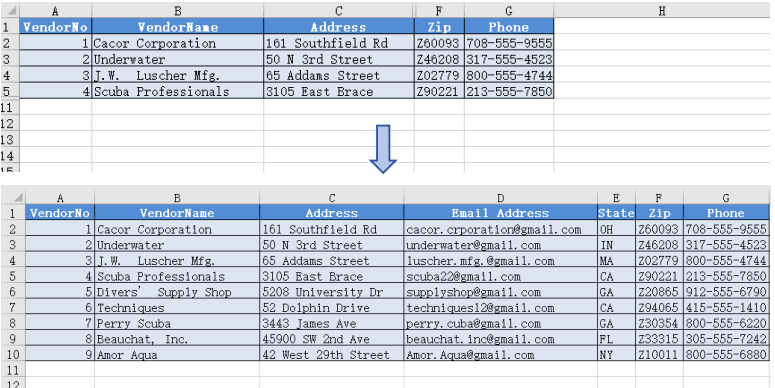
To unhide all hidden rows and columns, iterate through the rows and columns in the worksheet, use GetRowIsHide() and GetColumnIsHide() to find hidden ones, then call ShowRow() and ShowColumn() to unhide them. The steps are as follows:
- Create a
Workbookobject and load the Excel file. - Get the worksheet.
- Iterate through rows, use
GetRowIsHide()to find hidden rows, useShowRow()to unhide. - Iterate through columns, use
GetColumnIsHide()to find hidden columns, useShowColumn()to unhide. - Save the result file using
SaveToFile().
Below is a complete code example demonstrating how to unhide all hidden rows and columns in Excel in React:
function App() {
  const unhideAllRowsAndColumns = async () => {
    // Get the Spire.XLS WASM module
    const xlsModule = window.wasmModule?.spirexls;

    // Check if the module is ready
    if (!xlsModule) {
      alert('Spire.Xls is not ready yet');
      return;
    }

    // Load the sample file into the virtual file system (VFS)
    let excelFileName = 'HideMultipleRowsColumns.xlsx';
    await window.spire.FetchFileToVFS(excelFileName, '', `${process.env.PUBLIC_URL}data/`);

    // Create a workbook object and load the existing file
    const workbook = new xlsModule.Workbook();
    workbook.LoadFromFile({ fileName: excelFileName });

    // Get the first worksheet
    let sheet = workbook.Worksheets.get(0);

    for (let i = 1; i <= sheet.Rows.length; i++) {
      if (sheet.GetRowIsHide(i)) {
        // Unhide row
        sheet.ShowRow(i);
      }
    }

    for (let j = 1; j <= sheet.Columns.length; j++) {
      if (sheet.GetColumnIsHide(j)) {
        // Unhide column
        sheet.ShowColumn(j);
      }
    }

    // Save the workbook
    const outputFileName = 'UnhideAllRowsColumns.xlsx';
    workbook.SaveToFile(outputFileName);
    workbook.Dispose();

    // Read the file from VFS and trigger download
    const fileArray = window.dotnetRuntime.Module.FS.readFile(outputFileName);
    const blob = new Blob([fileArray], { type: 'application/vnd.openxmlformats-officedocument.spreadsheetml.sheet' });
    const url = URL.createObjectURL(blob);
    const a = document.createElement('a');
    a.href = url;
    a.download = outputFileName;
    a.click();
    URL.revokeObjectURL(url);
  };

  return (
    <div style={{ textAlign: 'center', height: '300px' }}>
      <h1>Unhide All Rows and Columns</h1>
      <button onClick={unhideAllRowsAndColumns}>
        Generate
      </button>
    </div>
  );
}

export default App;
All hidden rows and columns unhidden with Spire.XLS for JavaScript
FAQ
How to check whether a row or column is hidden?
Solution: Use the GetRowIsHide() and GetColumnIsHide() methods to check:
// Check if row 3 is hidden
let rowIsHidden = sheet.GetRowIsHide(3);

// Check if column 2 (column B) is hidden
let columnIsHidden = sheet.GetColumnIsHide(2);
Are row heights or column widths preserved after hiding?
Solution: When hiding rows or columns, the original row height and column width values are preserved. After unhiding with ShowRow() or ShowColumn(), the original dimensions are automatically restored without any additional configuration.
Get a Free License
Spire.XLS for JavaScript offers a 30-day full-featured free trial license with no functional limitations. Apply here to evaluate before purchasing.
