
Knowledgebase (2412)
Children categories
Hide or Unhide Excel Rows and Columns with JavaScript in React
2026-08-03 02:25:05 Written by jie zouHiding and unhiding rows and columns is a common feature in daily office work. It helps protect sensitive information, simplify data views, or temporarily conceal unnecessary data. Spire.XLS for JavaScript runs entirely in the browser via WebAssembly, using a virtual file system (VFS) to manage input and output files — no backend server required. It provides a simple API for controlling the visibility of rows and columns.
This article covers four core features:
- Hide Specific Rows and Columns in Excel
- Unhide Specific Rows and Columns in Excel
- Hide Multiple Rows and Columns at Once in Excel
- Unhide All Hidden Rows and Columns in Excel
For installation and project setup, refer to Integrating Spire.XLS for JavaScript in a React Project. The examples below assume Spire.XLS is installed and the WebAssembly module is initialized.
Hide Specific Rows and Columns in Excel
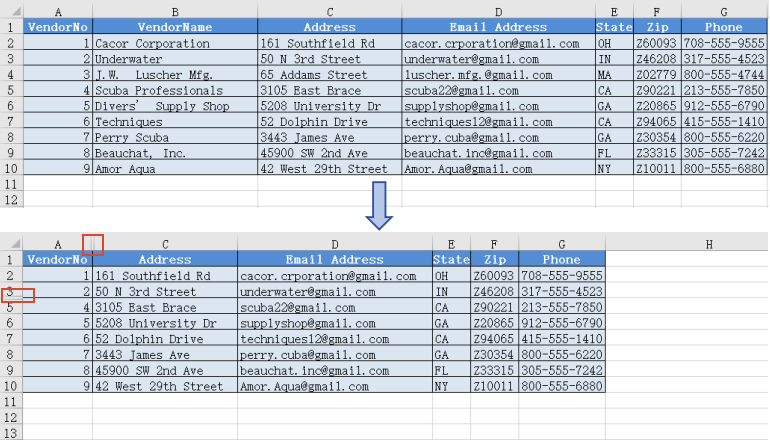
Hiding specific rows and columns can keep your worksheet cleaner and more readable without compromising data integrity. Spire.XLS for JavaScript supports hiding a specific row or column using the HideRow() and HideColumn() methods. The steps are as follows:
- Create a
Workbookobject and load an existing Excel file containing data. - Use
worksheet.HideRow()to hide a specific row. - Use
worksheet.HideColumn()to hide a specific column. - Save the workbook to an Excel file using
SaveToFile().
Below is a complete code example demonstrating how to hide specific rows and columns in Excel in React:
function App() {
  const hideSpecificRowsAndColumns = async () => {
    // Get the Spire.XLS WASM module
    const xlsModule = window.wasmModule?.spirexls;

    // Check if the module is ready
    if (!xlsModule) {
      alert('Spire.Xls is not ready yet');
      return;
    }

    // Load the sample file into the virtual file system (VFS)
    let excelFileName = 'Sample.xlsx';
    await window.spire.FetchFileToVFS(excelFileName, '', `${process.env.PUBLIC_URL}data/`);

    // Create a workbook object and load the existing file
    const workbook = new xlsModule.Workbook();
    workbook.LoadFromFile({ fileName: excelFileName });
    let sheet = workbook.Worksheets.get(0);

    // Hide a specific row (row 4)
    sheet.HideRow(4);

    // Hide a specific column (column 2, i.e., column B)
    sheet.HideColumn(2);

    // Save the workbook
    const outputFileName = 'HideSpecificRowsColumns.xlsx';
    workbook.SaveToFile(outputFileName);
    workbook.Dispose();

    // Read the file from VFS and trigger download
    const fileArray = window.dotnetRuntime.Module.FS.readFile(outputFileName);
    const blob = new Blob([fileArray], { type: 'application/vnd.openxmlformats-officedocument.spreadsheetml.sheet' });
    const url = URL.createObjectURL(blob);
    const a = document.createElement('a');
    a.href = url;
    a.download = outputFileName;
    a.click();
    URL.revokeObjectURL(url);
  };

  return (
    <div style={{ textAlign: 'center', height: '300px' }}>
      <h1>Hide Specific Rows and Columns</h1>
      <button onClick={hideSpecificRowsAndColumns}>
        Generate
      </button>
    </div>
  );
}

export default App;
Specific rows and columns hidden with Spire.XLS for JavaScript
Unhide Specific Rows and Columns in Excel
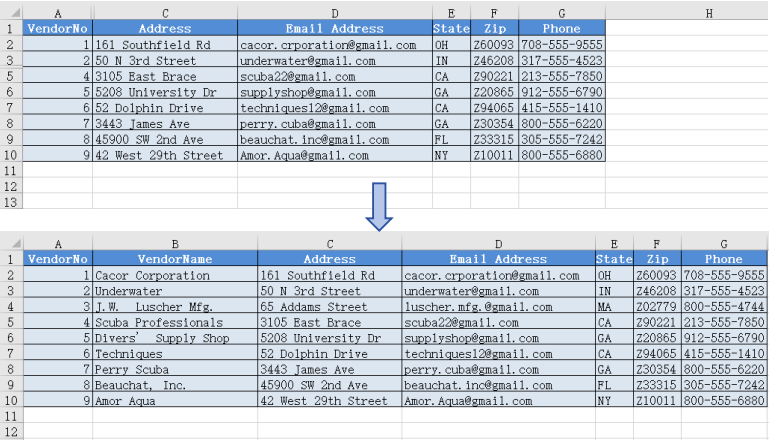
When you need to view or edit specific hidden data, you can unhide a particular row or column individually. Spire.XLS for JavaScript supports unhiding a specific row or column using the ShowRow() and ShowColumn() methods. The steps are as follows:
- Create a
Workbookobject and load an existing Excel file containing hidden rows/columns. - Use
sheet.ShowRow()to unhide a specific row. - Use
sheet.ShowColumn()to unhide a specific column. - Save the workbook to an Excel file using
SaveToFile().
Below is a complete code example demonstrating how to unhide specific rows and columns in Excel in React:
function App() {
  const unhideSpecificRowsAndColumns = async () => {
    // Get the Spire.XLS WASM module
    const xlsModule = window.wasmModule?.spirexls;

    // Check if the module is ready
    if (!xlsModule) {
      alert('Spire.Xls is not ready yet');
      return;
    }

    // Load the sample file into the virtual file system (VFS)
    let excelFileName = 'HideSpecificRowsColumns.xlsx';
    await window.spire.FetchFileToVFS(excelFileName, '', `${process.env.PUBLIC_URL}data/`);

    // Create a workbook object and load the existing file
    const workbook = new xlsModule.Workbook();
    workbook.LoadFromFile({ fileName: excelFileName });

    // Get the first worksheet
    let sheet = workbook.Worksheets.get(0);

    // Unhide a specific row (row 4)
    sheet.ShowRow(4);

    // Unhide a specific column (column 2, i.e., column B)
    sheet.ShowColumn(2);

    // Save the workbook
    const outputFileName = 'UnhideSpecificRowsColumns.xlsx';
    workbook.SaveToFile(outputFileName);
    workbook.Dispose();

    // Read the file from VFS and trigger download
    const fileArray = window.dotnetRuntime.Module.FS.readFile(outputFileName);
    const blob = new Blob([fileArray], { type: 'application/vnd.openxmlformats-officedocument.spreadsheetml.sheet' });
    const url = URL.createObjectURL(blob);
    const a = document.createElement('a');
    a.href = url;
    a.download = outputFileName;
    a.click();
    URL.revokeObjectURL(url);
  };

  return (
    <div style={{ textAlign: 'center', height: '300px' }}>
      <h1>Unhide Specific Rows and Columns</h1>
      <button onClick={unhideSpecificRowsAndColumns}>
        Generate
      </button>
    </div>
  );
}

export default App;
Specific rows and columns unhidden with Spire.XLS for JavaScript
Hide Multiple Rows and Columns at Once in Excel
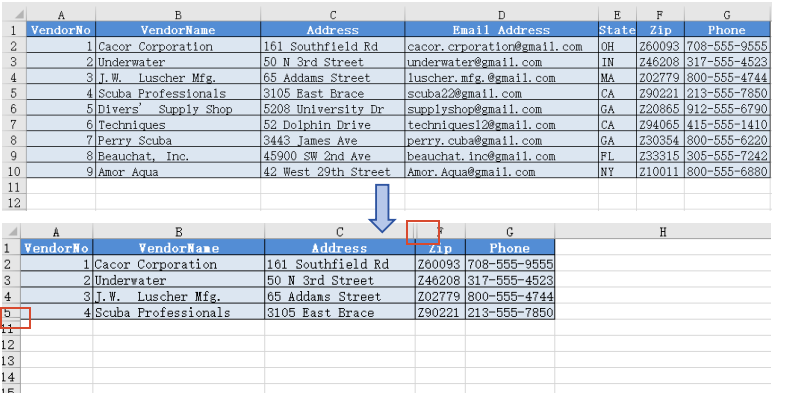
When there are multiple rows or columns that you don't need to display, hiding them one by one is inefficient. Spire.XLS for JavaScript supports hiding multiple rows and columns at once through loops, greatly improving operational efficiency. The steps are as follows:
- Create a
Workbookobject and load an existing Excel file containing data. - Use a loop to call
worksheet.HideRow()to hide multiple rows at once. - Use a loop to call
worksheet.HideColumn()to hide multiple columns at once. - Save the workbook to an Excel file using
SaveToFile().
Below is a complete code example demonstrating how to hide multiple rows and columns at once in Excel in React:
function App() {
  const hideMultipleRowsAndColumns = async () => {
    // Get the Spire.XLS WASM module
    const xlsModule = window.wasmModule?.spirexls;

    // Check if the module is ready
    if (!xlsModule) {
      alert('Spire.Xls is not ready yet');
      return;
    }

    // Load the sample file into the virtual file system (VFS)
    let excelFileName = 'Sample.xlsx';
    await window.spire.FetchFileToVFS(excelFileName, '', `${process.env.PUBLIC_URL}data/`);

    // Create a workbook object and load the existing file
    const workbook = new xlsModule.Workbook();
    workbook.LoadFromFile({ fileName: excelFileName });
    let sheet = workbook.Worksheets.get(0);

    // Hide multiple rows at once (rows 6 through 10)
    for (let i = 6; i <= 10; i++) {
      sheet.HideRow(i);
    }

    // Hide multiple columns at once (columns 4 through 5, i.e., columns D to E)
    for (let j = 4; j <= 5; j++) {
      sheet.HideColumn(j);
    }

    // Save the workbook
    const outputFileName = 'HideMultipleRowsColumns.xlsx';
    workbook.SaveToFile(outputFileName);
    workbook.Dispose();

    // Read the file from VFS and trigger download
    const fileArray = window.dotnetRuntime.Module.FS.readFile(outputFileName);
    const blob = new Blob([fileArray], { type: 'application/vnd.openxmlformats-officedocument.spreadsheetml.sheet' });
    const url = URL.createObjectURL(blob);
    const a = document.createElement('a');
    a.href = url;
    a.download = outputFileName;
    a.click();
    URL.revokeObjectURL(url);
  };

  return (
    <div style={{ textAlign: 'center', height: '300px' }}>
      <h1>Hide Multiple Rows and Columns</h1>
      <button onClick={hideMultipleRowsAndColumns}>
        Generate
      </button>
    </div>
  );
}

export default App;
Multiple rows and columns hidden at once with Spire.XLS for JavaScript
Unhide All Hidden Rows and Columns in Excel
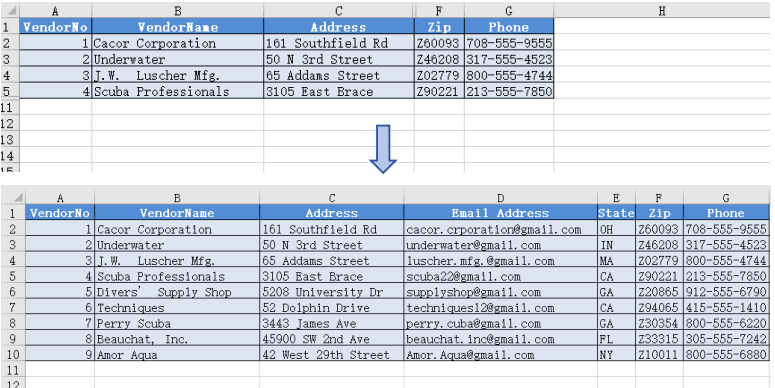
To unhide all hidden rows and columns, iterate through the rows and columns in the worksheet, use GetRowIsHide() and GetColumnIsHide() to find hidden ones, then call ShowRow() and ShowColumn() to unhide them. The steps are as follows:
- Create a
Workbookobject and load the Excel file. - Get the worksheet.
- Iterate through rows, use
GetRowIsHide()to find hidden rows, useShowRow()to unhide. - Iterate through columns, use
GetColumnIsHide()to find hidden columns, useShowColumn()to unhide. - Save the result file using
SaveToFile().
Below is a complete code example demonstrating how to unhide all hidden rows and columns in Excel in React:
function App() {
  const unhideAllRowsAndColumns = async () => {
    // Get the Spire.XLS WASM module
    const xlsModule = window.wasmModule?.spirexls;

    // Check if the module is ready
    if (!xlsModule) {
      alert('Spire.Xls is not ready yet');
      return;
    }

    // Load the sample file into the virtual file system (VFS)
    let excelFileName = 'HideMultipleRowsColumns.xlsx';
    await window.spire.FetchFileToVFS(excelFileName, '', `${process.env.PUBLIC_URL}data/`);

    // Create a workbook object and load the existing file
    const workbook = new xlsModule.Workbook();
    workbook.LoadFromFile({ fileName: excelFileName });

    // Get the first worksheet
    let sheet = workbook.Worksheets.get(0);

    for (let i = 1; i <= sheet.Rows.length; i++) {
      if (sheet.GetRowIsHide(i)) {
        // Unhide row
        sheet.ShowRow(i);
      }
    }

    for (let j = 1; j <= sheet.Columns.length; j++) {
      if (sheet.GetColumnIsHide(j)) {
        // Unhide column
        sheet.ShowColumn(j);
      }
    }

    // Save the workbook
    const outputFileName = 'UnhideAllRowsColumns.xlsx';
    workbook.SaveToFile(outputFileName);
    workbook.Dispose();

    // Read the file from VFS and trigger download
    const fileArray = window.dotnetRuntime.Module.FS.readFile(outputFileName);
    const blob = new Blob([fileArray], { type: 'application/vnd.openxmlformats-officedocument.spreadsheetml.sheet' });
    const url = URL.createObjectURL(blob);
    const a = document.createElement('a');
    a.href = url;
    a.download = outputFileName;
    a.click();
    URL.revokeObjectURL(url);
  };

  return (
    <div style={{ textAlign: 'center', height: '300px' }}>
      <h1>Unhide All Rows and Columns</h1>
      <button onClick={unhideAllRowsAndColumns}>
        Generate
      </button>
    </div>
  );
}

export default App;
All hidden rows and columns unhidden with Spire.XLS for JavaScript
FAQ
How to check whether a row or column is hidden?
Solution: Use the GetRowIsHide() and GetColumnIsHide() methods to check:
// Check if row 3 is hidden
let rowIsHidden = sheet.GetRowIsHide(3);

// Check if column 2 (column B) is hidden
let columnIsHidden = sheet.GetColumnIsHide(2);
Are row heights or column widths preserved after hiding?
Solution: When hiding rows or columns, the original row height and column width values are preserved. After unhiding with ShowRow() or ShowColumn(), the original dimensions are automatically restored without any additional configuration.
Get a Free License
Spire.XLS for JavaScript offers a 30-day full-featured free trial license with no functional limitations. Apply here to evaluate before purchasing.
Read or Delete Excel Document Properties with JavaScript in React
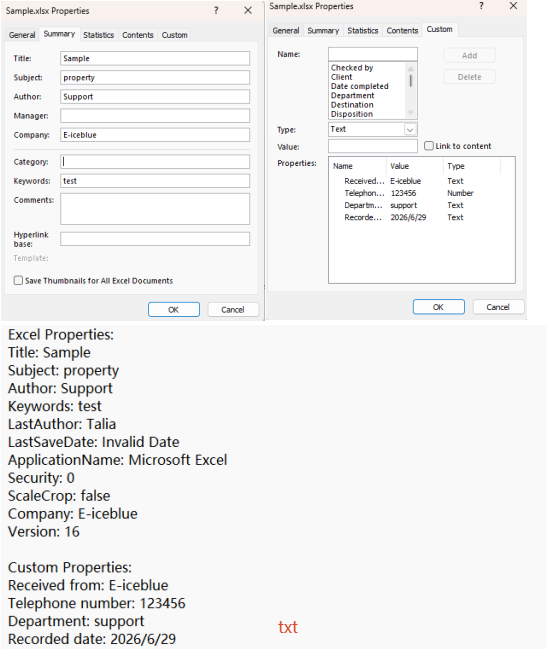
2026-08-03 02:20:33 Written by jie zouExcel document properties — such as title, author, category, and other metadata — are essential for file management and information retrieval. Spire.XLS for JavaScript runs entirely in the browser via WebAssembly, using a virtual file system (VFS) to manage input and output files. It provides a complete API for accessing and managing both DocumentProperties (standard/built-in properties) and CustomDocumentProperties (user-defined name-value pairs).
Spire.XLS categorizes document properties into two types: standard and custom. Standard document properties are predefined built-in metadata like title, subject, author, category, keywords, and comments. Custom document properties are user-defined name-value pairs that can contain text, numbers, dates, or boolean values.
This article covers two core features:
For installation and project setup, refer to Integrating Spire.XLS for JavaScript in a React Project. The examples below assume Spire.XLS is installed and the WebAssembly module is initialized.
Read Standard and Custom Document Properties
Reading document properties is the first step in understanding an Excel file's metadata. Through the DocumentProperties and CustomDocumentProperties collections, you can easily access all property information stored in the file. The steps are as follows:
- Create a
Workbookobject and load an existing Excel file. - Retrieve the standard document properties collection via
workbook.DocumentProperties. - Iterate through the
DocumentPropertiescollection to read each property's name and value. - Retrieve the custom document properties collection via
workbook.CustomDocumentProperties. - Iterate through the
CustomDocumentPropertiescollection to read each custom property's name and value. - Output the retrieved property information to a text file.
Below is a complete code example demonstrating how to read Excel document properties in React:
function App() {
  const readDocumentProperties = async () => {
    // Get the Spire.XLS WASM module
    const xlsModule = window.wasmModule?.spirexls;

    // Check if the module is ready
    if (!xlsModule) {
      alert('Spire.Xls is not ready yet');
      return;
    }

    // Load the sample file into VFS
    await window.spire.FetchFileToVFS('Sample.xlsx', '', `${process.env.PUBLIC_URL}data/`);

    const workbook = new xlsModule.Workbook();
    workbook.LoadFromFile({ fileName: 'Sample.xlsx' });

    // Get standard document properties
    let properties1 = workbook.DocumentProperties;
    let sb = [];
    sb.push("Excel Properties:");
    for (let i = 0; i < properties1.Count; i++) {
      let name = properties1.get(i).Name;
      let obj = properties1.get(i).Value;
      let t = properties1.get(i).PropertyType;
      let value = null;
      if (t === xlsModule.PropertyType.Double) {
        value = xlsModule.Double.Convert(obj).Value;
      } else if (t === xlsModule.PropertyType.DateTime) {
        // Convert OADate to JavaScript Date and format as date string
        let oaDate = xlsModule.DateTime.Convert(obj).Value;
        let jsDate = new Date((oaDate - 25569) * 86400 * 1000);
        value = jsDate.toLocaleDateString();
      } else if (t === xlsModule.PropertyType.Bool) {
        value = xlsModule.Boolean.Convert(obj).Value;
      } else if (
        t === xlsModule.PropertyType.Int ||
        t === xlsModule.PropertyType.Int32
      ) {
        value = xlsModule.Int32.Convert(obj).Value;
      } else {
        value = xlsModule.String.Convert(obj).Value;
      }
      sb.push(name + ": " + String(value));
    }
    sb.push("");

    // Get custom document properties
    let properties2 = workbook.CustomDocumentProperties;
    sb.push("Custom Properties:");
    for (let i = 0; i < properties2.Count; i++) {
      let name = properties2.get(i).Name;
      let t = properties2.get(i).PropertyType;
      let obj = properties2.get(i).Value;
      let value = null;
      if (t === xlsModule.PropertyType.Double) {
        value = xlsModule.Double.Convert(obj).Value;
      } else if (t === xlsModule.PropertyType.DateTime) {
        // Convert OADate to JavaScript Date and format as date string
        let oaDate = xlsModule.DateTime.Convert(obj).Value;
        let jsDate = new Date((oaDate - 25569) * 86400 * 1000);
        value = jsDate.toLocaleDateString();
      } else if (t === xlsModule.PropertyType.Bool) {
        value = xlsModule.Boolean.Convert(obj).Value;
      } else if (
        t === xlsModule.PropertyType.Int ||
        t === xlsModule.PropertyType.Int32
      ) {
        value = xlsModule.Int32.Convert(obj).Value;
      } else {
        value = xlsModule.String.Convert(obj).Value;
      }
      sb.push(name + ": " + String(value));
    }

    // Save the property information to a text file
    const outputFileName = 'DocumentProperties.txt';
    window.dotnetRuntime.Module.FS.writeFile(outputFileName, sb.join("\n"));
    workbook.Dispose();

    // Read the file from VFS and trigger download
    const fileArray = window.dotnetRuntime.Module.FS.readFile(outputFileName);
    const blob = new Blob([fileArray], { type: 'text/plain' });
    const url = URL.createObjectURL(blob);
    const a = document.createElement('a');
    a.href = url;
    a.download = outputFileName;
    a.click();
    URL.revokeObjectURL(url);
  };

  return (
    <div style={{ textAlign: 'center', height: '300px' }}>
      <h1>Read Excel Document Properties</h1>
      <button onClick={readDocumentProperties}>
        Generate
      </button>
    </div>
  );
}

export default App;
Document properties read with Spire.XLS for JavaScript
Delete Standard and Custom Document Properties
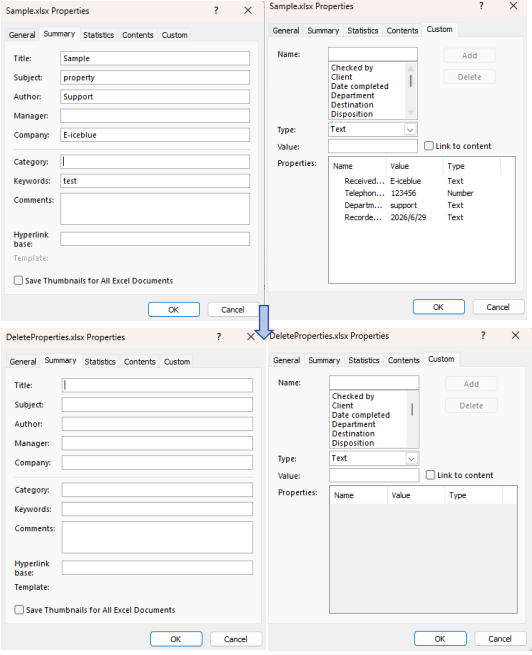
In some scenarios, you may need to clear sensitive or outdated metadata from Excel files. Spire.XLS for JavaScript allows you to delete both standard and custom document properties through straightforward API calls. The steps are as follows:
- Create a
Workbookobject and load an existing Excel file. - Retrieve the standard document properties collection via
workbook.DocumentProperties. - Clear standard properties by setting their values to empty strings.
- Retrieve the custom document properties collection via
workbook.CustomDocumentProperties. - Iterate through the collection and use the
Remove()method to delete each custom property. - Save the modified workbook to a new Excel file.
Below is a complete code example demonstrating how to delete Excel document properties in React:
function App() {
  const deleteDocumentProperties = async () => {
    // Get the Spire.XLS WASM module
    const xlsModule = window.wasmModule?.spirexls;

    // Check if the module is ready
    if (!xlsModule) {
      alert('Spire.Xls is not ready yet');
      return;
    }

    // Load the sample file into VFS
    await window.spire.FetchFileToVFS('Sample.xlsx', '', `${process.env.PUBLIC_URL}data/`);

    const workbook = new xlsModule.Workbook();
    workbook.LoadFromFile({ fileName: 'Sample.xlsx' });

    // Get the standard document properties collection and clear their values
    let standardProperties = workbook.DocumentProperties;
    standardProperties.Title = "";
    standardProperties.Subject = "";
    standardProperties.Manager = "";
    standardProperties.Category = "";
    standardProperties.Keywords = "";
    standardProperties.Comments = "";
    standardProperties.Author = "";
    standardProperties.Company = "";

    // Get the custom document properties collection, iterate and remove all properties
    let customProperties = workbook.CustomDocumentProperties;
    for (let i = customProperties.Count - 1; i >= 0; i--) {
      customProperties.Remove(customProperties.get(i).Name);
    }

    // Save the workbook
    const outputFileName = 'DeleteProperties.xlsx';
    workbook.SaveToFile(outputFileName);
    workbook.Dispose();

    // Read the file from VFS and trigger download
    const fileArray = window.dotnetRuntime.Module.FS.readFile(outputFileName);
    const blob = new Blob([fileArray], { type: 'application/vnd.openxmlformats-officedocument.spreadsheetml.sheet' });
    const url = URL.createObjectURL(blob);
    const a = document.createElement('a');
    a.href = url;
    a.download = outputFileName;
    a.click();
    URL.revokeObjectURL(url);
  };

  return (
    <div style={{ textAlign: 'center', height: '300px' }}>
      <h1>Delete Excel Document Properties</h1>
      <button onClick={deleteDocumentProperties}>
        Generate
      </button>
    </div>
  );
}

export default App;
Document properties deleted with Spire.XLS for JavaScript
FAQ
Why can't standard document properties be removed using Remove() like custom properties?
Cause: Standard document properties are part of the Excel file structure, each with a fixed definition position that cannot be removed from the collection.
Solution: Clear standard properties by setting their values to empty strings instead of removing the properties themselves:
standardProperties.Title = "";
standardProperties.Author = "";
Custom properties can be directly deleted using the Remove() method.
How to handle reading non-text property types such as dates, booleans, and numbers?
Cause: Using String.Convert() directly on date or boolean properties may produce results in an unexpected format.
Solution: Check the PropertyType to determine the type and use the appropriate conversion method:
if (t === xlsModule.PropertyType.DateTime) {
  let oaDate = xlsModule.DateTime.Convert(obj).Value;
  let jsDate = new Date((oaDate - 25569) * 86400 * 1000);
  value = jsDate.toLocaleDateString();
} else if (t === xlsModule.PropertyType.Bool) {
  value = xlsModule.Boolean.Convert(obj).Value;
}
Get a Free License
Spire.XLS for JavaScript offers a 30-day full-featured free trial license with no functional limitations. Apply here to evaluate before purchasing.
Copying data within Excel files while preserving formatting is a common requirement in web-based spreadsheet applications. Spire.XLS for JavaScript runs entirely in the browser via WebAssembly, using a virtual file system (VFS) to manage input and output files — no backend server required. It provides comprehensive APIs to copy rows, columns, and cell ranges while keeping the original styles, fonts, colors, and other formatting intact.
This article covers three core features:
For installation and project setup, refer to Integrating Spire.XLS for JavaScript in a React Project. The examples below assume Spire.XLS is installed and the WebAssembly module is initialized.
Copy Rows in Excel
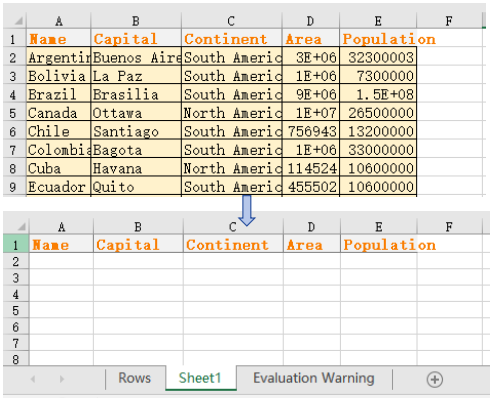
With Spire.XLS for JavaScript, you can copy rows within the same worksheet or across different worksheets while preserving all formatting, formulas, and styles. This is useful when you need to duplicate structured data such as headers, summary rows, or formatted templates. Through the CopyRangeOptions parameter, you can flexibly configure copy options such as copying all formats, conditional formatting, data validation, or only formula result values. The steps are as follows:
- Create a
Workbookobject and load an existing Excel file. - Get the source and destination worksheets via
workbook.Worksheets.get(). - Get the row to copy via
sheet.Rows[index]. - Use
sheet.Copy()with the source row, destination worksheet, destination row index, andCopyRangeOptions.Allto copy the row and its formatting. - Copy the column widths from the source row cells to the corresponding destination row cells.
- Save the workbook to an Excel file using
SaveToFile().
Below is a complete code example demonstrating how to copy rows in React:
function App() {
  const copyRows = async () => {
    // Get the Spire.XLS WASM module
    const xlsModule = window.wasmModule?.spirexls;

    // Check if the module is ready
    if (!xlsModule) {
      alert('Spire.Xls is not ready yet');
      return;
    }

    // Fetch the Excel file and add it to the Virtual File System (VFS)
    let excelFileName = 'Copying.xls';
    await window.spire.FetchFileToVFS(excelFileName, '', `${process.env.PUBLIC_URL}data/`);

    // Create a new workbook and load an existing file
    const workbook = new xlsModule.Workbook();
    workbook.LoadFromFile({ fileName: excelFileName });

    // Get the source and destination worksheets
    let sheet1 = workbook.Worksheets.get(0);
    let sheet2 = workbook.Worksheets.get(1);

    // Get the row to copy
    let row = sheet1.Rows[0];

    // Copy the row to the destination worksheet with all formatting
    sheet1.Copy({ sourceRange: row, destRange: sheet2.Rows[0], copyOptions: xlsModule.CopyRangeOptions.All });

    // Copy the column widths from source row to destination row
    let columns = sheet1.Columns.length;
    for (let i = 0; i < columns; i++) {
      let columnWidth = row.Columns[i].ColumnWidth;
      sheet2.Rows[0].Columns[i].ColumnWidth = columnWidth;
    }

    // Save the workbook
    const outputFileName = 'CopyRows_out.xlsx';
    workbook.SaveToFile({ fileName: outputFileName, version: xlsModule.ExcelVersion.Version2010 });
    workbook.Dispose();

    // Read the file from VFS and trigger download
    const fileArray = window.dotnetRuntime.Module.FS.readFile(outputFileName);
    const blob = new Blob([fileArray], { type: 'application/vnd.openxmlformats-officedocument.spreadsheetml.sheet' });
    const url = URL.createObjectURL(blob);
    const a = document.createElement('a');
    a.href = url;
    a.download = outputFileName;
    a.click();
    URL.revokeObjectURL(url);
  };

  return (
    <div style={{ textAlign: 'center', height: '300px' }}>
      <h1>Copy Excel Rows</h1>
      <button onClick={copyRows}>
        Generate
      </button>
    </div>
  );
}

export default App;
Row copy result
Copy Columns in Excel
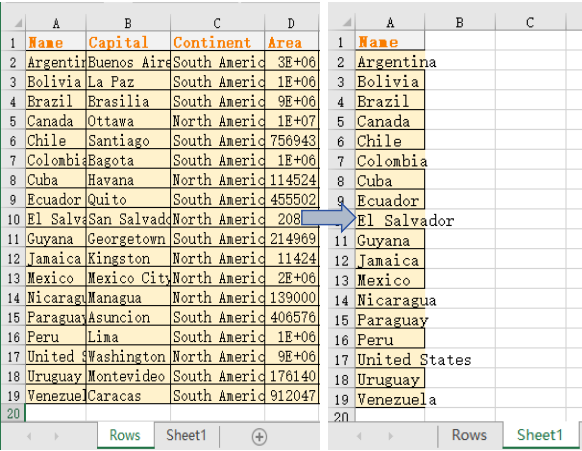
Copying columns is equally straightforward with Spire.XLS for JavaScript. You can duplicate a column within the same worksheet or copy it to another sheet, and all cell styles, number formats, and data will be preserved. Through the CopyRangeOptions parameter, you can flexibly configure which elements to copy. This is particularly helpful for reorganizing spreadsheet layouts or replicating data structures. The steps are as follows:
- Create a
Workbookobject and load an existing Excel file. - Get the source and destination worksheets.
- Get the column to copy via
sheet.Columns[index]. - Use
sheet.Copy()with the source column, destination worksheet, destination column index, andCopyRangeOptions.Allto copy the column and its formatting. - Copy the column widths and row heights from the source column cells to the corresponding destination column cells.
- Save the workbook to an Excel file using
SaveToFile().
Below is a complete code example demonstrating how to copy columns in React:
function App() {
  const copyColumns = async () => {
    // Get the Spire.XLS WASM module
    const xlsModule = window.wasmModule?.spirexls;

    // Check if the module is ready
    if (!xlsModule) {
      alert('Spire.Xls is not ready yet');
      return;
    }

    // Fetch the Excel file and add it to the Virtual File System (VFS)
    let excelFileName = 'Copying.xls';
    await window.spire.FetchFileToVFS(excelFileName, '', `${process.env.PUBLIC_URL}data/`);

    // Create a new workbook and load an existing file
    const workbook = new xlsModule.Workbook();
    workbook.LoadFromFile({ fileName: excelFileName });

    // Get the source and destination worksheets
    let sheet1 = workbook.Worksheets.get(0);
    let sheet2 = workbook.Worksheets.get(1);

    // Get the column to copy
    let column = sheet1.Columns[0];

    // Copy the column to the destination worksheet with all formatting
    sheet1.Copy({ sourceRange: column, destRange: sheet2.Columns[0], copyOptions: xlsModule.CopyRangeOptions.All });

    // Copy the column width and row heights from source column to destination column
    sheet2.Columns[0].ColumnWidth = column.ColumnWidth;
    let rows = column.Rows.length;
    for (let i = 0; i < rows; i++) {
      let rowHeight = column.Rows[i].RowHeight;
      sheet2.Columns[0].Rows[i].RowHeight = rowHeight;
    }

    // Save the workbook
    const outputFileName = 'CopyColumns_out.xlsx';
    workbook.SaveToFile({ fileName: outputFileName, version: xlsModule.ExcelVersion.Version2010 });
    workbook.Dispose();

    // Read the file from VFS and trigger download
    const fileArray = window.dotnetRuntime.Module.FS.readFile(outputFileName);
    const blob = new Blob([fileArray], { type: 'application/vnd.openxmlformats-officedocument.spreadsheetml.sheet' });
    const url = URL.createObjectURL(blob);
    const a = document.createElement('a');
    a.href = url;
    a.download = outputFileName;
    a.click();
    URL.revokeObjectURL(url);
  };

  return (
    <div style={{ textAlign: 'center', height: '300px' }}>
      <h1>Copy Excel Columns</h1>
      <button onClick={copyColumns}>
        Generate
      </button>
    </div>
  );
}

export default App;
Column copy result
Copy Cells in Excel
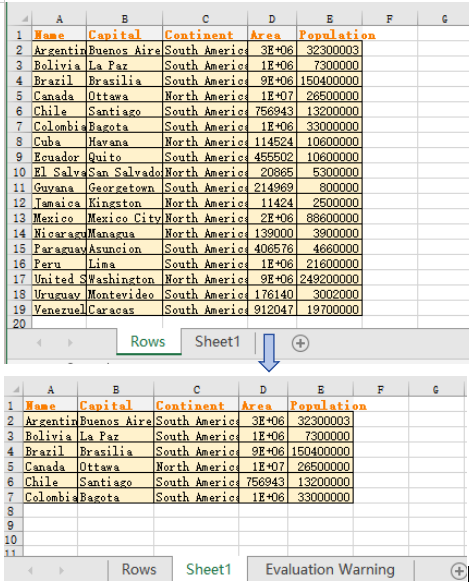
Beyond copying entire rows and columns, Spire.XLS for JavaScript also allows you to copy specific cell ranges from one location to another while preserving all formatting. The CellRange.Copy() method provides this capability with flexible options. This gives you fine-grained control over which cells to duplicate. You can copy a range of cells within the same worksheet or to a different worksheet. The steps are as follows:
- Create a
Workbookobject and load an existing Excel file. - Get the source and destination worksheets.
- Get the source cell range and destination cell range via
sheet.Range.get(). - Use
sourceRange.Copy()with the destination range andCopyRangeOptions.Allto copy the cell range with all formatting. - Copy the column widths and row heights from the source range to the destination range.
- Save the workbook to an Excel file using
SaveToFile().
Below is a complete code example demonstrating how to copy cells in React:
function App() {
  const copyCells = async () => {
    // Get the Spire.XLS WASM module
    const xlsModule = window.wasmModule?.spirexls;

    // Check if the module is ready
    if (!xlsModule) {
      alert('Spire.Xls is not ready yet');
      return;
    }

    // Fetch the Excel file and add it to the Virtual File System (VFS)
    let excelFileName = 'Copying.xls';
    await window.spire.FetchFileToVFS(excelFileName, '', `${process.env.PUBLIC_URL}data/`);

    // Create a new workbook and load an existing file
    const workbook = new xlsModule.Workbook();
    workbook.LoadFromFile({ fileName: excelFileName });

    // Get the source and destination worksheets
    let sheet1 = workbook.Worksheets.get(0);
    let sheet2 = workbook.Worksheets.get(1);

    // Get the source cell range and destination cell range
    let range1 = sheet1.Range.get("A1:E7");
    let range2 = sheet2.Range.get("A1:E7");

    // Copy the source range to the destination range with all formatting
    range1.Copy({ destRange: range2, copyOptions: xlsModule.CopyRangeOptions.All });

    // Copy the row heights and column widths from source to destination
    for (let i = 0; i < range1.Rows.length; i++) {
      let row = range1.Rows[i];
      for (let j = 0; j < row.Columns.length; j++) {
        let column = row.Columns[j];
        range2.Rows[i].Columns[j].ColumnWidth = column.ColumnWidth;
        range2.Rows[i].RowHeight = row.RowHeight;
      }
    }

    // Save the workbook
    const outputFileName = 'CopyCells.xlsx';
    workbook.SaveToFile({ fileName: outputFileName, version: xlsModule.ExcelVersion.Version2010 });
    workbook.Dispose();

    // Read the file from VFS and trigger download
    const fileArray = window.dotnetRuntime.Module.FS.readFile(outputFileName);
    const blob = new Blob([fileArray], { type: 'application/vnd.openxmlformats-officedocument.spreadsheetml.sheet' });
    const url = URL.createObjectURL(blob);
    const a = document.createElement('a');
    a.href = url;
    a.download = outputFileName;
    a.click();
    URL.revokeObjectURL(url);
  };

  return (
    <div style={{ textAlign: 'center', height: '300px' }}>
      <h1>Copy Excel Cells</h1>
      <button onClick={copyCells}>
        Generate
      </button>
    </div>
  );
}

export default App;
Cell copy result
FAQ
What happens if the target location already contains data
Cause: By default, the Copy() method overwrites existing data at the target location without merging or preserving the original content.
Solution: Choose an empty area as the destination range, or check whether the target range is empty before performing the copy. You can also back up the target data first, then execute the copy operation.
Can I copy only values without formulas
Cause: CopyRangeOptions.All copies formulas themselves, but sometimes you only need the calculated result values without preserving the formula logic.
Solution: Use the CopyRangeOptions.OnlyCopyFormulaValue option to copy only the calculated result values, not the formulas themselves:
sourceRange.Copy({ destRange: destRange, copyOptions: xlsModule.CopyRangeOptions.OnlyCopyFormulaValue });
Get a Free License
Spire.XLS for JavaScript offers a 30-day full-featured free trial license with no functional limitations. Apply here to evaluate before purchasing.
