
Knowledgebase (2344)
Children categories
Text Alignment in Python | Left, Right, Center Align & More
2024-04-11 05:59:15 Written by hayes Liu
In the world of document automation, proper text alignment is crucial for creating professional, readable, and visually appealing documents. For developers and data professionals building reports, drafting letters, or designing invoices, mastering text alignment in Python is essential to producing polished, consistent documents without manual editing.
This guide delivers a step-by-step walkthrough on how to align text in Python using Spire.Doc for Python, a library that enables effortless control over Word document formatting.
- Why Choose Spire.Doc for Python to Align Text?
- Core Text Alignment Types in Spire.Doc
- Step-by-Step: Align Text in Word in Python
- FAQs About Python Text Alignment
- Conclusion
Why Choose Spire.Doc for Python to Align Text?
Before diving into code, let’s clarify why Spire.Doc is a top choice for text alignment tasks:
- Full Alignment Support: Natively supports all standard alignment types (Left, Right, Center, Justify) for paragraphs.
- No Microsoft Word Dependency: Runs independently - no need to install Word on your machine.
- High Compatibility: Works with .docx, .doc, and other Word formats, ensuring your aligned documents open correctly across devices.
- Fine-Grained Control: Adjust alignment for entire paragraphs or table cells.
Core Text Alignment Types in Spire.Doc
Spire.Doc uses the HorizontalAlignment enum to define text alignment. The most common values are:
- HorizontalAlignment.Left: Aligns text to the left margin (default).
- HorizontalAlignment.Right: Aligns text to the right margin.
- HorizontalAlignment.Center: Centers text horizontally between margins.
- HorizontalAlignment.Justify: Adjusts text spacing so both left and right edges align with margins.
- HorizontalAlignment.Distribute: Adjusts character spacing (adds space between letters) and word spacing to fill the line.
Below, we’ll cover how to programmatically set paragraph alignment (left, right, center, justified, and distributed) in Word using Python
Step-by-Step: Align Text in Word in Python
Here are the actionable steps to generate a Word document with 5 paragraphs, each using a different alignment style.
Step 1: Install Spire.Doc for Python
Open your terminal/command prompt, and then run the following command to install the latest version:
pip install Spire.Doc
Step 2: Import Required Modules
Import the core classes from Spire.Doc. These modules let you create documents, sections, paragraphs, and configure formatting:
from spire.doc import *
from spire.doc.common import *
Step 3: Create a New Word Document
Initialize a Document instance that represents your empty Word file:
# Create a Document instance
doc = Document()
Step 4: Add a Section to the Document
Word documents organize content into sections (each section can have its own margins, page size, etc.). We’ll add one section to hold our paragraphs:
# Add a section to the document
section = doc.AddSection()
Step 5: Add Paragraphs with Different Alignments
A section contains paragraphs, and each paragraph’s alignment is controlled via the HorizontalAlignment enum. We’ll create 5 paragraphs, one for each alignment type.
Left alignment is the default for most text (text aligns to the left margin).
# Left aligned text
paragraph1 = section.AddParagraph()
paragraph1.AppendText("This is left-aligned text.")
paragraph1.Format.HorizontalAlignment = HorizontalAlignment.Left
Right alignment is useful for dates, signatures, or page numbers (text aligns to the right margin).
# Right aligned text
paragraph2 = section.AddParagraph()
paragraph2.AppendText("This is right-aligned text.")
paragraph2.Format.HorizontalAlignment = HorizontalAlignment.Right
Center alignment works well for titles or headings (text centers between left and right margins). Use to center text in Python:
# Center aligned text
paragraph3 = section.AddParagraph()
paragraph3.AppendText("This is center-aligned text.")
paragraph3.Format.HorizontalAlignment = HorizontalAlignment.Center
Justified text aligns both left and right margins (spaces between words are adjusted for consistency). Ideal for formal documents like essays or reports.
# Justified
paragraph4 = section.AddParagraph()
paragraph4.AppendText("This is justified text.")
paragraph4.Format.HorizontalAlignment = HorizontalAlignment.Justify
Note: Justified alignment is more visible with longer text - short phrases may not show the spacing adjustment.
Distributed alignment is similar to justified, but evenly distributes single-line text (e.g., unevenly spaced words or short phrases).
# Distributed
Paragraph5 = section.AddParagraph()
Paragraph5.AppendText("This is evenly distributed text.")
Paragraph5.Format.HorizontalAlignment = HorizontalAlignment.Distribute
Step 6: Save and Close the Document
Finally, save the document to a specified path and close the Document instance to free resources:
# Save the document
document.SaveToFile("TextAlignment.docx", FileFormat.Docx2016)
# Close the document to release memory
document.Close()
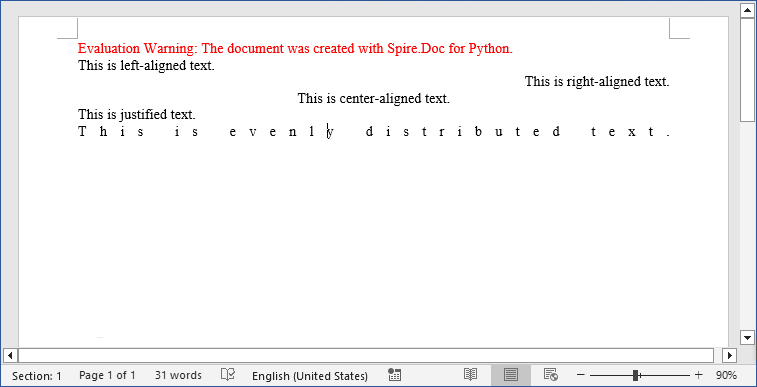
Output:
Pro Tip: Spire.Doc for Python also provides interfaces to align tables in Word or align text in table cells.
FAQs About Python Text Alignment
Q1: Is Spire.Doc for Python free?
A: Spire.Doc offers a free version with limitations. For full functionality, you can request a 30-day trial license here.
Q2: Can I set text alignment for existing Word documents
A: Yes. Spire.Doc lets you load existing documents and modify text alignment for specific paragraphs. Here’s a quick example:
from spire.doc import *

# Load an existing document
doc = Document()
doc.LoadFromFile("ExistingDocument.docx")

# Get the first section and first paragraph
section = doc.Sections[0]
paragraph = section.Paragraphs[0]

# Change alignment to center
paragraph.Format.HorizontalAlignment = HorizontalAlignment.Center

# Save the modified document
doc.SaveToFile("UpdatedDocument.docx", FileFormat.Docx2016)
doc.Close()
Q3: Can I apply different alignments to different parts of the same paragraph?
A: No. Text alignment is a paragraph-level setting in Word, not a character-level setting. This means all text within a single paragraph must share the same alignment (left, right, center, etc.).
If you need mixed alignment in the same line, you’ll need to use a table with invisible borders.
Q4: Can Spire.Doc for Python handle other text formatting?
A: Absolutely! Spire.Doc lets you combine alignment with other formatting like fonts, line spacing, bullet points, and more.
Conclusion
Automating Word text alignment with Python and Spire.Doc saves time, reduces human error, and ensures consistency across documents. The code example provided offers a clear template for implementing left, right, center, justified, and distributed alignment, and adapting it to your needs is as simple as modifying the text or adding more formatting rules.
Try experimenting with different alignment combinations, and explore Spire.Doc’s online documentation to unlock more formatting possibilities.
Markdown, as a lightweight markup language, is favored by programmers and technical document writers for its simplicity, readability, and clear syntax. However, in specific scenarios, there is often a need to convert Markdown documents into Word documents with rich formatting capabilities and control over the layout or to generate PDF files suitable for printing and easy viewing. This article is going to demonstrate how to convert Markdown content into Word documents or PDF files with Spire.Doc for .NET to meet various document processing requirements in different scenarios.
Install Spire.Doc for .NET
To begin with, you need to add the DLL files included in the Spire.Doc for .NET package as references in your .NET project. The DLL files can be either downloaded from this link or installed via NuGet.
PM> Install-Package Spire.Doc
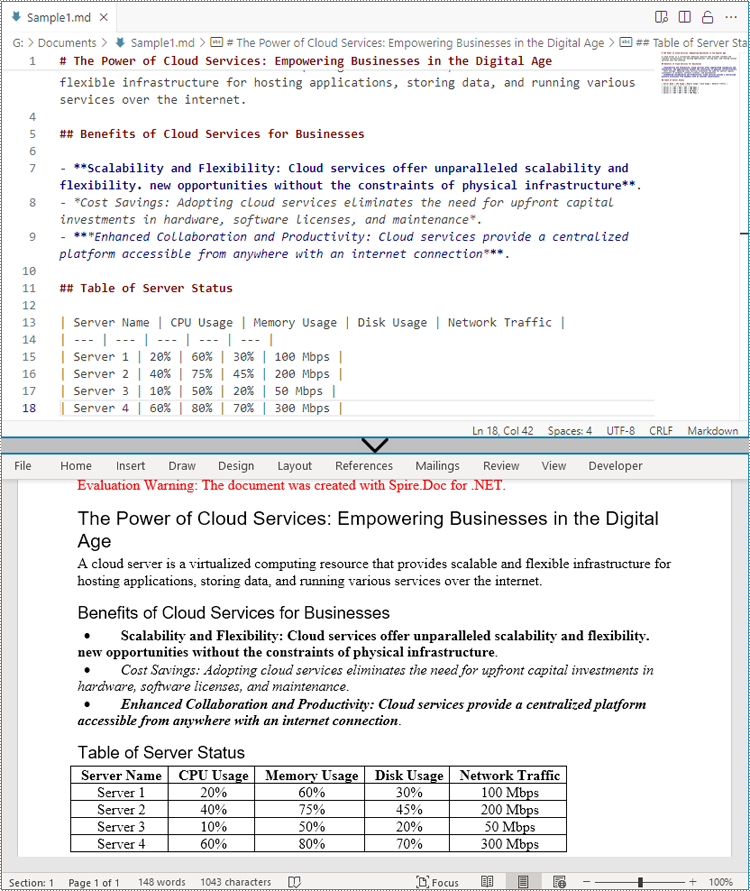
Convert Markdown Files to Word Documents with C#
With Spire.Doc for .NET, we can load a Markdown file using Document.LoadFromFile(string fileName, FileFormat.Markdown) method and then convert it to other formats using Document.SaveToFile(string fileName, fileFormat FileFormat) method.
Since images in Markdown files are stored as links, directly converting a Markdown file to a Word document is suitable for Markdown files that do not contain images. If the file contains images, further processing of the images is required after conversion.
Here are the steps to convert a Markdown file to a Word document:
- Create an instance of Document class.
- Load a Markdown file using Document.LoadFromFile(string fileName, FileFormat.Markdown) method.
- Convert the file to a Word document and save it using Document.SaveToFile(string fileName, FileFormat.Docx) method.
- C#
using Spire.Doc;

namespace MdToDocx
{
    class Program
    {
        static void Main(string[] args)
        {
            // Create an object of Document class
            Document doc = new Document();

            // Load a Markdown file
            doc.LoadFromFile("Sample.md", FileFormat.Markdown);

            // Convert the Markdown file to a Word document
            doc.SaveToFile("MarkdownToWord.docx", FileFormat.Docx);
            doc.Close();
        }
    }
}
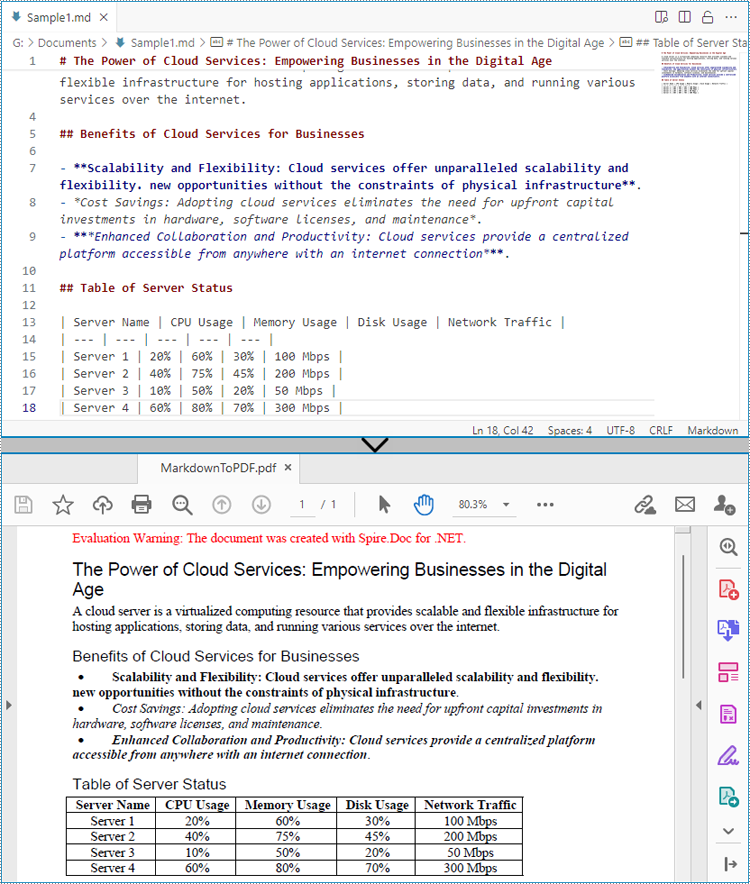
Convert Markdown Files to PDF Files with C#
We can also directly convert Markdown files to PDF files by using the FileFormat.PDF Enum as the parameter. Here are the steps to convert a Markdown file to a PDF file:
- Create an instance of Document class.
- Load a Markdown file using Document.LoadFromFile(string fileName, FileFormat.Markdown) method.
- Convert the file to a PDF file and save it using Document.SaveToFile(string fileName, FileFormat.Docx) method.
- C#
using Spire.Doc;

namespace MdToDocx
{
    class Program
    {
        static void Main(string[] args)
        {
            // Create an object of Document class
            Document doc = new Document();

            // Load a Markdown file
            doc.LoadFromFile("Sample.md", FileFormat.Markdown);

            // Convert the Markdown file to a PDF file
            doc.SaveToFile("MarkdownToPDF.pdf", FileFormat.PDF);
            doc.Close();
        }
    }
}
Apply for a Temporary License
If you'd like to remove the evaluation message from the generated documents, or to get rid of the function limitations, please request a 30-day trial license for yourself.
Adding gutters on Word document pages can assist users in better page layout and design, especially when preparing documents for printing or creating books that require gutter. Gutter can indicate the gutter position on the page, helping users to design with appropriate blank areas to avoid text or images being cut off. By setting gutter, users can have better control over the appearance and layout of the document, ensuring that the final output meets the expected gutter requirements, enhancing the professionalism and readability of the document. This article shows how to add gutters on Word document pages by programming using Spire.Doc for Java.
- Add a Gutter at the Top of a Word Document Page in Java
- Add a Gutter at the Left of a Word Document Page in Java
Install Spire.Doc for Java
First, you're required to add the Spire.Doc.jar file as a dependency in your Java program. The JAR file can be downloaded from this link. If you use Maven, you can easily import the JAR file in your application by adding the following code to your project's pom.xml file.
<repositories>
    <repository>
        <id>com.e-iceblue</id>
        <name>e-iceblue</name>
        <url>https://repo.e-iceblue.com/nexus/content/groups/public/</url>
    </repository>
</repositories>
<dependencies>
    <dependency>
        <groupId>e-iceblue</groupId>
        <artifactId>spire.doc</artifactId>
        <version>14.6.0</version>
    </dependency>
</dependencies>
Add a Gutter at the Top of a Word Document Page in Java
In a Word document, you can set section.getPageSetup().isTopGutter(true) to place the gutter at the top of the page. By default, the gutter area is displayed as blank without any content. This example also includes steps on how to add content, such as the dash symbol, to the gutter area to customize content around the gutter. Here are the detailed steps:
- Create a Document object.
- Load a document using the Document.loadFromFile() method.
- Iterate through all sections of the document using a for loop and Document.getSections().
- Set Section.getPageSetup().isTopGutter(true) to display the gutter at the top of the page.
- Use Section.getPageSetup().setGutter() to set the width of the gutter.
- Call the custom addTopGutterContent() method to add content to the gutter area.
- Save the document using the Document.saveToFile() method.
- Java
import com.spire.doc.*;
import com.spire.doc.documents.*;
import com.spire.doc.fields.*;
import com.spire.doc.formatting.CharacterFormat;
import java.awt.*;

public class AddTopGutter {
    public static void main(String[] args) {
        // Create a document object
        Document document = new Document();

        // Load the document
        document.loadFromFile("Sample1.docx");

        // Iterate through all sections of the document
        for (int i = 0; i < document.getSections().getCount(); i++) {
            // Get the current section
            Section section = document.getSections().get(i);

            // Set whether to add a gutter at the top of the page to true
            section.getPageSetup().isTopGutter(true);

            // Set the width of the gutter to 100f
            section.getPageSetup().setGutter(100f);

            // Call the method to add content to the top gutter
            addTopGutterContent(section);
        }

        // Save the modified document to a file
        document.saveToFile("AddGutterOnTop.docx", FileFormat.Docx_2016);

        // Release document resources
        document.dispose();
    }

    // Method to add content to the top gutter
    static void addTopGutterContent(Section section) {
        // Get the header of the section
        HeaderFooter header = section.getHeadersFooters().getHeader();

        // Set the width of the text box to the width of the page
        float width = (float) section.getPageSetup().getPageSize().getWidth();

        // Set the height of the text box to 40
        float height = 40;

        // Add a text box to the header
        TextBox textBox = header.addParagraph().appendTextBox(width, height);

        // Set the text box without borders
        textBox.getFormat().setNoLine(true);

        // Set the vertical origin of the text box to the top margin area
        textBox.setVerticalOrigin(VerticalOrigin.Top_Margin_Area);

        // Set the vertical position of the text box
        textBox.setVerticalPosition(140);

        // Set the horizontal alignment of the text box to left
        textBox.setHorizontalAlignment(ShapeHorizontalAlignment.Left);

        // Set the horizontal origin of the text box to the left margin area
        textBox.setHorizontalOrigin(HorizontalOrigin.Left_Margin_Area);

        // Set the text anchor to the bottom
        textBox.getFormat().setTextAnchor(ShapeVerticalAlignment.Bottom);

        // Set the text wrapping style to in front of text
        textBox.getFormat().setTextWrappingStyle(TextWrappingStyle.In_Front_Of_Text);

        // Set the text wrapping type to both sides
        textBox.getFormat().setTextWrappingType(TextWrappingType.Both);

        // Create a paragraph object
        Paragraph paragraph = new Paragraph(section.getDocument());

        // Set the paragraph alignment to center
        paragraph.getFormat().setHorizontalAlignment(HorizontalAlignment.Center);

        // Create a font object
        Font font = new Font("SimSun", Font.PLAIN, 8);

        Graphics graphics = new java.awt.image.BufferedImage(1, 1, java.awt.image.BufferedImage.TYPE_INT_ARGB).getGraphics();
        graphics.setFont(font);
        FontMetrics fontMetrics = graphics.getFontMetrics();
        String text1 = " - ";
        int textWidth1 = fontMetrics.stringWidth(text1);
        int count = (int) (textBox.getWidth() / textWidth1);
        StringBuilder stringBuilder = new StringBuilder();
        for (int i = 1; i < count; i++) {
            stringBuilder.append(text1);
        }
        // Create a character format object
        CharacterFormat characterFormat = new CharacterFormat(section.getDocument());
        characterFormat.setFontName(font.getFontName());
        characterFormat.setFontSize(font.getSize());
        TextRange textRange = paragraph.appendText(stringBuilder.toString());
        textRange.applyCharacterFormat(characterFormat);

        // Add the paragraph to the text box
        textBox.getChildObjects().add(paragraph);
    }
}
Add a Gutter at the Left of a Word Document Page in Java
To set the gutter on the left side of the page, the key is to set Section.getPageSetup().isTopGutter(false). Here are the detailed steps:
- Create a Document object.
- Load a document using the Document.loadFromFile() method.
- Iterate through all sections of the document using a for loop and Document.getSections().
- Set Section.getPageSetup().isTopGutter(false) to display the gutter on the left side of the page.
- Use Section.getPageSetup().setGutter() to set the width of the gutter.
- Call the custom addLeftGutterContent() method to add content to the gutter area.
- Save the document using the Document.saveToFile() method.
- Java
import com.spire.doc.*;
import com.spire.doc.documents.*;
import com.spire.doc.fields.*;
import com.spire.doc.formatting.CharacterFormat;
import java.awt.*;

public class AddLeftGutter {
    public static void main(String[] args) {
        // Create a document object
        Document document = new Document();

        // Load the document
        document.loadFromFile("Sample1.docx");

        // Iterate through all sections of the document
        for (int i = 0; i < document.getSections().getCount(); i++) {
            // Get the current section
            Section section = document.getSections().get(i);

            // Set whether to add a gutter at the top of the page to false, it will be added to the left side of the page
            section.getPageSetup().isTopGutter(false);

            // Set the width of the gutter to 100f
            section.getPageSetup().setGutter(100f);

            // Call the method to add content to the left gutter
            AddLeftGutterContent (section);
        }

        // Save the modified document to a file
        document.saveToFile("AddGutterOnLeft.docx", FileFormat.Docx_2016);

        // Release document resources
        document.dispose();
    }

    // Method to add content to the left gutter
    static void AddLeftGutterContent(Section section) {
        // Get the header of the section
        HeaderFooter header = section.getHeadersFooters().getHeader();

        // Set the width of the text box to 40
        float width = 40;

        // Get the page height
        float height = (float) section.getPageSetup().getPageSize().getHeight();

        // Add a text box to the header
        TextBox textBox = header.addParagraph().appendTextBox(width, height);

        // Set the text box without borders
        textBox.getFormat().setNoLine(true);

        // Set the text direction in the text box from right to left
        textBox.getFormat().setLayoutFlowAlt(TextDirection.Right_To_Left);

        // Set the horizontal starting position of the text box
        textBox.setHorizontalOrigin(HorizontalOrigin.Left_Margin_Area);

        // Set the horizontal position of the text box
        textBox.setHorizontalPosition(140);

        // Set the vertical alignment of the text box to the top
        textBox.setVerticalAlignment(ShapeVerticalAlignment.Top);

        // Set the vertical origin of the text box to the top margin area
        textBox.setVerticalOrigin(VerticalOrigin.Top_Margin_Area);

        // Set the text anchor to the top
        textBox.getFormat().setTextAnchor(ShapeVerticalAlignment.Top);

        // Set the text wrapping style to in front of text
        textBox.getFormat().setTextWrappingStyle(TextWrappingStyle.In_Front_Of_Text);

        // Set the text wrapping type to both sides
        textBox.getFormat().setTextWrappingType(TextWrappingType.Both);

        // Create a paragraph object
        Paragraph paragraph = new Paragraph(section.getDocument());

        // Set the paragraph alignment to center
        paragraph.getFormat().setHorizontalAlignment(HorizontalAlignment.Center);

        // Create a font object, SimSun, size 8
        Font font = new Font("SimSun", Font.PLAIN, 8);

        Graphics graphics = new java.awt.image.BufferedImage(1, 1, java.awt.image.BufferedImage.TYPE_INT_ARGB).getGraphics();
        graphics.setFont(font);
        FontMetrics fontMetrics = graphics.getFontMetrics();
        String text1 = " - ";
        int textWidth1 = fontMetrics.stringWidth(text1);
        int count = (int) (textBox.getHeight() / textWidth1);
        StringBuilder stringBuilder = new StringBuilder();
        for (int i = 1; i < count ; i++) {
            stringBuilder.append(text1);
        }

        // Create a character format object
        CharacterFormat characterFormat = new CharacterFormat(section.getDocument());
        characterFormat.setFontName(font.getFontName());
        characterFormat.setFontSize(font.getSize());
        TextRange textRange = paragraph.appendText(stringBuilder.toString());
        textRange.applyCharacterFormat(characterFormat);

        // Add the paragraph to the text box
        textBox.getChildObjects().add(paragraph);
    }
}
Apply for a Temporary License
If you'd like to remove the evaluation message from the generated documents, or to get rid of the function limitations, please request a 30-day trial license for yourself.
