
Knowledgebase (2417)
Children categories
In the context of Excel, Open XML refers to the underlying file format used by Excel to store spreadsheet data, formatting, formulas, and other related information. It provides a powerful and flexible basis for working with Excel files programmatically.
By converting Excel to Open XML, developers gain greater control and automation when working with spreadsheet-related tasks. In turn, you can also generate Excel files from Open XML to take advantage of Excel's built-in capabilities to perform advanced data operations. In this article, you will learn how to convert Excel to Open XML or Open XML to Excel in Python using Spire.XLS for Python.
Install Spire.XLS for Python
This scenario requires Spire.XLS for Python and plum-dispatch v1.7.4. They can be easily installed in your Windows through the following pip command.
pip install Spire.XLS
If you are unsure how to install, please refer to this tutorial: How to Install Spire.XLS for Python on Windows
Convert Excel to Open XML in Python
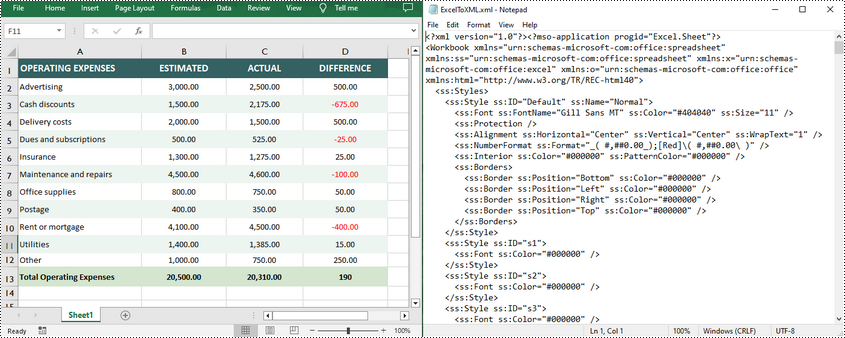
Spire.XLS for Python offers the Workbook.SaveAsXml() method to save an Excel file in Open XML format. The following are the detailed steps.
- Create a Workbook object.
- Load an Excel file using Workbook.LoadFromFile() method.
- Save the Excel file in Open XML format using Workbook.SaveAsXml() method.
- Python
from spire.xls import *
from spire.xls.common import *

# Create a Workbook object
workbook = Workbook()

# Load an Excel file
workbook.LoadFromFile("sample.xlsx")

# Save the Excel file in Open XML file format
workbook.SaveAsXml("ExcelToXML.xml")
workbook.Dispose()
Convert Open XML to Excel in Python
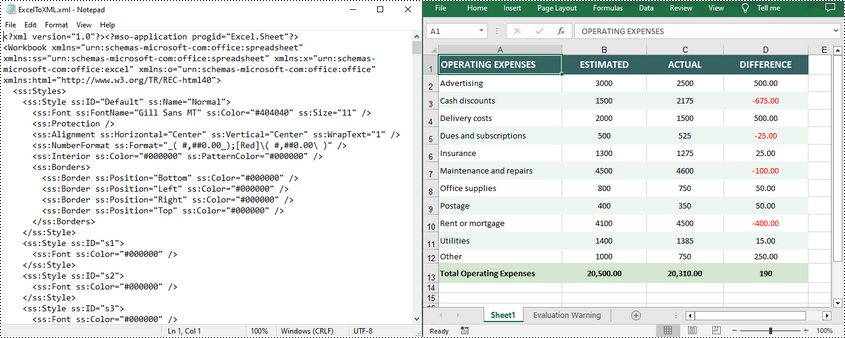
To convert an Open XML file to Excel, you need to load the Open XML file through the Workbook.LoadFromXml() method, and then call the Workbook.SaveToFile() method to save it as an Excel file. The following are the detailed steps.
- Create a Workbook object.
- Load an Open XML file using Workbook.LoadFromXml() method.
- Save the Open XML file to Excel using Workbook.SaveToFile() method.
- Python
from spire.xls import *
from spire.xls.common import *

# Create a Workbook object
workbook = Workbook()

# Load an Open XML file
workbook.LoadFromXml("ExcelToXML.xml")

# Save the Open XML file to Excel XLSX format
workbook.SaveToFile("XMLToExcel.xlsx", ExcelVersion.Version2016)
workbook.Dispose()
Apply for a Temporary License
If you'd like to remove the evaluation message from the generated documents, or to get rid of the function limitations, please request a 30-day trial license for yourself.
Comment in Excel is primarily used to add additional instructions or notes to cells. With this feature, users can add relevant content next to a specific cell to explain the data, provide contextual information, or give instructions. It also helps users to better organize and manage the data in the Excel workbook and improve the understanding and readability of the data. Spire.XLS for Python supports adding comments to Excel files. If necessary, you can also use this library to edit the content of the comments or delete unnecessary comments. In this article, we will show you how to edit or remove existing comments in Excel on Python platforms using Spire.XLS for Python.
Install Spire.XLS for Python
This scenario requires Spire.XLS for Python and plum-dispatch v1.7.4. They can be easily installed in your Windows through the following pip commands.
pip install Spire.XLS
If you are unsure how to install, please refer to this tutorial: How to Install Spire.XLS for Python on Windows
Edit Existing Comments in Excel Using Python
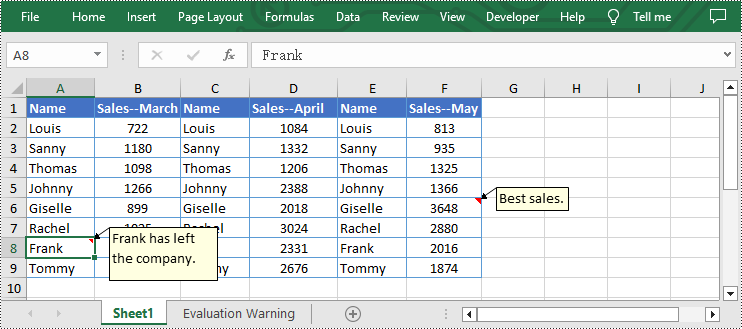
Spire.XLS for Python allows users to edit existing comments in Excel, including setting new text or changing comment box size. The following are detailed steps.
- Create a Workbook instance.
- Load an Excel file from disk using Workbook.LoadFromFile() method.
- Get the first worksheet of the Excel file using Workbook.Worksheets[] property.
- Set new text for the existing comments using Worksheet.Range[].Comment.Text property.
- Set the height and width of the existing comment by using Worksheet.Range[].Comment.Height and Worksheet.Range[].Comment.Width properties.
- Automatically adapt to the size of the comment by setting the Worksheet.Range.Comment.AutoSize property to "True".
- Save the result file using Workbook.SaveToFile() method.
- Python
from spire.xls import *
from spire.xls.common import *

inputFile = "C:/Users/Administrator/Desktop/Sample.xlsx"
outputFile = "C:/Users/Administrator/Desktop/EditExcelComment.xlsx"

# Create a Workbook instance
workbook = Workbook()

# Load an Excel file from disk
workbook.LoadFromFile(inputFile)

# Get the first worksheet of this file
sheet = workbook.Worksheets[0]

# Set new text for the existing comments
sheet.Range["A8"].Comment.Text = "Frank has left the company."
sheet.Range["F6"].Comment.Text = "Best sales."

# Set the height and width of the comment of A8
sheet.Range["A8"].Comment.Height = 60
sheet.Range["A8"].Comment.Width = 100

# Automatically adapt to the size of the comment of F6
sheet.Range["F6"].Comment.AutoSize = True

# Save the result file
workbook.SaveToFile(outputFile, ExcelVersion.Version2013)
workbook.Dispose()
Remove Existing Comments from Excel Using Python
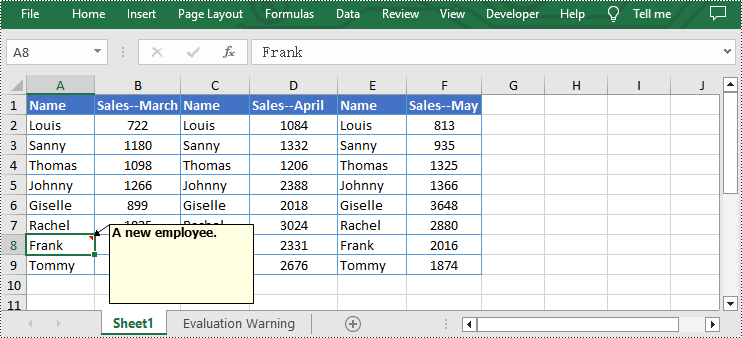
The Worksheet.Range[].Comment.Remove() method offered by Spire.XLS for Python allows users to remove a specified comment easily. The detailed steps are as follows.
- Create a Workbook instance.
- Load an Excel file from disk using Workbook.LoadFromFile() method.
- Get the first worksheet of the Excel file using Workbook.Worksheets[] property.
- Remove the comment by using Worksheet.Range[].Comment.Remove() method.
- Save the document to another file using Workbook.SaveToFile() method.
- Python
from spire.xls import *
from spire.xls.common import *

inputFile = "C:/Users/Administrator/Desktop/Sample.xlsx"
outputFile = "C:/Users/Administrator/Desktop/RemoveExcelComment.xlsx"

# Create a Workbook instance
workbook = Workbook()

# Load an Excel file from disk
workbook.LoadFromFile(inputFile)

# Get the first worksheet of this file
sheet = workbook.Worksheets[0]

# Remove the comment from the sheet
sheet.Range["F6"].Comment.Remove()

# Save the result file
workbook.SaveToFile(outputFile, ExcelVersion.Version2013)
workbook.Dispose()
Apply for a Temporary License
If you'd like to remove the evaluation message from the generated documents, or to get rid of the function limitations, please request a 30-day trial license for yourself.
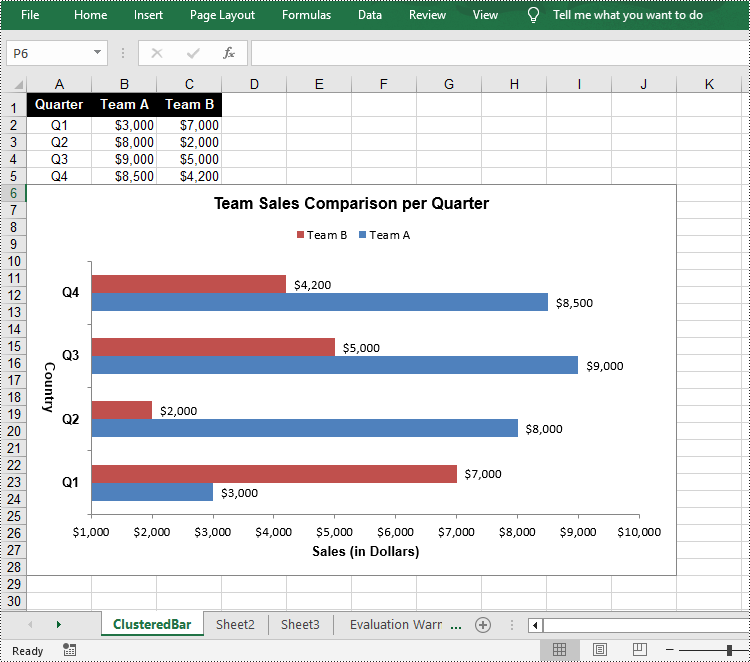
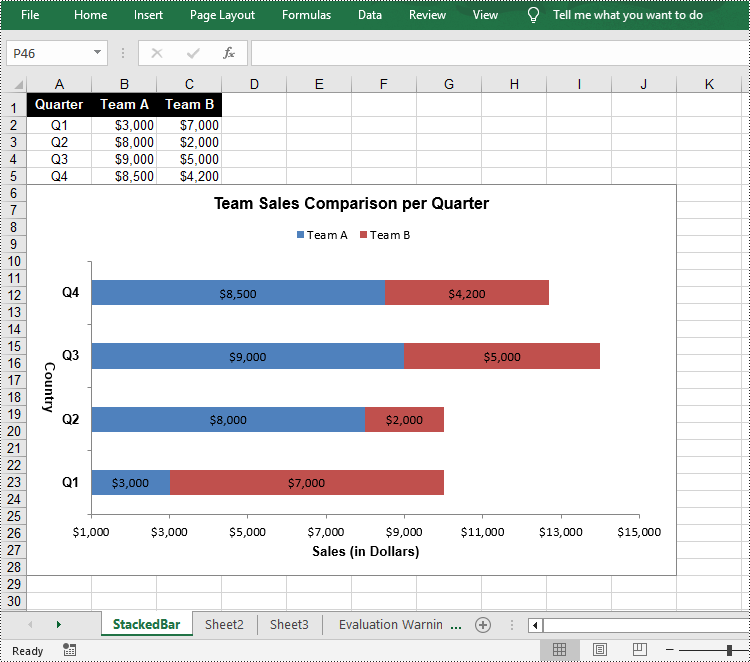
A bar chart is a type of graph that represents categorical data using rectangular bars. It is somewhat like a column chart, but with bars that extend horizontally from the Y-axis. The length of each bar corresponds to the value represented by a particular category or group, and changes, trends, or rankings can be quickly identified by comparing the lengths of the bars. In this article, you will learn how to create a clustered or stacked bar chart in Excel in Python using Spire.XLS for Python.
Install Spire.XLS for Python
This scenario requires Spire.XLS for Python and plum-dispatch v1.7.4. They can be easily installed in your Windows through the following pip command.
pip install Spire.XLS
If you are unsure how to install, please refer to this tutorial: How to Install Spire.XLS for Python on Windows
Create a Clustered Bar Chart in Excel in Python
The Worksheet.Chart.Add(ExcelChartType chartType) method provided by Spire.XLS for Python allows to add a chart to a worksheet. To add a clustered bar chart in Excel, you can set the chart type to BarClustered. The following are the steps.
- Create a Workbook object.
- Get a specific worksheet using Workbook.Worksheets[index] property.
- Add chart data to specified cells and set the cell styles.
- Add a clustered bar char to the worksheet using Worksheet.Chart.Add(ExcelChartType.BarClustered) method.
- Set data range for the chart using Chart.DataRange property.
- Set position, title, category axis and value axis for the chart.
- Save the result file using Workbook.SaveToFile() method.
- Python
from spire.xls import *

# Create a Workbook instance
workbook = Workbook()

# Get the first sheet and set its name
sheet = workbook.Worksheets[0]
sheet.Name = "ClusteredBar"

# Add chart data to specified cells
sheet.Range["A1"].Value = "Quarter"
sheet.Range["A2"].Value = "Q1"
sheet.Range["A3"].Value = "Q2"
sheet.Range["A4"].Value = "Q3"
sheet.Range["A5"].Value = "Q4"
sheet.Range["B1"].Value = "Team A"
sheet.Range["B2"].NumberValue = 3000
sheet.Range["B3"].NumberValue = 8000
sheet.Range["B4"].NumberValue = 9000
sheet.Range["B5"].NumberValue = 8500
sheet.Range["C1"].Value = "Team B"
sheet.Range["C2"].NumberValue = 7000
sheet.Range["C3"].NumberValue = 2000
sheet.Range["C4"].NumberValue = 5000
sheet.Range["C5"].NumberValue = 4200

# Set cell style
sheet.Range["A1:C1"].RowHeight = 18
sheet.Range["A1:C1"].Style.Color = Color.get_Black()
sheet.Range["A1:C1"].Style.Font.Color = Color.get_White()
sheet.Range["A1:C1"].Style.Font.IsBold = True
sheet.Range["A1:C1"].Style.VerticalAlignment = VerticalAlignType.Center
sheet.Range["A1:C1"].Style.HorizontalAlignment = HorizontalAlignType.Center
sheet.Range["A2:A5"].Style.HorizontalAlignment = HorizontalAlignType.Center
sheet.Range["B2:C5"].Style.NumberFormat = "\"$\"#,##0"

# Add a clustered bar chart to the sheet
chart = sheet.Charts.Add(ExcelChartType.BarClustered)

# Set data range of the chart
chart.DataRange = sheet.Range["A1:C5"]
chart.SeriesDataFromRange = False

# Set position of the chart
chart.LeftColumn = 1
chart.TopRow = 6
chart.RightColumn = 11
chart.BottomRow = 29

# Set and format chart title
chart.ChartTitle = "Team Sales Comparison per Quarter"
chart.ChartTitleArea.IsBold = True
chart.ChartTitleArea.Size = 12

# Set and format category axis
chart.PrimaryCategoryAxis.Title = "Country"
chart.PrimaryCategoryAxis.Font.IsBold = True
chart.PrimaryCategoryAxis.TitleArea.IsBold = True
chart.PrimaryCategoryAxis.TitleArea.TextRotationAngle = 90

# Set and format value axis
chart.PrimaryValueAxis.Title = "Sales (in Dollars)"
chart.PrimaryValueAxis.HasMajorGridLines = False
chart.PrimaryValueAxis.MinValue = 1000
chart.PrimaryValueAxis.TitleArea.IsBold = True

# Show data labels for data points
for cs in chart.Series:
    cs.Format.Options.IsVaryColor = True
    cs.DataPoints.DefaultDataPoint.DataLabels.HasValue = True

# Set legend position
chart.Legend.Position = LegendPositionType.Top

#Save the result file
workbook.SaveToFile("ClusteredBarChart.xlsx", ExcelVersion.Version2016)
workbook.Dispose()
Create a Stacked Bar Chart in Excel in Python
To create a stacked bar chart, you just need to change the Excel chart type to BarStacked. The following are the steps.
- Create a Workbook object.
- Get a specific worksheet using Workbook.Worksheets[index] property.
- Add chart data to specified cells and set the cell styles.
- Add a clustered bar char to the worksheet using Worksheet.Chart.Add(ExcelChartType.BarStacked) method.
- Set data range for the chart using Chart.DataRange property.
- Set position, title, category axis and value axis for the chart.
- Save the result file using Workbook.SaveToFile() method.
- Python
from spire.xls import *

# Create a Workbook instance
workbook = Workbook()

# Get the first sheet and set its name
sheet = workbook.Worksheets[0]
sheet.Name = "StackedBar"

# Add chart data to specified cells
sheet.Range["A1"].Value = "Quarter"
sheet.Range["A2"].Value = "Q1"
sheet.Range["A3"].Value = "Q2"
sheet.Range["A4"].Value = "Q3"
sheet.Range["A5"].Value = "Q4"
sheet.Range["B1"].Value = "Team A"
sheet.Range["B2"].NumberValue = 3000
sheet.Range["B3"].NumberValue = 8000
sheet.Range["B4"].NumberValue = 9000
sheet.Range["B5"].NumberValue = 8500
sheet.Range["C1"].Value = "Team B"
sheet.Range["C2"].NumberValue = 7000
sheet.Range["C3"].NumberValue = 2000
sheet.Range["C4"].NumberValue = 5000
sheet.Range["C5"].NumberValue = 4200

# Set cell style
sheet.Range["A1:C1"].RowHeight = 18
sheet.Range["A1:C1"].Style.Color = Color.get_Black()
sheet.Range["A1:C1"].Style.Font.Color = Color.get_White()
sheet.Range["A1:C1"].Style.Font.IsBold = True
sheet.Range["A1:C1"].Style.VerticalAlignment = VerticalAlignType.Center
sheet.Range["A1:C1"].Style.HorizontalAlignment = HorizontalAlignType.Center
sheet.Range["A2:A5"].Style.HorizontalAlignment = HorizontalAlignType.Center
sheet.Range["B2:C5"].Style.NumberFormat = "\"$\"#,##0"

# Add a clustered bar chart to the sheet
chart = sheet.Charts.Add(ExcelChartType.BarStacked)

# Set data range of the chart
chart.DataRange = sheet.Range["A1:C5"]
chart.SeriesDataFromRange = False

# Set position of the chart
chart.LeftColumn = 1
chart.TopRow = 6
chart.RightColumn = 11
chart.BottomRow = 29

# Set and format chart title
chart.ChartTitle = "Team Sales Comparison per Quarter"
chart.ChartTitleArea.IsBold = True
chart.ChartTitleArea.Size = 12

# Set and format category axis
chart.PrimaryCategoryAxis.Title = "Country"
chart.PrimaryCategoryAxis.Font.IsBold = True
chart.PrimaryCategoryAxis.TitleArea.IsBold = True
chart.PrimaryCategoryAxis.TitleArea.TextRotationAngle = 90

# Set and format value axis
chart.PrimaryValueAxis.Title = "Sales (in Dollars)"
chart.PrimaryValueAxis.HasMajorGridLines = False
chart.PrimaryValueAxis.MinValue = 1000
chart.PrimaryValueAxis.TitleArea.IsBold = True

# Show data labels for data points
for cs in chart.Series:
    cs.Format.Options.IsVaryColor = True
    cs.DataPoints.DefaultDataPoint.DataLabels.HasValue = True

# Set legend position
chart.Legend.Position = LegendPositionType.Top

#Save the result file
workbook.SaveToFile("StackedBarChart.xlsx", ExcelVersion.Version2016)
workbook.Dispose()
Apply for a Temporary License
If you'd like to remove the evaluation message from the generated documents, or to get rid of the function limitations, please request a 30-day trial license for yourself.
