
Knowledgebase (2344)
Children categories
The use of appropriate fonts in PDF can greatly improve the overall readability and aesthetics of the document. In addition to the commonly used standard fonts, sometimes you may also need to embed private fonts. In this article, you will learn how to use different fonts in PDF in Python using Spire.PDF for Python.
Install Spire.PDF for Python
This scenario requires Spire.PDF for Python and plum-dispatch v1.7.4. They can be easily installed in your Windows through the following pip command.
pip install Spire.PDF
If you are unsure how to install, please refer to this tutorial: How to Install Spire.PDF for Python on Windows
Apply Different Fonts in a PDF Document in Python
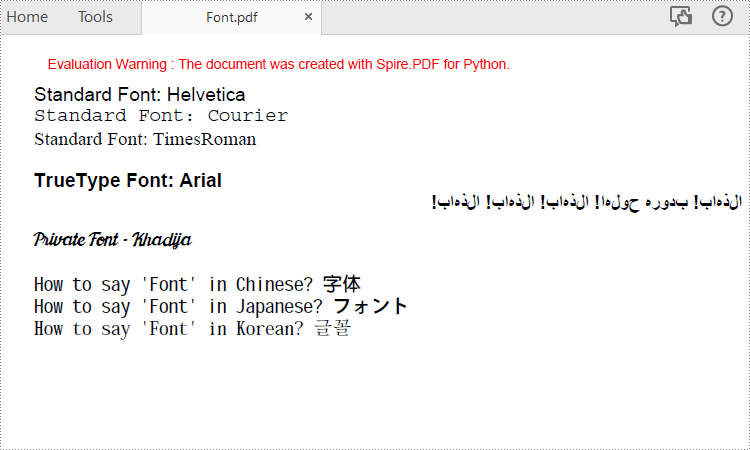
Spire.PDF for Python supports standard PDF fonts, TrueType fonts, private fonts as well as CJK font. The following are the steps to draw text in PDF using these fonts.
- Create a PdfDocument instance.
- Add a page and then create a brush.
- Create an instance of the PdfFont class with a standard PDF font, and then use the PdfPageBase.getCanvas().drawString() method to draw text on the page with the standard font.
- Create an instance of the PdfTrueTypeFont class with a specified font, and then draw text on the page with the TrueType font.
- Load a private font and create an instance of the PdfTrueTypeFont class with it. Then draw text on the page with the private font.
- Create an instance of PdfCjkStandardFont class with a CJK font, and then draw text on the page with the CJK font.
- Save the result document using PdfDocument.SaveToFile() method.
- Python
from spire.pdf.common import *
from spire.pdf import *

# Create a PdfDocument object
pdf = PdfDocument()

# Add a page
page = pdf.Pages.Add()

# Create a brush
brush = PdfBrushes.get_Black()

# Initialize y coordinate
y = 30.0

# Draw text using standard fonts
font = PdfFont(PdfFontFamily.Helvetica, 14.0)
page.Canvas.DrawString("Standard Font: Helvetica", font, brush, 0.0, y)
font = PdfFont(PdfFontFamily.Courier, 14.0)
page.Canvas.DrawString("Standard Font: Courier", font, brush, 0.0, (y := y + 16.0))
font = PdfFont(PdfFontFamily.TimesRoman, 14.0)
page.Canvas.DrawString("Standard Font: TimesRoman", font, brush, 0.0, (y := y + 16.0))

#Draw text using truetype font
trueTypeFont = PdfTrueTypeFont("Arial", 14.0, PdfFontStyle.Bold,True)
page.Canvas.DrawString("TrueType Font: Arial", trueTypeFont, brush, 0.0, (y := y + 30.0))

# Draw Arabic text from right to left
arabicText = "\u0627\u0644\u0630\u0647\u0627\u0628\u0021\u0020" + "\u0628\u062F\u0648\u0631\u0647\u0020\u062D\u0648\u0644\u0647\u0627\u0021\u0020" + "\u0627\u0644\u0630\u0647\u0627\u0628\u0021\u0020" + "\u0627\u0644\u0630\u0647\u0627\u0628\u0021\u0020" + "\u0627\u0644\u0630\u0647\u0627\u0628\u0021"
trueTypeFont = PdfTrueTypeFont("Arial", 14.0, PdfFontStyle.Bold,True)
rctg = RectangleF(PointF(0.0, (y := y + 16.0)), page.Canvas.ClientSize)
strformat = PdfStringFormat(PdfTextAlignment.Right)
strformat.RightToLeft = True
page.Canvas.DrawString(arabicText, trueTypeFont, brush, rctg, strformat)

# Draw text using private font
trueTypeFont = PdfTrueTypeFont("Khadija.ttf", 14.0)
page.Canvas.DrawString("Private Font - Khadija", trueTypeFont, brush, 0.0, (y := y + 30.0))

# Draw text using cjk fonts
cjkFont = PdfCjkStandardFont(PdfCjkFontFamily.MonotypeHeiMedium, 14.0)
page.Canvas.DrawString("How to say 'Font' in Chinese? \u5B57\u4F53", cjkFont, brush, 0.0, (y := y + 30.0))
cjkFont = PdfCjkStandardFont(PdfCjkFontFamily.HanyangSystemsGothicMedium, 14.0)
page.Canvas.DrawString("How to say 'Font' in Japanese? \u30D5\u30A9\u30F3\u30C8", cjkFont, brush, 0.0, (y := y + 16.0))
cjkFont = PdfCjkStandardFont(PdfCjkFontFamily.HanyangSystemsShinMyeongJoMedium, 14.0)
page.Canvas.DrawString("How to say 'Font' in Korean? \uAE00\uAF34", cjkFont, brush, 0.0, (y := y + 16.0))

#Save the result document
pdf.SaveToFile("Font.pdf")
pdf.Close()
Apply for a Temporary License
If you'd like to remove the evaluation message from the generated documents, or to get rid of the function limitations, please request a 30-day trial license for yourself.
Convert HTML to Word DOC or DOCX in Python | Developer Tutorial
2023-11-17 00:56:39 Written by Koohji
Converting HTML files to Word documents in Python is an essential skill for developers building documentation systems, report generators, or applications that transform web-based content into offline editable formats. While HTML excels at displaying content on the web, Word documents provide a more versatile format for offline access, collaboration, and professional presentation.
This in-depth developer guide shows you how to automate the conversion from HTML files and HTML strings into Word DOCX/DOC documents in Python using Spire.Doc for Python—a powerful, standalone library that enables high-quality Word document generation and conversion without the need for Microsoft Word.
Table of Contents
- Why Convert HTML to Word Format
- Install HTML to Word Converter in Python
- Export HTML Files to Word Documents in Python
- Insert HTML Strings into Word Documents in Python
- Supported Output Formats
- Conclusion
- FAQs
Why Convert HTML to Word Format
HTML is ideal for online content delivery, but Word documents offer significant advantages for use cases that require formatting, annotation, printing, or offline access:
- Offline Access: View and edit documents without an internet connection.
- Advanced Editing: Enable features like tracked changes, comments, and section formatting.
- Professional Presentation: Suitable for formal reports, business contracts, user manuals, and documentation.
- Cross-Platform Compatibility: Open and edit using Microsoft Word, Google Docs, LibreOffice, and other word processors.
Install HTML to Word Converter in Python
Spire.Doc for Python is a feature-rich library designed to help developers create, read, convert, and manipulate Word documents directly within Python applications. It offers high-fidelity conversion of HTML content to Word format while preserving the original structure and styles.
Key Benefits
- Fully preserves original HTML structure, CSS styles, and layout
- Accepts both HTML files and HTML strings as input sources
- Supports conversion to .doc, .docx, and other formats
- 100% standalone; no Office automation needed
Installation
You can install the library from PyPI using the following pip command:
pip install spire.doc
Export HTML Files to Word Documents in Python
If you already have an HTML file—such as a saved webpage or generated HTML report—you can save it to a Word document with just a few lines of code.
Code Example
from spire.doc import *
from spire.doc.common import *

# Specify the input and output file paths
inputFile = "Input.html"
outputFile = "HtmlToWord.docx"

# Create an object of the Document class
document = Document()
# Load an HTML file
document.LoadFromFile(inputFile, FileFormat.Html, XHTMLValidationType.none)

# Save the HTML file to a .docx file
document.SaveToFile(outputFile, FileFormat.Docx2016)
document.Close()
Explanation:
This example demonstrates how to load an existing .html file and save it to a Word .docx document:
- Document(): creates a new Word document object.
- LoadFromFile(): loads the HTML file and parses it as an HTML document.
- XHTMLValidationType.none: disables strict validation of the HTML content.
- SaveToFile(): saves the result as a .docx file using the FileFormat.Docx2016 format.
To export as .doc, replace FileFormat.Docx2016 with FileFormat.Doc.
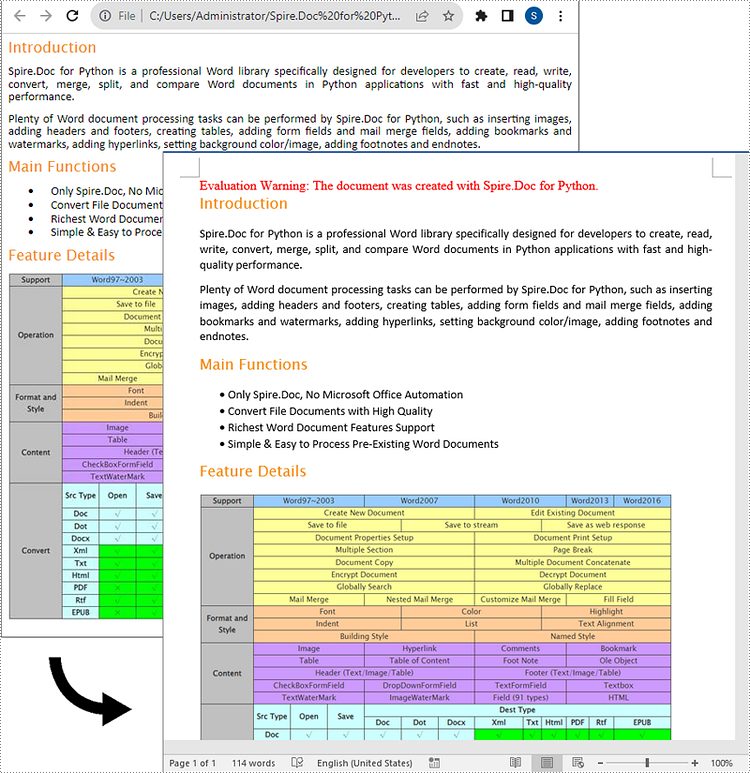
Output:
Here is the Word document generated from the HTML file:
Insert HTML Strings into Word Documents in Python
Sometimes, you may have HTML content as a string—perhaps scraped from the web or dynamically generated. Spire.Doc allows you to insert such HTML content into a Word document without saving it as a file first.
Code Example
from spire.doc import *
from spire.doc.common import *

# Specify the output file path
outputFile = "HtmlStringToWord.docx"

# Create an object of the Document class
document = Document()
# Add a section to the document
sec = document.AddSection()

# Add a paragraph to the section
paragraph = sec.AddParagraph()

# Specify the HTML string
htmlString = """
<html>
<head>
    <title>HTML to Word Example</title>
    <style>
        body {
            font-family: Arial, sans-serif;
        }
        h1 {
            color: #FF5733;
            font-size: 24px;
            margin-bottom: 20px;
        }
        p {
            color: #333333;
            font-size: 16px;
            margin-bottom: 10px;
        }
        ul {
            list-style-type: disc;
            margin-left: 20px;
            margin-bottom: 15px;
        }
        li {
            font-size: 14px;
            margin-bottom: 5px;
        }
        table {
            border-collapse: collapse;
            width: 100%;
            margin-bottom: 20px;
        }
        th, td {
            border: 1px solid #CCCCCC;
            padding: 8px;
            text-align: left;
        }
        th {
            background-color: #F2F2F2;
            font-weight: bold;
        }
        td {
            color: #0000FF;
        }
    </style>
</head>
<body>
    <h1>This is a Heading</h1>
    <p>This is a paragraph demonstrating the conversion of HTML to Word document.</p>
    <p>Here's an example of an unordered list:</p>
    <ul>
        <li>Item 1</li>
        <li>Item 2</li>
        <li>Item 3</li>
    </ul>
    <p>And here's a table:</p>
    <table>
        <tr>
            <th>Product</th>
            <th>Quantity</th>
            <th>Price</th>
        </tr>
        <tr>
            <td>Jacket</td>
            <td>30</td>
            <td>$150</td>
        </tr>
        <tr>
            <td>Sweater</td>
            <td>25</td>
            <td>$99</td>
        </tr>
    </table>
</body>
</html>
"""

# Append the HTML string to the paragraph
paragraph.AppendHTML(htmlString)

# Save the result document
document.SaveToFile(outputFile, FileFormat.Docx2016)
document.Close()
Explanation:
This code converts an HTML string directly into Word content:
- Document(): creates a new document.
- AddSection() and AddParagraph(): adds a section and paragraph to hold the content.
- AppendHTML(): parses and inserts the HTML string into the paragraph, preserving styles and structure.
- SaveToFile(): saves the document to a .docx file using the FileFormat.Docx2016 format.
This approach is ideal for use cases like email-to-Word, content pulled from CMS platforms, or HTML snippets generated dynamically at runtime.
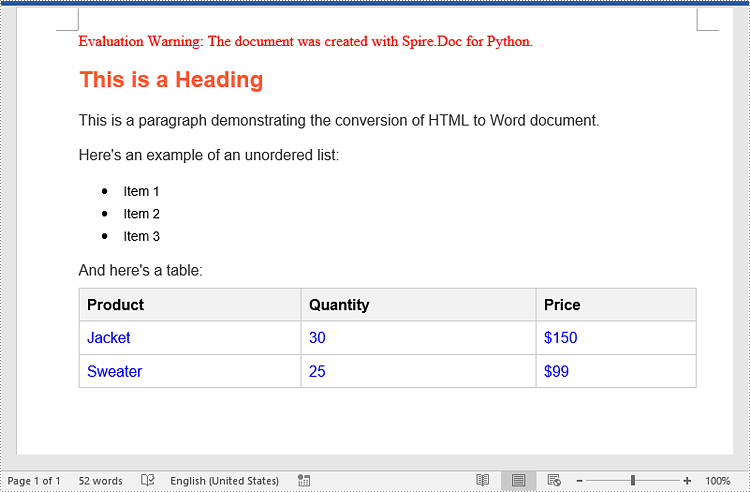
Output:
Here is the Word document generated from the HTML string:
Supported Output Formats
With Spire.Doc for Python, you’re not limited to Word output. You can also convert HTML to various formats, including:
- Image: .png, .jpg, .bmp
- Rich Text: .rtf
- Other: .xml, .xps, .epub, etc.
Conclusion
Spire.Doc for Python provides a powerful solution for developers looking to convert HTML to Word documents with precision and efficiency. Whether you’re working with HTML files or strings, the library simplifies the process while maintaining the integrity of your content.
Give Spire.Doc a try today and see how effortlessly you can add professional document generation to your Python projects!
FAQs
Q1: Can I convert HTML to Word without installing Microsoft Word?
A1: Yes. Spire.Doc is a standalone component and does not require Word or Office on the machine.
Q2: Are CSS styles and tables preserved?
A2: Yes. The library retains CSS styles, tables, images, lists, fonts, and layout formatting.
Q3: Can I batch-convert multiple HTML files to Word?
A3: Absolutely. You can loop through folders and apply the same conversion logic to each file.
Q4: What other formats can I export HTML to?
A4: HTML can be converted to .doc, .docx, .pdf, image formats, .rtf, .xml, and more.
Q5: Is there a trial license?
A5: Yes. you can request a 30-day trial license for full functionality.
A hyperlink is a clickable element, usually embedded in text or an image. It can direct users from their current location to a specific location on another web page or document. By adding hyperlinks in PowerPoint presentations, users can easily visit other related pages or slides while presenting slides. In this article, we will demonstrate how to add hyperlinks to PowerPoint presentations in Python using Spire.Presentation for Python.
Install Spire.Presentation for Python
This scenario requires Spire.Presentation for Python and plum-dispatch v1.7.4. They can be easily installed in your Windows through the following pip command.
pip install Spire.Presentation
If you are unsure how to install, please refer to this tutorial: How to Install Spire.Presentation for Python on Windows
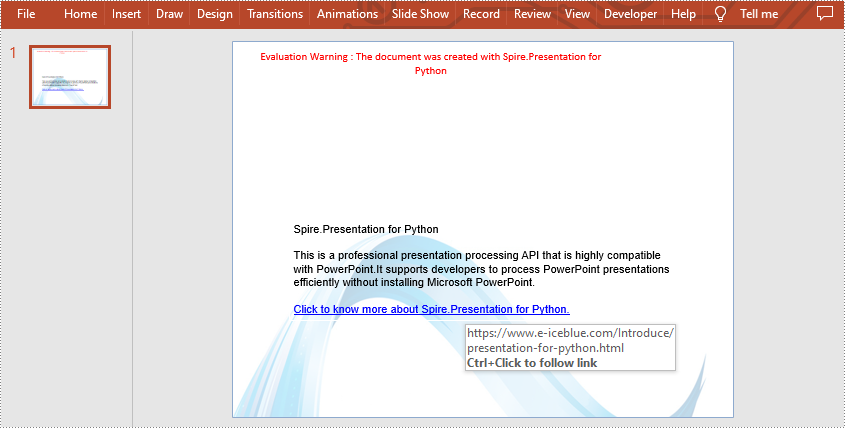
Add Hyperlink to Text on Slide in Python
Spire.Presentation for Python allows users to insert hyperlinks to text on slides easily by using TextRange.ClickAction.Address property. The following are detailed steps.
- Create a new PowerPoint presentation.
- Set the background for the first slide of the presentation by using Presentation.Slides[].Shapes.AppendEmbedImageByPath() method.
- Add a new shape to this slide using Presentation.Slides[].Shapes.AppendShape() method.
- Add some paragraphs to it by calling TextParagraph.TextRanges.Append() method.
- Create another TextRange instance to represent a text range and set link address for it by TextRange.ClickAction.Address property.
- Set the font for these paragraphs.
- Save the result file using Presentation.SaveToFile() method.
- Python
from spire.presentation.common import *
from spire.presentation import *
import math

outputFile = "C:/Users/Administrator/Desktop/AddHyperlinkToText.pptx"

#Create a new PowerPoint presentation
presentation = Presentation()

#Set the background for the first slide
ImageFile = "C:/Users/Administrator/Desktop/background.png"
rect = RectangleF.FromLTRB (0, 0, presentation.SlideSize.Size.Width, presentation.SlideSize.Size.Height)
presentation.Slides[0].Shapes.AppendEmbedImageByPath (ShapeType.Rectangle, ImageFile, rect)

#Add a new shape to the first slide
shape = presentation.Slides[0].Shapes.AppendShape(ShapeType.Rectangle, RectangleF.FromLTRB (80, 250, 650, 400))
shape.Fill.FillType = FillFormatType.none
shape.ShapeStyle.LineColor.Color = Color.get_White()

#Add some paragraphs to the shape
para1 = TextParagraph()
tr = TextRange("Spire.Presentation for Python")
tr.Fill.FillType = FillFormatType.Solid
tr.Fill.SolidColor.Color = Color.get_Black()
para1.TextRanges.Append(tr)
para1.Alignment = TextAlignmentType.Left
shape.TextFrame.Paragraphs.Append(para1)
shape.TextFrame.Paragraphs.Append(TextParagraph())

para2 = TextParagraph()
tr1 = TextRange("This is a professional presentation processing API that is highly compatible with PowerPoint."
                +"It supports developers to process PowerPoint presentations efficiently without installing Microsoft PowerPoint.")
tr1.Fill.FillType = FillFormatType.Solid
tr1.Fill.SolidColor.Color = Color.get_Black()
para2.TextRanges.Append(tr1)
shape.TextFrame.Paragraphs.Append(para2)
shape.TextFrame.Paragraphs.Append(TextParagraph())

#Add text with a hyperlink
para3 = TextParagraph()
tr2 = TextRange("Click to know more about Spire.Presentation for Python.")
tr2.ClickAction.Address = "https://www.e-iceblue.com/Introduce/presentation-for-python.html"
para3.TextRanges.Append(tr2)
shape.TextFrame.Paragraphs.Append(para3)
shape.TextFrame.Paragraphs.Append(TextParagraph())

#Set the font for those paragraphs
for para in shape.TextFrame.Paragraphs:
    if len(para.Text) != 0:
        para.TextRanges[0].LatinFont = TextFont("Arial")
        para.TextRanges[0].FontHeight = 16

#Save the result file
presentation.SaveToFile(outputFile, FileFormat.Pptx2010)
presentation.Dispose()
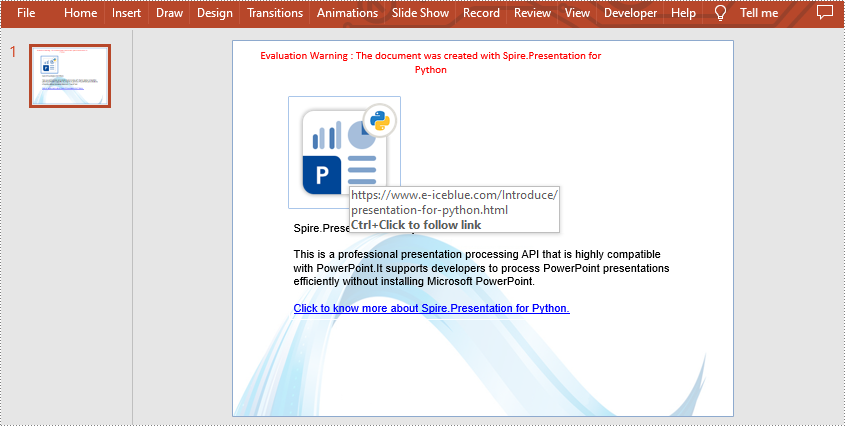
Add Hyperlink to Image on Slide in Python
Spire.Presentation for Python also supports adding a hyperlink to an image. You can create a hyperlink by ClickHyperlink class and then add it to the image using the IEmbedImage.Click property. The related steps are as follows.
- Create a new PowerPoint presentation.
- Load a PowerPoint file using Presentation.LoadFromFile() method.
- Get the first slide by using Presentation.Slides[] property.
- Add an image to this slide using ISlide.Shapes.AppendEmbedImageByPath() method.
- Create a ClickHyperlink object and append the hyperlink to the added image using IEmbedImage.Click property.
- Save the result file using Presentation.SaveToFile() method.
- Python
from spire.presentation.common import *
from spire.presentation import *

inputFile = "C:/Users/Administrator/Desktop/AddHyperlinkToText.pptx"
outputFile = "C:/Users/Administrator/Desktop/AddHyperlinkToImage.pptx"

#Create a new PowerPoint presentation
presentation = Presentation()

#Load a sample file from disk
presentation.LoadFromFile(inputFile)

#Get the first slide
slide = presentation.Slides[0]

#Add an image to this slide
rect = RectangleF.FromLTRB (80, 80, 240, 240)
image = slide.Shapes.AppendEmbedImageByPath (ShapeType.Rectangle, "image.png", rect)

#Add a hyperlink to the image
hyperlink = ClickHyperlink("https://www.e-iceblue.com/Introduce/presentation-for-python.html")
image.Click = hyperlink

#Save the result file
presentation.SaveToFile(outputFile, FileFormat.Pptx2013)
presentation.Dispose()
Apply for a Temporary License
If you'd like to remove the evaluation message from the generated documents, or to get rid of the function limitations, please request a 30-day trial license for yourself.
