
Knowledgebase (2417)
Children categories
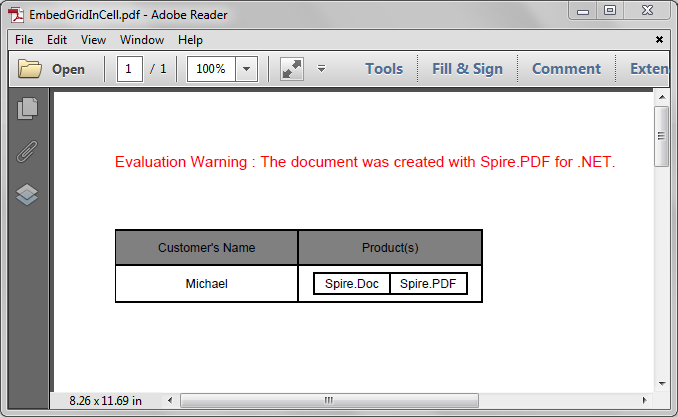
Spire.PDF supports to embed image and grid into a grid cell. We've introduced how to embed an image into a grid cell in the article - How to Insert an Image to PDF Grid Cell in C#, this article is going to show you how to embed a grid into a grid cell in PDF using Spire.PDF.
Detail steps:
Step 1: Create a PDF document and add a page to it.
PdfDocument pdf = new PdfDocument();
PdfPageBase page = pdf.Pages.Add();
Step 2: Create a PDF grid.
//Create a grid
PdfGrid grid = new PdfGrid();

//Add two rows
PdfGridRow row1 = grid.Rows.Add();
PdfGridRow row2 = grid.Rows.Add();

//Set the Top and Bottom cell padding
grid.Style.CellPadding.Top = 5f;
grid.Style.CellPadding.Bottom = 5f;

//Add two columns
grid.Columns.Add(2);

//Set columns' width
grid.Columns[0].Width = 120f;
grid.Columns[1].Width = 120f;
Step 3: Create another PDF grid to embed.
//Create another grid
PdfGrid embedGrid = new PdfGrid();

//Add a row
PdfGridRow newRow = embedGrid.Rows.Add();

//Add two columns
embedGrid.Columns.Add(2);

//Set columns' width
embedGrid.Columns[0].Width = 50f;
embedGrid.Columns[1].Width = 50f;
Step 4: Assign values to the cells of the embed grid and the grid, and set formatting.
//Create a PDFStringFormat instance
PdfStringFormat stringFormat = new PdfStringFormat(PdfTextAlignment.Center, PdfVerticalAlignment.Middle);

//Assign values to the cells of the embedGrid and set formatting
newRow.Cells[0].Value = "Spire.Doc";
newRow.Cells[0].StringFormat = stringFormat;
newRow.Cells[1].Value = "Spire.PDF";
newRow.Cells[1].StringFormat = stringFormat;

//Assign values to the cells of the grid and set formatting
row1.Cells[0].Value = "Customer's Name";
row1.Cells[0].StringFormat = stringFormat;
row1.Cells[0].Style.BackgroundBrush = PdfBrushes.Gray;
row1.Cells[1].Value = "Product(s)";
row1.Cells[1].StringFormat = stringFormat;
row1.Cells[1].Style.BackgroundBrush = PdfBrushes.Gray;
row2.Cells[0].Value = "Michael";
row2.Cells[0].StringFormat = stringFormat;
//Assign the embedGrid to a cell of the grid
row2.Cells[1].Value = embedGrid;
row2.Cells[1].StringFormat = stringFormat;
Step 5: Draw the grid to the new added page.
grid.Draw(page, new PointF(0f, 50f));
Step 6: Save the document.
pdf.SaveToFile("EmbedGridInCell.pdf");
Screenshot:
Full code:
using Spire.Pdf.Grid;
using Spire.Pdf;
using System.Drawing;
using Spire.Pdf.Graphics;

namespace Embed_a_Grid_in_a_Grid_Cell_in_PDF
{
    class Program
    {
        static void Main(string[] args)
        {
            //Create a pdf document
            PdfDocument pdf = new PdfDocument();

            //Add a page
            PdfPageBase page = pdf.Pages.Add();

            //Create a pdf grid
            PdfGrid grid = new PdfGrid();

            //Add two rows
            PdfGridRow row1 = grid.Rows.Add();
            PdfGridRow row2 = grid.Rows.Add();

            //Set Top and Bottom cell padding of the grid
            grid.Style.CellPadding.Top = 5f;
            grid.Style.CellPadding.Bottom = 5f;

            //Add two columns
            grid.Columns.Add(2);

            //Set the columns’ width
            grid.Columns[0].Width = 120f;
            grid.Columns[1].Width = 120f;


            //Create another grid to embed
            PdfGrid embedGrid = new PdfGrid();

            //Add a row
            PdfGridRow newRow = embedGrid.Rows.Add();

            //Add two columns
            embedGrid.Columns.Add(2);

            //Set the columns’ width
            embedGrid.Columns[0].Width = 50f;
            embedGrid.Columns[1].Width = 50f;

            //Create a PDFStringFormat instance
            PdfStringFormat stringFormat = new PdfStringFormat(PdfTextAlignment.Center, PdfVerticalAlignment.Middle);

            //Assign values to the cells of the embedGrid and set formatting
            newRow.Cells[0].Value = "Spire.Doc";
            newRow.Cells[0].StringFormat = stringFormat;
            newRow.Cells[1].Value = "Spire.PDF";
            newRow.Cells[1].StringFormat = stringFormat;

            //Assign values to the cells of the grid and set formatting
            row1.Cells[0].Value = "Customer's Name";
            row1.Cells[0].StringFormat = stringFormat;
            row1.Cells[0].Style.BackgroundBrush = PdfBrushes.Gray;
            row1.Cells[1].Value = "Product(s)";
            row1.Cells[1].StringFormat = stringFormat;
            row1.Cells[1].Style.BackgroundBrush = PdfBrushes.Gray;
            row2.Cells[0].Value = "Michael";
            row2.Cells[0].StringFormat = stringFormat;
            //Assign the embedGrid to the cell of the grid
            row2.Cells[1].Value = embedGrid;
            row2.Cells[1].StringFormat = stringFormat;

            //Draw the grid to the new added page
            grid.Draw(page, new PointF(0f, 50f));

            //Save the pdf document
            pdf.SaveToFile("EmbedGridInCell.pdf");
        }
    }
}
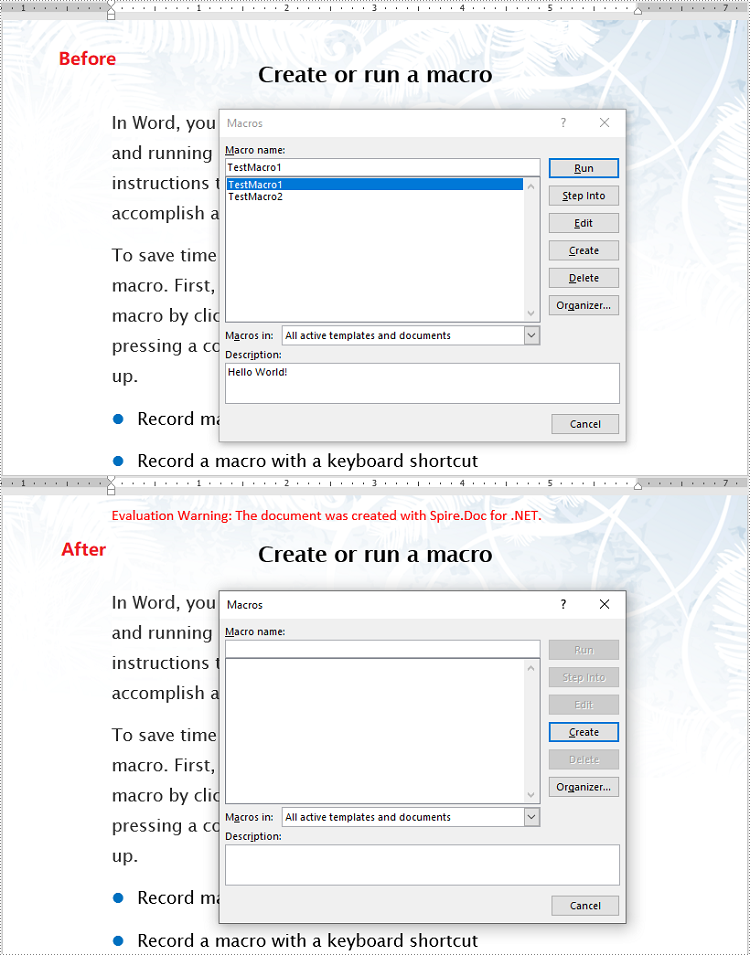
VBA (Visual Basic for Applications) macros are small programs that can be embedded within Microsoft Word documents to automate repetitive tasks, add interactivity to documents, and perform other useful functions. While macros can be beneficial in many situations, they can also pose a security risk if the code is malicious or contains malware. By removing VBA macros from Word documents, you can reduce the risk of security breaches and malware infections. In this article, you will learn how to detect and remove VBA macros from Word documents in C# and VB.NET using Spire.Doc for .NET library.
Install Spire.Doc for .NET
To begin with, you need to add the DLL files included in the Spire.Doc for .NET package as references in your .NET project. The DLL files can be either downloaded from this link or installed via NuGet.
PM> Install-Package Spire.Doc
Detect and Remove VBA Macros from Word Documents in C# and VB.NET
You can use the Document.IsContainMacro property to detect whether a Word document contains VBA macros. If any macros are detected, you can use the Document.ClearMacros() method to easily remove them from the document.
The following steps show how to detect and remove VBA macros from a Word document using Spire.Doc for .NET:
- Initialize an instance of the Document class.
- Load a Word document using the Document.LoadFromFile(string fileName) method.
- Detect if the document contains VBA macros using the Document.IsContainMacro property.
- If any macros are detected, remove them from the document using Document.ClearMacros() method.
- Save the result document using Document.SaveToFile(string fileName, FileFormat fileFormat) method.
- C#
- VB.NET
using Spire.Doc;

namespace RemoveVBAMacros
{
    internal class Program
    {
        static void Main(string[] args)
        {
            //Initialize an instance of the Document class
            Document document = new Document();
            //Load a Word document
            document.LoadFromFile("Input.docm");

            //Detect if the document contains macros
            if (document.IsContainMacro)
            {
                //Remove the macros from the document
                document.ClearMacros();
            }

            //Save the result document
            document.SaveToFile("RemoveMacros.docm", FileFormat.Docm);
            document.Close();
        }
    }
}
Apply for a Temporary License
If you'd like to remove the evaluation message from the generated documents, or to get rid of the function limitations, please request a 30-day trial license for yourself.
Vary the Colors of Same-series Data Markers in a Chart in C#, VB.NET
2018-06-12 06:38:00 Written by KoohjiIf you have a line, (xy) scatter, or radar chart, you can change the look of the data markers to make them easier to distinguish. In this article, you will learn how to set different colors for different data markers, by using Spire.Presentation with C# and VB.NET.
Step 1: Load a sample PowerPoint file.
Presentation ppt = new Presentation();
ppt.LoadFromFile("ScatterChart.pptx");
Step 2: Get the chart from the presentation.
IChart chart = ppt.Slides[0].Shapes[0] as IChart;
Step 3: Create a ChartDataPoint object and specify the index.
ChartDataPoint dataPoint = new ChartDataPoint(chart.Series[0]);
dataPoint.Index = 0;
Step 4: Set the fill color of the data marker.
dataPoint.MarkerFill.Fill.FillType = FillFormatType.Solid;
dataPoint.MarkerFill.Fill.SolidColor.Color = Color.Red;
Step 5: Set the line color of the data marker.
dataPoint.MarkerFill.Line.FillType = FillFormatType.Solid;
dataPoint.MarkerFill.Line.SolidFillColor.Color = Color.Red;
Step 6: Add the data point to the point collection of a series.
chart.Series[0].DataPoints.Add(dataPoint);
Step 7: Save to file.
ppt.SaveToFile("result.pptx", FileFormat.Pptx2010);
Source File:

Result:

Full Code:
Presentation ppt = new Presentation();
ppt.LoadFromFile("ScatterChart.pptx");
IChart chart = ppt.Slides[0].Shapes[0] as IChart;

ChartDataPoint dataPoint = new ChartDataPoint(chart.Series[0]);
dataPoint.Index = 0;
dataPoint.MarkerFill.Fill.FillType = FillFormatType.Solid;
dataPoint.MarkerFill.Fill.SolidColor.Color = Color.Red;
dataPoint.MarkerFill.Line.FillType = FillFormatType.Solid;
dataPoint.MarkerFill.Line.SolidFillColor.Color = Color.Red;
chart.Series[0].DataPoints.Add(dataPoint);

dataPoint = new ChartDataPoint(chart.Series[0]);
dataPoint.Index = 1;
dataPoint.MarkerFill.Fill.FillType = FillFormatType.Solid;
dataPoint.MarkerFill.Fill.SolidColor.Color = Color.Yellow;
dataPoint.MarkerFill.Line.FillType = FillFormatType.Solid;
dataPoint.MarkerFill.Line.SolidFillColor.Color = Color.Yellow;
chart.Series[0].DataPoints.Add(dataPoint);

dataPoint = new ChartDataPoint(chart.Series[0]);
dataPoint.Index = 2;
dataPoint.MarkerFill.Fill.FillType = FillFormatType.Solid;
dataPoint.MarkerFill.Fill.SolidColor.Color = Color.Blue;
dataPoint.MarkerFill.Line.FillType = FillFormatType.Solid;
dataPoint.MarkerFill.Line.SolidFillColor.Color = Color.Blue;
chart.Series[0].DataPoints.Add(dataPoint);

ppt.SaveToFile("result.pptx", FileFormat.Pptx2010);
using Spire.Presentation;
using Spire.Presentation.Charts;
using Spire.Presentation.Drawing;
using System.Drawing;

namespace VaryColor
{
    class Program
    {
        static void Main(string[] args)
        {
            Presentation ppt = new Presentation();
            ppt.LoadFromFile("ScatterChart.pptx");
            IChart chart = ppt.Slides[0].Shapes[0] as IChart;

            ChartDataPoint dataPoint = new ChartDataPoint(chart.Series[0]);
            dataPoint.Index = 0;
            dataPoint.MarkerFill.Fill.FillType = FillFormatType.Solid;
            dataPoint.MarkerFill.Fill.SolidColor.Color = Color.Red;
            dataPoint.MarkerFill.Line.FillType = FillFormatType.Solid;
            dataPoint.MarkerFill.Line.SolidFillColor.Color = Color.Red;
            chart.Series[0].DataPoints.Add(dataPoint);

            dataPoint = new ChartDataPoint(chart.Series[0]);
            dataPoint.Index = 1;
            dataPoint.MarkerFill.Fill.FillType = FillFormatType.Solid;
            dataPoint.MarkerFill.Fill.SolidColor.Color = Color.Yellow;
            dataPoint.MarkerFill.Line.FillType = FillFormatType.Solid;
            dataPoint.MarkerFill.Line.SolidFillColor.Color = Color.Yellow;
            chart.Series[0].DataPoints.Add(dataPoint);

            dataPoint = new ChartDataPoint(chart.Series[0]);
            dataPoint.Index = 2;
            dataPoint.MarkerFill.Fill.FillType = FillFormatType.Solid;
            dataPoint.MarkerFill.Fill.SolidColor.Color = Color.Blue;
            dataPoint.MarkerFill.Line.FillType = FillFormatType.Solid;
            dataPoint.MarkerFill.Line.SolidFillColor.Color = Color.Blue;
            chart.Series[0].DataPoints.Add(dataPoint);

            ppt.SaveToFile("result.pptx", FileFormat.Pptx2010);
        }
    }
}
