
Knowledgebase (2417)
Children categories
When creating chart, the legend appears by default. If we just need the chart series rather than the legend, we can delete the legend entries after creating the chart. Spire.Presentation supports to delete legend entries from chart by using ChartLegend.DeleteEntry method. This article is going to demonstrate how we can use Spire.Presentation to accomplish this function.
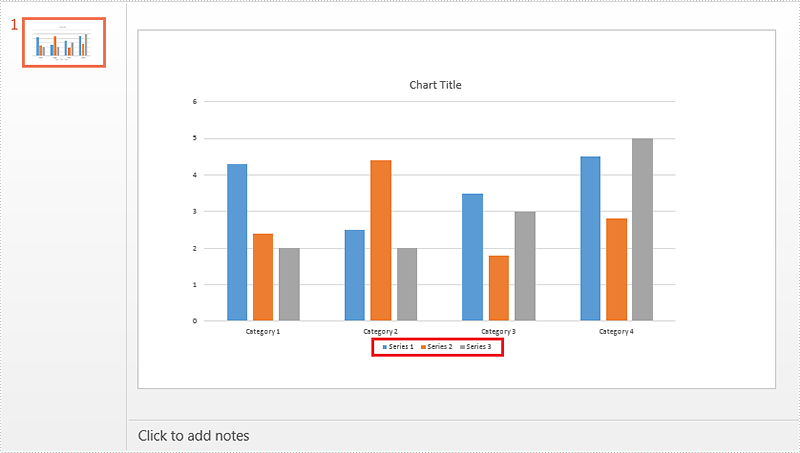
Below screenshot shows the example PowerPoint file which contains 3 chart legend entries:
Detail steps:
Step 1: Initialize an object of Presentation class and load the PowerPoint file.
Presentation ppt = new Presentation();
ppt.LoadFromFile("Input.pptx");
Step 2: Get the chart.
IChart chart = ppt.Slides[0].Shapes[0] as IChart;
Step 3: Delete the first and the second legend entries from the chart.
chart.ChartLegend.DeleteEntry(0);
chart.ChartLegend.DeleteEntry(1);
Step 4: Save the file.
ppt.SaveToFile("Output.pptx", FileFormat.Pptx2010);
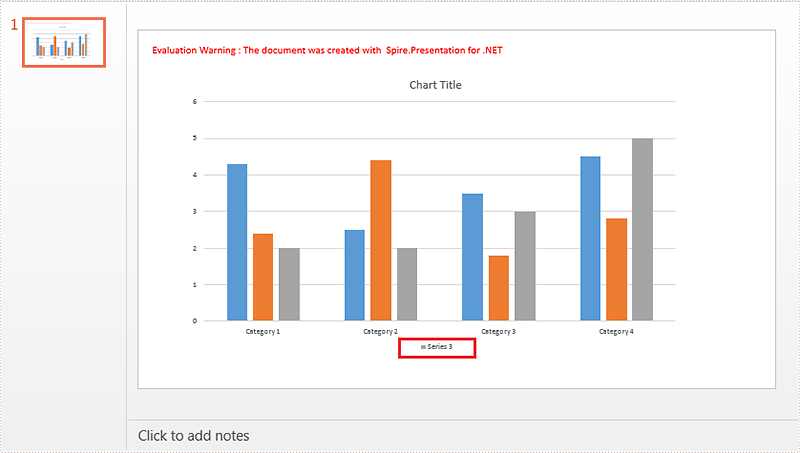
Screenshot:
Full code:
using Spire.Presentation;
using Spire.Presentation.Charts;

namespace Delete_chart_legend_entries_in_PPT
{
    class Program
    {
        static void Main(string[] args)
        {
            Presentation ppt = new Presentation();
            ppt.LoadFromFile("Input.pptx");

            IChart chart = ppt.Slides[0].Shapes[0] as IChart;

            chart.ChartLegend.DeleteEntry(0);
            chart.ChartLegend.DeleteEntry(1);

            ppt.SaveToFile("Output.pptx", FileFormat.Pptx2010);
        }
    }
}
Group Two-Level Axis Labels in a Chart in PowerPoint in C#, VB.NET
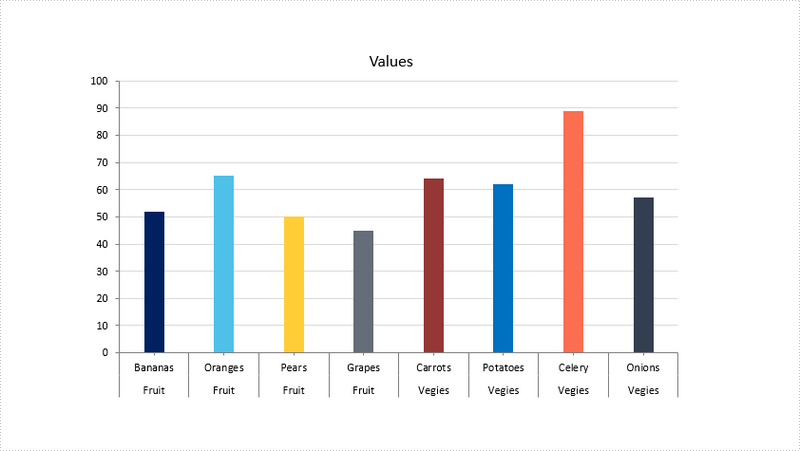
2018-03-07 06:41:56 Written by KoohjiSometimes, you may have a chart that contains two levels of horizontal axis labels, as shown in the following screenshot, and you need to group the labels by fruit and vegies. This article will show you how to group the category axis labels using Spire.Presentation.
Step 1: Create a Presentation instance and load the sample PowerPoint file.
Presentation ppt = new Presentation();
ppt.LoadFromFile("chart.pptx");
Step 2: Get the chart.
IChart chart = ppt.Slides[0].Shapes[0] as IChart;
Step 3: Get the category axis from the chart.
IChartAxis chartAxis = chart.PrimaryCategoryAxis;
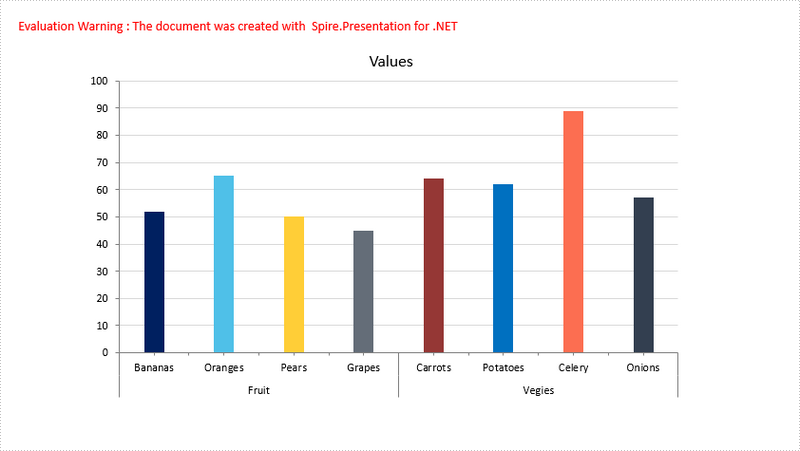
Step 4: Determine if the axis has multilevel labels, if yes, group the axis labels that have the same first-level label.
if(chartAxis.HasMultiLvlLbl)
{
    chartAxis.IsMergeSameLabel = true;
}
Step 5: Save the file.
ppt.SaveToFile("result.pptx", FileFormat.Pptx2010);
Output:
Full Code:
using Spire.Presentation;
using Spire.Presentation.Charts;

namespace GroupLabel
{
    class Program
    {
        static void Main(string[] args)
        {
            Presentation ppt = new Presentation();
            ppt.LoadFromFile("chart.pptx");
            IChart chart = ppt.Slides[0].Shapes[0] as IChart;
            IChartAxis chartAxis = chart.PrimaryCategoryAxis;
            if (chartAxis.HasMultiLvlLbl)
            {
                //group labels
                chartAxis.IsMergeSameLabel = true;
            }
            ppt.SaveToFile("result.pptx", FileFormat.Pptx2010);
        }
    }
}
Imports Spire.Presentation
Imports Spire.Presentation.Charts

Namespace GroupLabel
	Class Program
		Private Shared Sub Main(args As String())
			Dim ppt As New Presentation()
			ppt.LoadFromFile("chart.pptx")
			Dim chart As IChart = TryCast(ppt.Slides(0).Shapes(0), IChart)
			Dim chartAxis As IChartAxis = chart.PrimaryCategoryAxis
			If chartAxis.HasMultiLvlLbl Then
				'group labels
				chartAxis.IsMergeSameLabel = True
			End If
			ppt.SaveToFile("result.pptx", FileFormat.Pptx2010)
		End Sub
	End Class
End Namespace
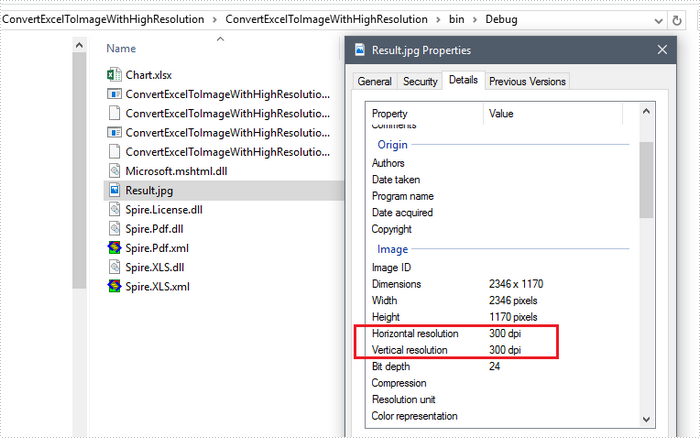
Sometimes, you may want to convert Excel sheet to a high-resolution image, especially when the Excel report contains graphs or pictures. This article will show you how to set image resolution when saving Excel sheet to JPG using Spire.XLS.
Step 1: Create a custom function that you can use to reset the image resolution.
private static Bitmap ResetResolution(Metafile mf, float resolution)
{
    int width = (int)(mf.Width * resolution / mf.HorizontalResolution);
    int height = (int)(mf.Height * resolution / mf.VerticalResolution);
    Bitmap bmp = new Bitmap(width, height);
    bmp.SetResolution(resolution, resolution);
    Graphics g = Graphics.FromImage(bmp);
    g.DrawImage(mf, 0, 0);
    g.Dispose();
    return bmp;
}
Step 2: Create a workbook instance and load the sample Excel file.
Workbook workbook = new Workbook();
workbook.LoadFromFile("Chart.xlsx",ExcelVersion.Version2013);
Step 3: Get the worksheet you want to convert.
Worksheet worksheet = workbook.Worksheets[0];
Step 4: Convert the worksheet to EMF stream.
MemoryStream ms = new MemoryStream();
worksheet.ToEMFStream(ms, 1, 1, worksheet.LastRow, worksheet.LastColumn);
Step 5: Create an image from the EMF stream, and call ResetResolution to reset the resolution for the image.
Image image = Image.FromStream(ms);
Bitmap images = ResetResolution(image as Metafile, 300);
Step 6: Save the image in JPG file format.
images.Save("Result.jpg", ImageFormat.Jpeg);
Output:
Full Code:
using Spire.Xls;
using System.Drawing;
using System.Drawing.Imaging;
using System.IO;
namespace Convert
{
    class Program
    {
        static void Main(string[] args)
        {
            Workbook workbook = new Workbook();
            workbook.LoadFromFile("Chart.xlsx", ExcelVersion.Version2013);
            Worksheet worksheet = workbook.Worksheets[0];

            using (MemoryStream ms = new MemoryStream())
            {

                worksheet.ToEMFStream(ms, 1, 1, worksheet.LastRow, worksheet.LastColumn);
                Image image = Image.FromStream(ms);
                Bitmap images = ResetResolution(image as Metafile, 300);
                images.Save("Result.jpg", ImageFormat.Jpeg);
            }
        }
        private static Bitmap ResetResolution(Metafile mf, float resolution)
        {
            int width = (int)(mf.Width * resolution / mf.HorizontalResolution);
            int height = (int)(mf.Height * resolution / mf.VerticalResolution);
            Bitmap bmp = new Bitmap(width, height);
            bmp.SetResolution(resolution, resolution);
            Graphics g = Graphics.FromImage(bmp);
            g.DrawImage(mf, 0, 0);
            g.Dispose();
            return bmp;
        }
    }
}
Imports Spire.Xls
Imports System.Drawing
Imports System.Drawing.Imaging
Imports System.IO
Namespace Convert
	Class Program
		Private Shared Sub Main(args As String())
			Dim workbook As New Workbook()
			workbook.LoadFromFile("Chart.xlsx", ExcelVersion.Version2013)
			Dim worksheet As Worksheet = workbook.Worksheets(0)

			Using ms As New MemoryStream()

				worksheet.ToEMFStream(ms, 1, 1, worksheet.LastRow, worksheet.LastColumn)
				Dim image__1 As Image = Image.FromStream(ms)
				Dim images As Bitmap = ResetResolution(TryCast(image__1, Metafile), 300)
				images.Save("Result.jpg", ImageFormat.Jpeg)
			End Using
		End Sub
		Private Shared Function ResetResolution(mf As Metafile, resolution As Single) As Bitmap
			Dim width As Integer = CInt(mf.Width * resolution / mf.HorizontalResolution)
			Dim height As Integer = CInt(mf.Height * resolution / mf.VerticalResolution)
			Dim bmp As New Bitmap(width, height)
			bmp.SetResolution(resolution, resolution)
			Dim g As Graphics = Graphics.FromImage(bmp)
			g.DrawImage(mf, 0, 0)
			g.Dispose()
			Return bmp
		End Function
	End Class
End Namespace
