
Knowledgebase (2417)
Children categories
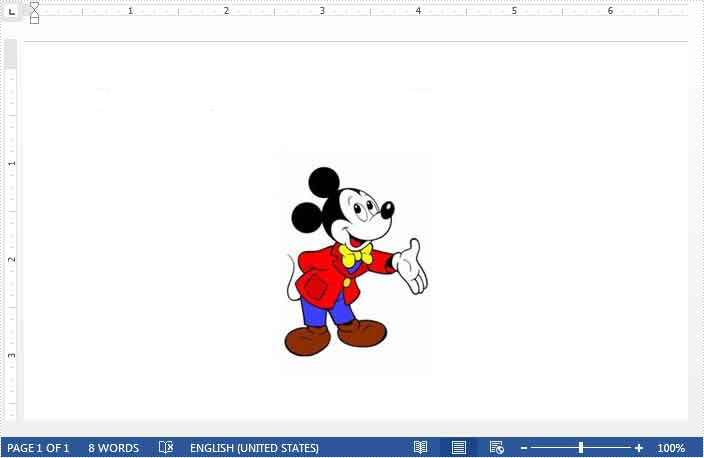
We often need to resize images to a desired size after we insert them into a Word document. This article demonstrates how to programmatically resize images in a Word document using Spire.Doc and C#.
Below is the screenshot of the example document we used for demonstration:
Detail steps:
Step 1: Load the Word document.
Document document = new Document("Input.docx");
Step 2: Get the first section and the first paragraph in the section.
Section section = document.Sections[0];
Paragraph paragraph = section.Paragraphs[0];
Step 3: Resize images in the paragraph.
foreach (DocumentObject docObj in paragraph.ChildObjects)
{
    if (docObj is DocPicture)
    {
        DocPicture picture = docObj as DocPicture;
        picture.Width = 50f;
        picture.Height = 50f;
    }
}
Step 4: Save the document.
document.SaveToFile("ResizeImages.docx");
Output:

Full code:
using Spire.Doc;
using Spire.Doc.Documents;
using Spire.Doc.Fields;
namespace Resize
{
    class Program
    {
        static void Main(string[] args)
        {
            Document document = new Document("Input.docx");
            Section section = document.Sections[0];
            Paragraph paragraph = section.Paragraphs[0];

            foreach (DocumentObject docObj in paragraph.ChildObjects)
            {
                if (docObj is DocPicture)
                {
                    DocPicture picture = docObj as DocPicture;
                    picture.Width = 50f;
                    picture.Height = 50f;
                }
            }
            document.SaveToFile("ResizeImages.docx");
        }
    }
}
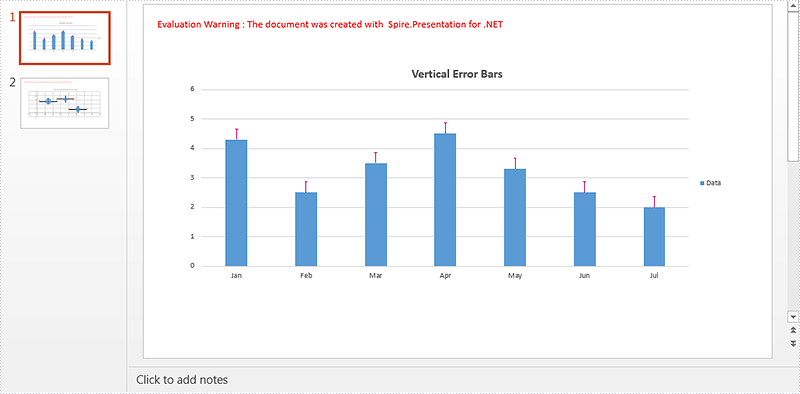
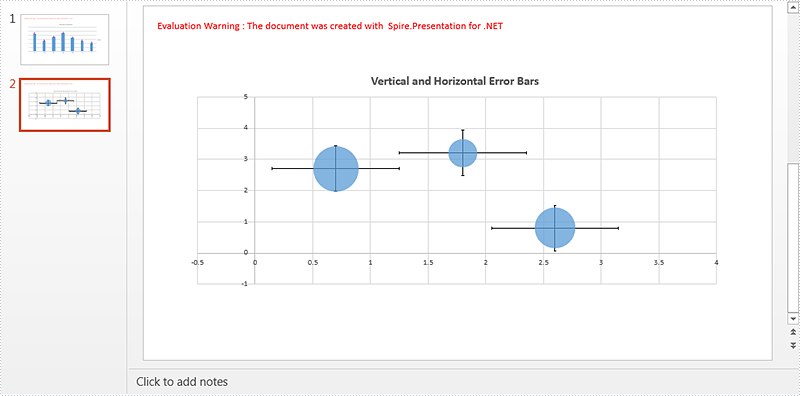
Error bars in charts can help us to see margins of error and standard deviations at a glance. We can use error bars in area, bar, column, line, and XY charts. In XY charts i.e. scatter and bubble charts, we can show X (Horizontal) and Y (Vertical) error bars. However if the chart type is not XY, the error bars for X values are disabled.
This article demonstrates how to add and format error bars for non-XY and XY charts in a PowerPoint document using Spire.Presentation and C#.
Detail steps:
Step 1: Initialize an object of Presentation class and load the PowerPoint document.
Presentation ppt = new Presentation();
ppt.LoadFromFile("Input.pptx");
Step 2: Get the column chart on the first slide and set chart title.
IChart columnChart = ppt.Slides[0].Shapes[0] as IChart;
columnChart.ChartTitle.TextProperties.Text = "Vertical Error Bars";
Step 3: Add Y (Vertical) error bars to the first chart series and format the error bars.
//Get Y error bars of the first chart series
IErrorBarsFormat errorBarsYFormat1 = columnChart.Series[0].ErrorBarsYFormat;
//Set end cap
errorBarsYFormat1.ErrorBarNoEndCap = false;
//Specify direction
errorBarsYFormat1.ErrorBarSimType = ErrorBarSimpleType.Plus;
//Specify error amount type
errorBarsYFormat1.ErrorBarvType = ErrorValueType.StandardError;
//Set value
errorBarsYFormat1.ErrorBarVal = 0.3f;
//Set line format
errorBarsYFormat1.Line.FillType = FillFormatType.Solid;
errorBarsYFormat1.Line.SolidFillColor.Color = Color.MediumVioletRed;
errorBarsYFormat1.Line.Width = 1;
Step 4: Get the bubble chart on the second slide and set chart title.
IChart chart2 = ppt.Slides[1].Shapes[0] as IChart;
chart2.ChartTitle.TextProperties.Text = "Vertical and Horizontal Error Bars";
Step 5: Add x (Horizontal) and Y (Vertical) error bars to the first chart series and format the error bars.
//Get X error bars of the first chart series
IErrorBarsFormat errorBarsXFormat = bubbleChart.Series[0].ErrorBarsXFormat;
//Set end cap
errorBarsXFormat.ErrorBarNoEndCap = false;
//Specify direction
errorBarsXFormat.ErrorBarSimType = ErrorBarSimpleType.Both;

//Specify error amount type
errorBarsXFormat.ErrorBarvType = ErrorValueType.StandardError;
//Set value
errorBarsXFormat.ErrorBarVal = 0.3f;

//Get Y error bars of the first chart series
IErrorBarsFormat errorBarsYFormat2 = bubbleChart.Series[0].ErrorBarsYFormat;
//Set end cap
errorBarsYFormat2.ErrorBarNoEndCap = false;
//Specify direction
errorBarsYFormat2.ErrorBarSimType = ErrorBarSimpleType.Both;
//Specify error amount type
errorBarsYFormat2.ErrorBarvType = ErrorValueType.StandardError;
//Set value
errorBarsYFormat2.ErrorBarVal = 0.3f;
Step 6: Save the document.
ppt.SaveToFile("ErrorBars.pptx", FileFormat.Pptx2013);
Screenshot:
Full code:
using System.Drawing;
using Spire.Presentation;
using Spire.Presentation.Charts;
using Spire.Presentation.Drawing;

namespace Add_error_bars_to_chart_in_PPT
{
    class Program
    {
        static void Main(string[] args)
        {
            //Load the PowerPoint document
            Presentation ppt = new Presentation();
            ppt.LoadFromFile("Input.pptx");

            //Get the column chart on the first slide and set chart title
            IChart columnChart = ppt.Slides[0].Shapes[0] as IChart;
            columnChart.ChartTitle.TextProperties.Text = "Vertical Error Bars";

            //Add Y (Vertical) Error Bars

            //Get Y error bars of the first chart series
            IErrorBarsFormat errorBarsYFormat1 = columnChart.Series[0].ErrorBarsYFormat;
            //Set end cap
            errorBarsYFormat1.ErrorBarNoEndCap = false;
            //Specify direction
            errorBarsYFormat1.ErrorBarSimType = ErrorBarSimpleType.Plus;
            //Specify error amount type
            errorBarsYFormat1.ErrorBarvType = ErrorValueType.StandardError;
            //Set value
            errorBarsYFormat1.ErrorBarVal = 0.3f;
            //Set line format
            errorBarsYFormat1.Line.FillType = FillFormatType.Solid;
            errorBarsYFormat1.Line.SolidFillColor.Color = Color.MediumVioletRed;
            errorBarsYFormat1.Line.Width = 1;

            //Get the bubble chart on the second slide and set chart title
            IChart bubbleChart = ppt.Slides[1].Shapes[0] as IChart;
            bubbleChart.ChartTitle.TextProperties.Text = "Vertical and Horizontal Error Bars";

            //Add X (Horizontal) and Y (Vertical) Error Bars

            //Get X error bars of the first chart series
            IErrorBarsFormat errorBarsXFormat = bubbleChart.Series[0].ErrorBarsXFormat;
            //Set end cap
            errorBarsXFormat.ErrorBarNoEndCap = false;
            //Specify direction
            errorBarsXFormat.ErrorBarSimType = ErrorBarSimpleType.Both;
            //Specify error amount type
            errorBarsXFormat.ErrorBarvType = ErrorValueType.StandardError;
            //Set value
            errorBarsXFormat.ErrorBarVal = 0.3f;

            //Get Y error bars of the first chart series
            IErrorBarsFormat errorBarsYFormat2 = bubbleChart.Series[0].ErrorBarsYFormat;
            //Set end cap
            errorBarsYFormat2.ErrorBarNoEndCap = false;
            //Specify direction
            errorBarsYFormat2.ErrorBarSimType = ErrorBarSimpleType.Both;
            //Specify error amount type
            errorBarsYFormat2.ErrorBarvType = ErrorValueType.StandardError;
            //Set value
            errorBarsYFormat2.ErrorBarVal = 0.3f;

            //Save the document
            ppt.SaveToFile("ErrorBars.pptx", FileFormat.Pptx2013);
        }
    }
}
How to set the indent style for the paragraph on presentation slide in C#
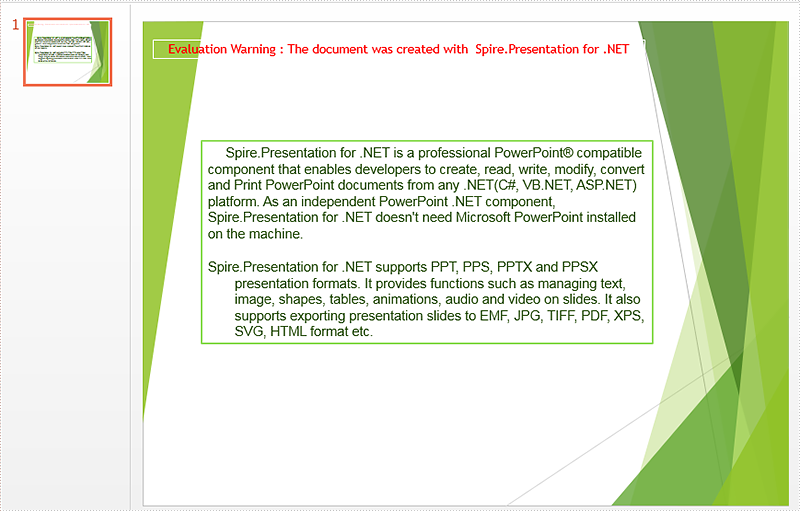
2018-01-30 07:45:45 Written by KoohjiSpire.Presentation supports to operate the paragraph styles from code. There are two kinds of special indentation styles for the paragraph, first line and hanging. This article will demonstrate how to set the indent style for the paragraph on presentation slide in C#.
Step 1: Create an instance of presentation and load the document from file.
Presentation presentation = new Presentation();
presentation.LoadFromFile("Sample.pptx");
Step 2: Get the paragraphs from the first slide.
IAutoShape shape = (IAutoShape)presentation.Slides[0].Shapes[0];
ParagraphCollection paras = shape.TextFrame.Paragraphs;
Step 3: Set the indentation as first line for the first paragraph.
paras[0].Indent = 20;
paras[0].SpaceAfter = 10;
Step 4: Set the indentation as Hanging for the third paragraph.
paras[2].Indent = -100;
paras[2].LeftMargin = 30;
Step 5: Save the document to file.
presentation.SaveToFile("Result.pptx", FileFormat.Pptx2010);
Effective screenshot of the presentation with indentation style:
Full codes:
using Spire.Presentation;
using Spire.Presentation.Collections;
namespace SetIndentStyle
{
    class Program
    {
        static void Main(string[] args)
        {

            Presentation presentation = new Presentation();
            presentation.LoadFromFile("Sample.pptx");

            IAutoShape shape = (IAutoShape)presentation.Slides[0].Shapes[0];
            ParagraphCollection paras = shape.TextFrame.Paragraphs;

            paras[0].Indent = 20;
            paras[0].SpaceAfter = 10;

            paras[2].Indent = -100;
            paras[2].LeftMargin = 30;

            presentation.SaveToFile("Result.pptx", FileFormat.Pptx2010);
        }
    }
}
