Knowledgebase (2417)
Children categories
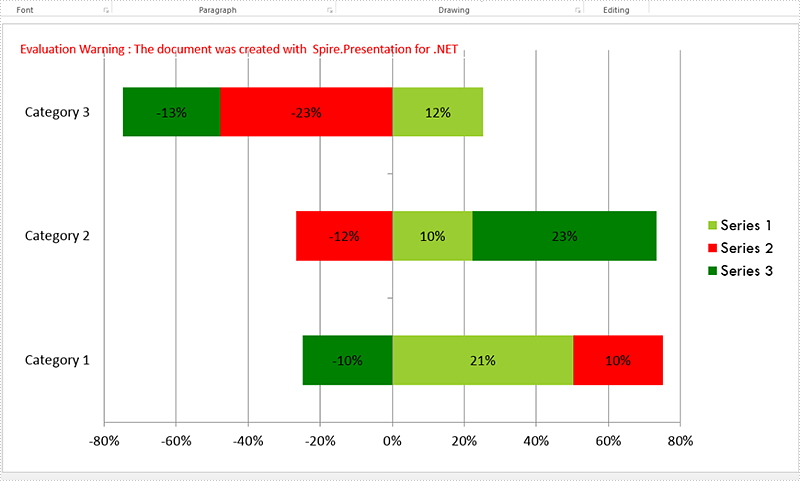
A 100% stacked bar chart is a chart type designed to show the relative percentage of multiple data series in stacked bars, where the total of each stacked bar always equals 100%. This article will demonstrate how to use Spire.Presentation to create 100% stacked bar in PowerPoint in C#.
Step 1: Create a Presentation object.
Presentation presentation = new Presentation();
Step 2: Add a "Bar100PercentStacked" chart to the first slide.
presentation.SlideSize.Type = SlideSizeType.Screen16x9;
SizeF slidesize = presentation.SlideSize.Size;
var slide = presentation.Slides[0];

RectangleF rect = new RectangleF(20, 20, slidesize.Width - 40, slidesize.Height - 40);
IChart chart = slide.Shapes.AppendChart(Spire.Presentation.Charts.ChartType.Bar100PercentStacked, rect);
Step 3: Write data to the chart data.
string[] columnlabels = { "Series 1", "Series 2", "Series 3" };

// Insert the column labels
String[] cols = columnlabels.ToArray();
for (Int32 c = 0; c < cols.Count(); ++c)
    chart.ChartData[0, c + 1].Text = cols[c];

string[] rowlabels = { "Category 1", "Category 2", "Category 3" };

// Insert the row labels
String[] rows = rowlabels.ToArray();
for (Int32 r = 0; r < rows.Count(); ++r)
    chart.ChartData[r + 1, 0].Text = rows[r];

double[,] values = new double[3, 3] { { 20.83233, 10.34323, -10.354667 }, { 10.23456, -12.23456, 23.34456 }, { 12.34345, -23.34343, -13.23232 }};

// Insert the values
double value = 0.0;
for (Int32 r = 0; r < rows.Count(); ++r)
{
    for (Int32 c = 0; c < cols.Count(); ++c)
    {
        value = Math.Round(values[r, c], 2);
        chart.ChartData[r + 1, c + 1].Value = value;
    }
}

chart.Series.SeriesLabel = chart.ChartData[0, 1, 0, columnlabels.Count()];
chart.Categories.CategoryLabels = chart.ChartData[1, 0, rowlabels.Count(), 0];

chart.PrimaryCategoryAxis.Position = AxisPositionType.Left;
chart.SecondaryCategoryAxis.Position = AxisPositionType.Left;
chart.PrimaryCategoryAxis.TickLabelPosition = TickLabelPositionType.TickLabelPositionLow;
Step 4: Set the data, font and format for the series of each column.
for (Int32 c = 0; c < cols.Count(); ++c)
 {
     chart.Series[c].Values = chart.ChartData[1, c + 1, rowlabels.Count(), c + 1];
     chart.Series[c].Fill.FillType = FillFormatType.Solid;
     chart.Series[c].InvertIfNegative = false;

     for (Int32 r = 0; r < rows.Count(); ++r)
     {
         var label = chart.Series[c].DataLabels.Add();
         label.LabelValueVisible = true;
         chart.Series[c].DataLabels[r].HasDataSource = false;
         chart.Series[c].DataLabels[r].NumberFormat = "0#\\%";
         chart.Series[c].DataLabels.TextProperties.Paragraphs[0].DefaultCharacterProperties.FontHeight = 12;
     }
 }
 chart.Series[0].Fill.SolidColor.Color = Color.YellowGreen;
 chart.Series[1].Fill.SolidColor.Color = Color.Red;
 chart.Series[2].Fill.SolidColor.Color = Color.Green;

 TextFont font = new TextFont("Tw Cen MT");
Step 5: Set the font and size for chartlegend.
for (int k = 0; k < chart.ChartLegend.EntryTextProperties.Length; k++)
 {
     chart.ChartLegend.EntryTextProperties[k].LatinFont = font;
     chart.ChartLegend.EntryTextProperties[k].FontHeight = 20;
 }
Step 6: Save the document to file.
presentation.SaveToFile("Sample.pptx", FileFormat.Pptx2010);
Effective screenshot of 100% stacked bar chart:
Full codes:
using Spire.Presentation;
using Spire.Presentation.Charts;
using Spire.Presentation.Drawing;
using System;
using System.Drawing;
using System.Linq;

namespace BarChart
{
    class Program
    {
        static void Main(string[] args)
        {
            Presentation presentation = new Presentation();
            presentation.SlideSize.Type = SlideSizeType.Screen16x9;
            SizeF slidesize = presentation.SlideSize.Size;

            var slide = presentation.Slides[0];

            RectangleF rect = new RectangleF(20, 20, slidesize.Width - 40, slidesize.Height - 40);
            IChart chart = slide.Shapes.AppendChart(Spire.Presentation.Charts.ChartType.Bar100PercentStacked, rect);

            string[] columnlabels = { "Series 1", "Series 2", "Series 3" };

            String[] cols = columnlabels.ToArray();
            for (Int32 c = 0; c < cols.Count(); ++c)
                chart.ChartData[0, c + 1].Text = cols[c];

            string[] rowlabels = { "Category 1", "Category 2", "Category 3" };

            String[] rows = rowlabels.ToArray();
            for (Int32 r = 0; r < rows.Count(); ++r)
                chart.ChartData[r + 1, 0].Text = rows[r];

            double[,] values = new double[3, 3] { { 20.83233, 10.34323, -10.354667 }, { 10.23456, -12.23456, 23.34456 }, { 12.34345, -23.34343, -13.23232 } };

            double value = 0.0;
            for (Int32 r = 0; r < rows.Count(); ++r)
            {
                for (Int32 c = 0; c < cols.Count(); ++c)
                {
                    value = Math.Round(values[r, c], 2);
                    chart.ChartData[r + 1, c + 1].Value = value;
                }
            }

            chart.Series.SeriesLabel = chart.ChartData[0, 1, 0, columnlabels.Count()];
            chart.Categories.CategoryLabels = chart.ChartData[1, 0, rowlabels.Count(), 0];

            chart.PrimaryCategoryAxis.Position = AxisPositionType.Left;
            chart.SecondaryCategoryAxis.Position = AxisPositionType.Left;
            chart.PrimaryCategoryAxis.TickLabelPosition = TickLabelPositionType.TickLabelPositionLow;

            for (Int32 c = 0; c < cols.Count(); ++c)
            {
                chart.Series[c].Values = chart.ChartData[1, c + 1, rowlabels.Count(), c + 1];
                chart.Series[c].Fill.FillType = FillFormatType.Solid;
                chart.Series[c].InvertIfNegative = false;

                for (Int32 r = 0; r < rows.Count(); ++r)
                {
                    var label = chart.Series[c].DataLabels.Add();
                    label.LabelValueVisible = true;
                    chart.Series[c].DataLabels[r].HasDataSource = false;
                    chart.Series[c].DataLabels[r].NumberFormat = "0#\\%";
                    chart.Series[c].DataLabels.TextProperties.Paragraphs[0].DefaultCharacterProperties.FontHeight = 12;
                }
            }
            chart.Series[0].Fill.SolidColor.Color = Color.YellowGreen;
            chart.Series[1].Fill.SolidColor.Color = Color.Red;
            chart.Series[2].Fill.SolidColor.Color = Color.Green;

            TextFont font = new TextFont("Tw Cen MT");

            for (int k = 0; k < chart.ChartLegend.EntryTextProperties.Length; k++)
            {
                chart.ChartLegend.EntryTextProperties[k].LatinFont = font;
                chart.ChartLegend.EntryTextProperties[k].FontHeight = 20;
            }

            presentation.SaveToFile("Sample.pptx", FileFormat.Pptx2010);
        }
    }
}
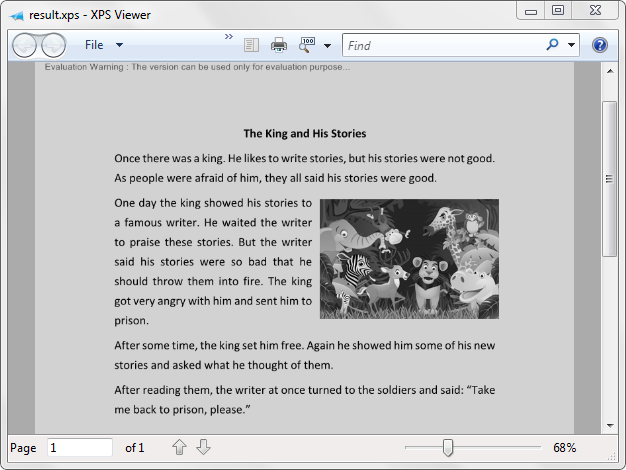
Spire.PDF supports to print a PDF in greyscale. This article is going to show you how to use Spire.PDF to accomplish this function.
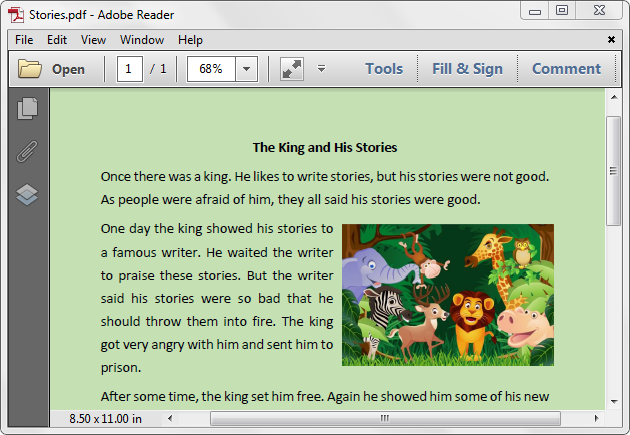
Below is the example PDF file we used for demonstration:
Detail steps:
Step 1: Create a PdfDocument instance and load the PDF file.
PdfDocument pdf = new PdfDocument();
pdf.LoadFromFile(@"Stories.pdf");
Step 2: Set the PdfPrintSettings.Color property to false.
pdf.PrintSettings.Color = false;
Step 3: Print the document.
pdf.Print();
Screenshot after printing to xps:
Full code:
using Spire.Pdf;

namespace Print_PDF_in_Black_and_White
{
    class Program
    {
        static void Main(string[] args)
        {
            PdfDocument pdf = new PdfDocument();
            pdf.LoadFromFile(@"Stories.pdf");
            pdf.PrintSettings.Color = false;
            pdf.Print();
        }
    }
}
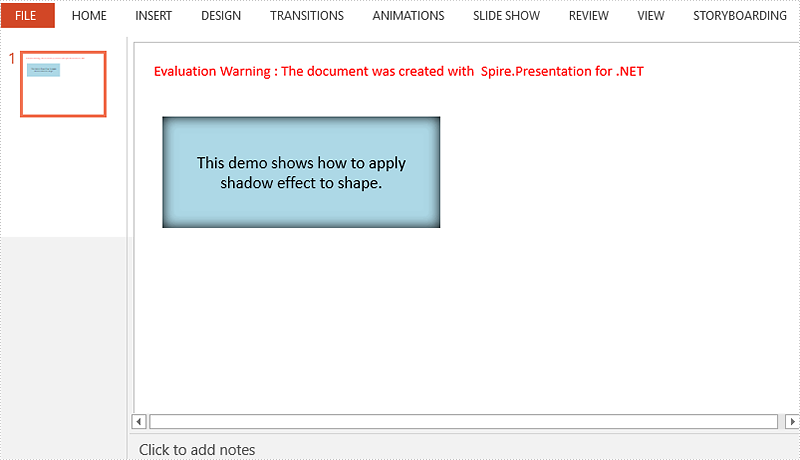
Shadows make your shapes or pictures especially with transparent background pop out of your slide. They make flat 2 dimensional graphics look like 3 dimensional graphics. This article will show you how we can apply shadow effects to shapes and pictures in PowerPoint using Spire.Presentation.
Apply Shadow Effect to Shape
using Spire.Presentation;
using Spire.Presentation.Drawing;
using System.Drawing;

namespace ApplyShadoweffect
{

    class Program
    {

        static void Main(string[] args)
        {
            {
                //Create a Presentation object and get the first slide.
                Presentation ppt = new Presentation();
                ISlide slide = ppt.Slides[0];

                //Add a shape to slide.
                RectangleF rect = new RectangleF(30, 80, 300, 120);
                IAutoShape shape = slide.Shapes.AppendShape(ShapeType.Rectangle, rect);
                shape.Fill.FillType = FillFormatType.Solid;
                shape.Fill.SolidColor.Color = Color.LightBlue;
                shape.Line.FillType = FillFormatType.None;
                shape.TextFrame.Text = "This demo shows how to apply shadow effect to shape.";
                shape.TextFrame.TextRange.Fill.FillType = FillFormatType.Solid;
                shape.TextFrame.TextRange.Fill.SolidColor.Color = Color.Black;

                //Create an inner shadow effect through InnerShadowEffect object.
                InnerShadowEffect innerShadow = new InnerShadowEffect();
                innerShadow.BlurRadius = 20;
                innerShadow.Direction = 0;
                innerShadow.Distance = 0;
                innerShadow.ColorFormat.Color = Color.Black;

                //Apply the shadow effect to shape.
                shape.EffectDag.InnerShadowEffect = innerShadow;

                //Save to file.
                ppt.SaveToFile("ShadowOnShape.pptx", FileFormat.Pptx2010);

            }
        }

    }
}
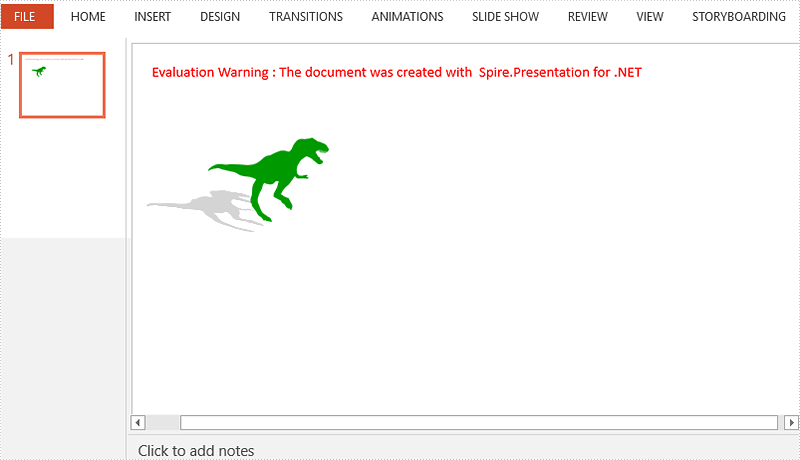
Apply Shadow Effect to Picture
using Spire.Presentation;
using Spire.Presentation.Drawing;
using System.Drawing;

namespace ApplyShadoweffect
{

    class Program
    {

        static void Main(string[] args)
        {
            {
                //Create a Presentation object and get the first slide.
                Presentation ppt = new Presentation();
                ISlide slide = ppt.Slides[0];

                //Get the picture path.
                string imagePath = "dinosaur.png";
                Image image = Image.FromFile(imagePath);
                float width = (float)image.Width / 3;
                float height = (float)image.Height / 3;

                //Add a shape to slide and fill the shape with picture.
                RectangleF rect = new RectangleF(80, 80, width, height);
                IAutoShape shape = slide.Shapes.AppendShape(ShapeType.Rectangle, rect);
                shape.Fill.FillType = FillFormatType.Picture;
                shape.Fill.PictureFill.Picture.Url = imagePath;
                shape.Fill.PictureFill.FillType = PictureFillType.Stretch;
                shape.Line.FillType = FillFormatType.None;

                //Choose a preset shadow effect.
                PresetShadow presetShadow = new PresetShadow();
                presetShadow.Preset = PresetShadowValue.BackLeftPerspective;
                presetShadow.ColorFormat.Color = Color.LightGray;

                //Apply the shadow effect to shape.
                shape.EffectDag.PresetShadowEffect = presetShadow;

                //Save to file.
                ppt.SaveToFile("ShadowOnPicture.pptx", FileFormat.Pptx2010);

            }
        }

    }
}