
Knowledgebase (2345)
Children categories
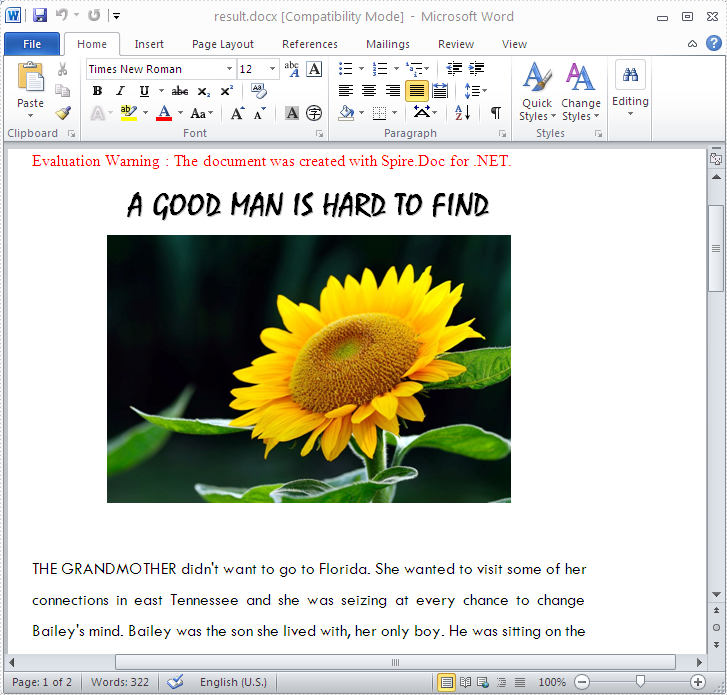
In Word document, users can add new page break or remove existing page breaks. This sample shows how to remove page breaks from the word document by using Spire.Doc. Spire.Doc supports to remove the page breaks from the word document from the format of .docx, .doc, and RTF etc.
Firstly make sure Spire.Doc for .NET has been installed correctly and then add Spire.Doc.dll as reference in the downloaded Bin folder though the below path: ".. \Spire.Doc\Bin\NET4.0\ Spire.Doc.dll". Here comes to the details of how to remove page breaks in C#.
//Create a new word document and load from the file.
Document document = new Document();
document.LoadFromFile("sample.docx");

// Traverse every paragraph of the first section of the document
for (int j = 0; j < document.Sections[0].Paragraphs.Count; j++)
  {
   Paragraph p = document.Sections[0].Paragraphs[j];

// Traverse every child object of a paragraph
for (int i = 0; i < p.ChildObjects.Count; i++)
    {
     DocumentObject obj = p.ChildObjects[i];

//Find the page break object
 if (obj.DocumentObjectType == DocumentObjectType.Break)
    {
     Break b = obj as Break;

// Remove the page break object from paragraph
p.ChildObjects.Remove(b);

//save the document to file.
document.SaveToFile("result.docx");
Please check the effective screenshot:
Full codes:
using Spire.Doc;
using Spire.Doc.Documents;
namespace RemovePageBreak
{
    class Program
    {
        static void Main(string[] args)
        {
            Document document = new Document();
            document.LoadFromFile("sample.docx", FileFormat.Docx);
            for (int j = 0; j < document.Sections[0].Paragraphs.Count; j++)
            {
                Paragraph p = document.Sections[0].Paragraphs[j];
                for (int i = 0; i < p.ChildObjects.Count; i++)
                {
                    DocumentObject obj = p.ChildObjects[i];
                    if (obj.DocumentObjectType == DocumentObjectType.Break)
                    {
                        Break b = obj as Break;
                        p.ChildObjects.Remove(b);
                    }
                }
            }
            document.SaveToFile("result.docx", FileFormat.Docx);
            System.Diagnostics.Process.Start("result.docx");
        }
    }
}
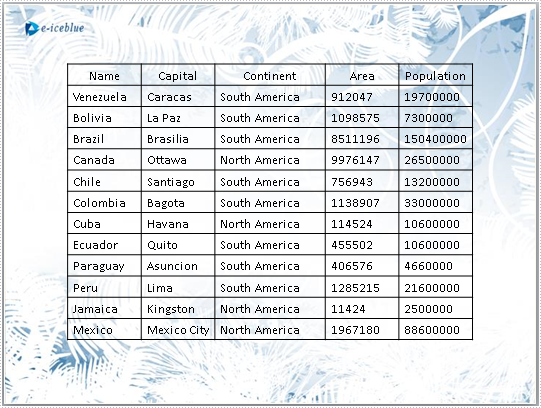
Spire.Presentation is a powerful and easy-to-use .NET component, especially designed for developers. Using Spire.Presentation you can generate, modify, convert, render, and print documents without installing Microsoft PowerPoint on your machine. There is a document in our website introducing you how to insert table. And in this document, you will be introduced how to edit a table within a PPT document.
Step 1: Create a Presentation instance and load the file.
Presentation presentation = new Presentation();
presentation.LoadFromFile("table.pptx");
Step 2: Store the data used in replacement in string [].
string[] str = new string[] { "Germany", "Berlin", "Europe", "0152458", "20860000" };
Step 3: Get the table within the PPT document.
ITable table = null;
foreach (IShape shape in presentation.Slides[0].Shapes)
{
    if (shape is ITable)
    {
        table = (ITable) shape;
    }
}
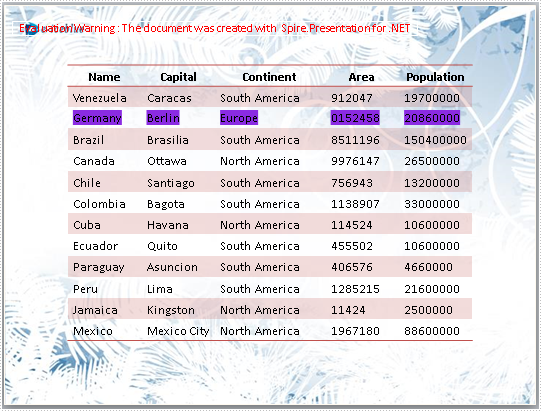
Step 4: Fill in the third row with new data and set the HighlightColor.
for (int i = 0; i < table.ColumnsList.Count;i++ )
{
    //replace the data in cell
    table[i, 2].TextFrame.Text = str[i];

    //set the highlightcolor
    table[i, 2].TextFrame.TextRange.HighlightColor.Color = Color.BlueViolet;
}
Step 5: Set the style of the table.
table.StylePreset = TableStylePreset.LightStyle1Accent2;
Step 6: Save the document.
presentation.SaveToFile("result.pptx", FileFormat.Pptx2010);
Download and install Spire.Presentation for .NET and refer to below code to edit table within PPT document.
Screenshots and full code:
Before:
After:
using Spire.Presentation;
using System.Drawing;

namespace EditTable
{

    class Program
    {

        static void Main(string[] args)
        {
            //create a PPT document
            Presentation presentation = new Presentation();

            presentation.LoadFromFile("table.pptx");

            //the data used in replacement
            string[] str = new string[] { "Germany", "Berlin", "Europe", "0152458", "20860000" };

            ITable table = null;

            //get the table in PPT document
            foreach (IShape shape in presentation.Slides[0].Shapes)
            {
                if (shape is ITable)
                {
                    table = (ITable)shape;

                    //change the style of table
                    table.StylePreset = TableStylePreset.LightStyle1Accent2;

                    for (int i = 0; i < table.ColumnsList.Count; i++)
                    {
                        //replace the data in cell
                        table[i, 2].TextFrame.Text = str[i];

                        //set the highlightcolor
                        table[i, 2].TextFrame.TextRange.HighlightColor.Color = Color.BlueViolet;
                    }
                }
            }

            //save the document
            presentation.SaveToFile("result.pptx", FileFormat.Pptx2010);
            System.Diagnostics.Process.Start("result.pptx");

        }

    }
}
Imports Spire.Presentation
Imports System.Drawing

Namespace EditTbale

	Class Program

		Private Shared Sub Main(args As String())
			'create a PPT document
			Dim presentation As New Presentation()

			presentation.LoadFromFile("table.pptx")

			'the data used in replacement
			Dim str As String() = New String() {"Germany", "Berlin", "Europe", "0152458", "20860000"}

			Dim table As ITable = Nothing

			'get the table in PPT document
			For Each shape As IShape In presentation.Slides(0).Shapes
				If TypeOf shape Is ITable Then
					table = DirectCast(shape, ITable)

					'change the style of table
					table.StylePreset = TableStylePreset.LightStyle1Accent2

					For i As Integer = 0 To table.ColumnsList.Count - 1
						'replace the data in cell
						table(i, 2).TextFrame.Text = str(i)

						'set the highlightcolor
						table(i, 2).TextFrame.TextRange.HighlightColor.Color = Color.BlueViolet
					Next
				End If
			Next

			'save the document
			presentation.SaveToFile("result.pptx", FileFormat.Pptx2010)
			System.Diagnostics.Process.Start("result.pptx")

		End Sub

	End Class
End Namespace
If you couldn't successfully use Spire.Presentation, please refer Spire.Presentation Quick Start which can guide you quickly use Spire.Presentation.
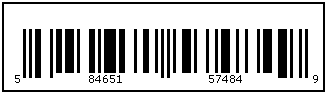
Spire.Barcode is a free .NET component specially designed for developers. It can generate many kinds of barcode such as EAN128, Codabar, DataMatrix, PostNet and so on. It can also scan the barcode images. X dimension is the measure of the narrowest bar in a barcode. Barcodes and scanners have different X dimensions, so they must be matched. Using Spire.Barcode, it is quiet an easy job to do this.
In this document, I will introduce you how to so.
Step 1: Create a BarcodeSettings instance.
BarcodeSettings setting = new BarcodeSettings();
Step 2: Set the data to render.
setting.Data = "58465157484";
setting.Data2D = "58465157484";
Step 3: Set the type of barcode to generate.
setting.Type = BarCodeType.UPCA;
Step 4: Set the value of X dimension.
setting.Unit = GraphicsUnit.Millimeter;
setting.X = 0.8F;
The property Unit specifies the measurement unit. In this sample, the measurement unit is millimeter.
Step 5: Generate barcode image using BarCodeGenerator.
BarCodeGenerator gen = new BarCodeGenerator(setting);
Image img = gen.GenerateImage();
img.Save("barcode.png");
Screenshot and Full Code:
using Spire.Barcode;
using System.Drawing;


namespace SetXDimension
{
    class Program
    {
        static void Main(string[] args)
        {
            BarcodeSettings barsetting = new BarcodeSettings();

            //set the x dimension
            barsetting.X = 0.8f;
            barsetting.Unit = GraphicsUnit.Millimeter;

            barsetting.HasBorder = true;
            barsetting.BorderWidth = 0.5F;

            //set the data
            barsetting.Data = "58465157484";
            barsetting.Data2D = "58465157484";

            //generate UPCA barcode
            barsetting.Type = BarCodeType.UPCA;

            BarCodeGenerator bargenerator = new BarCodeGenerator(barsetting);
            Image barcodeimage = bargenerator.GenerateImage();
            barcodeimage.Save("barcode.png");

            System.Diagnostics.Process.Start("barcode.png");
        }
    }
}
Imports Spire.Barcode
Imports System.Drawing


Namespace SetXDimension
	Class Program
		Private Shared Sub Main(args As String())
			Dim barsetting As New BarcodeSettings()

			'set the x dimension
			barsetting.X = 0.8F
			barsetting.Unit = GraphicsUnit.Millimeter

			barsetting.HasBorder = True
			barsetting.BorderWidth = 0.5F

			'set the data
			barsetting.Data = "58465157484"
			barsetting.Data2D = "58465157484"

			'generate UPCA barcode
			barsetting.Type = BarCodeType.UPCA

			Dim bargenerator As New BarCodeGenerator(barsetting)
			Dim barcodeimage As Image = bargenerator.GenerateImage()
			barcodeimage.Save("barcode.png")

			System.Diagnostics.Process.Start("barcode.png")
		End Sub
	End Class
End Namespace
