
Knowledgebase (2417)
Children categories
It is pretty easy in MS PowerPoint to export a certain shape as image with following two steps:
- 1. Select the object shape
- 2. From the right-click menu select Save as Picture
However, Spire.Presentation also provides easy method for programmers to save shapes out of slides. In the following section, we’ll introduce how to export shapes as images via Spire.Presentation with an example.
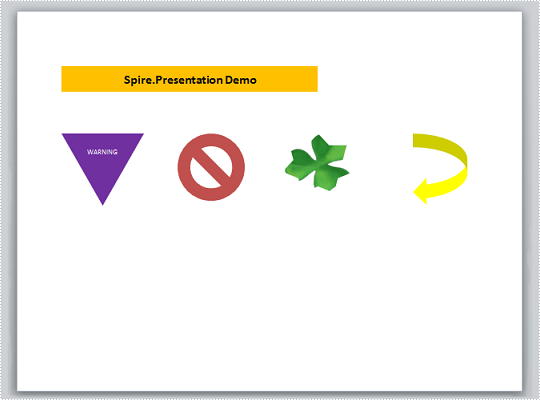
Test File:
As is shown in the screenshot, the sample file for testing contains several shapes on the first slide.
Code Snippet for Exporting Shape as Image:
Step 1: Initialize a new instance of Presentation class and load the test file from disk.
Presentation ppt = new Presentation();
ppt.LoadFromFile("test.pptx");
Step 2: Use for loop to traverse every shape in the slide. Call ShapeList.SaveAsImage(int shapeIndex) to save shape as image, then save this image to the specified file in the specified format.
for (int i = 0; i < ppt.Slides[0].Shapes.Count; i++)
{
    Image image = ppt.Slides[0].Shapes.SaveAsImage(i);
    image.Save(String.Format("Picture-{0}.png", i), System.Drawing.Imaging.ImageFormat.Png);
}
Output:
Picture-0

Picture-1

Entire Code:
using Spire.Presentation;
using System.Drawing;

namespace ExportShape
{

    class Program
    {

        static void Main(string[] args)
        {
            //create PPT document
            Presentation ppt = new Presentation();
            ppt.LoadFromFile("test.pptx");

            for (int i = 0; i < ppt.Slides[0].Shapes.Count; i++)
            {
                Image image = ppt.Slides[0].Shapes.SaveAsImage(i);
                image.Save(System.String.Format("Picture-{0}.png", i), System.Drawing.Imaging.ImageFormat.Png);
            }


        }
    }
}
Imports Spire.Presentation
Imports System.Drawing

Namespace ExportShape

	Class Program

		Private Shared Sub Main(args As String())
			'create PPT document
			Dim ppt As New Presentation()
			ppt.LoadFromFile("test.pptx")

			For i As Integer = 0 To ppt.Slides(0).Shapes.Count - 1
				Dim image As Image = ppt.Slides(0).Shapes.SaveAsImage(i)
				image.Save(System.[String].Format("Picture-{0}.png", i), System.Drawing.Imaging.ImageFormat.Png)
			Next


		End Sub
	End Class
End Namespace
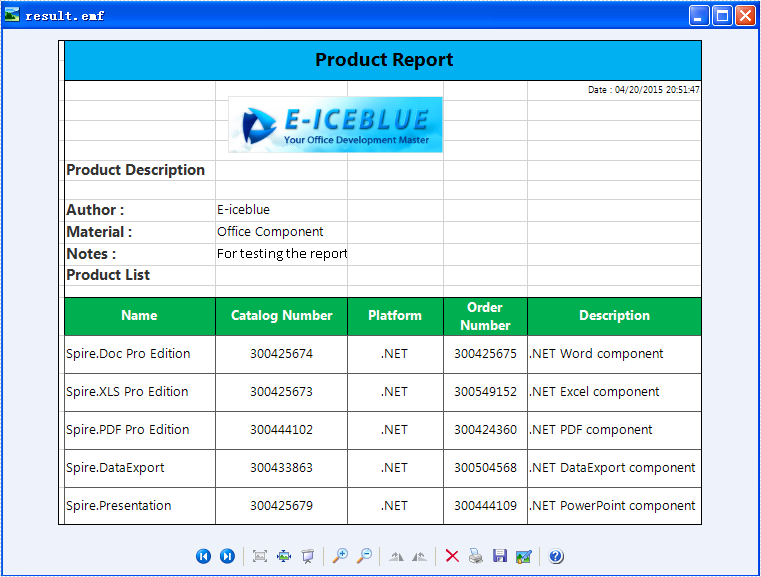
Spire.XLS has powerful functions to export Excel worksheets into different image file formats. In the previous articles, we have already shown you how to convert Excel worksheets into BMP, PNG, GIF, JPG, JPEG, TIFF. Now Spire.XLS newly starts to support exporting Excel worksheet into EMF image. With the help of Spire.XLS, you only need three lines of codes to finish the conversion function.
Make sure Spire.XLS (Version 7.6.43 or above) has been installed correctly and then add Spire.xls.dll as reference in the downloaded Bin folder though the below path: "..\Spire.Xls\Bin\NET4.0\ Spire. Xls.dll". Here comes to the details of how to convert excel worksheet to EMF image.
Step 1: Create an excel document and load the document from file.
Workbook workbook = new Workbook();
workbook.LoadFromFile("XLS2.xlsx");
Step 2: Get the first worksheet in excel workbook.
Worksheet sheet = workbook.Worksheets[0];
Step 3: Save excel worksheet into EMF image.
sheet.ToEMFStream(stream, 1, 1, 19, 6, EmfType.EmfPlusDual);
Effective screenshot:
Full codes:
using Spire.Xls;
using System.Drawing.Imaging;
using System.IO;

namespace XLStoEMF
{
    class Program
    {
        static void Main(string[] args)
        {
            Workbook workbook = new Workbook();
            workbook.LoadFromFile("XLS2.xlsx");

            Worksheet sheet = workbook.Worksheets[0];

            MemoryStream stream = new MemoryStream();
            sheet.ToEMFStream(stream, 1, 1, 19, 6, EmfType.EmfPlusDual);

            File.WriteAllBytes("result.emf", stream.ToArray());
        }
    }
}
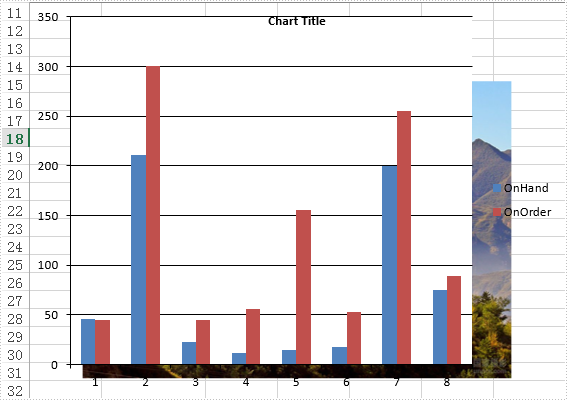
Set the offset of image when the fill way of chart is picture fill
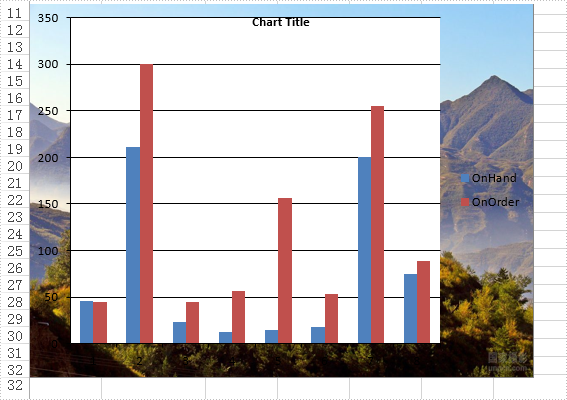
2015-04-17 07:39:10 Written by KoohjiSet offset of the filled image could make your chart background pictures zoom and show proportional as you wish. This article shows how to set the offset of image via Spire.XLS.
Here are the steps:
Step 1: Create an instance of Spire.XLS.Workbook.
Workbook book = new Workbook();
Step 2: Load data and create a contrast sheet.
workbook.LoadFromFile("test.xlsx",ExcelVersion.Version2013);
Worksheet sheet = workbook.Worksheets[0];
Worksheet sheet1 = workbook.Worksheets.Add("Contrast");
Step 3: Add chart1 and background image to sheet1 as comparision.
Chart chart1 = sheet1.Charts.Add(ExcelChartType.ColumnClustered);
chart1.DataRange = sheet.Range["D1:E9"];
chart1.SeriesDataFromRange = false;

chart1.LeftColumn = 1;
chart1.TopRow = 11;
chart1.RightColumn = 8;
chart1.BottomRow = 33;

chart1.ChartArea.Fill.CustomPicture(Image.FromFile("2.jpg"), "None");
Step 4: Add same chart and background image then set offset of image by transforming image in sheet[0] as form of XlsShapeFill. Then set the property of PicStretch of each direction with percentage and Tile property.
Chart chart = sheet.Charts.Add(ExcelChartType.ColumnClustered);
chart.DataRange = sheet.Range["D1:E9"];
chart.SeriesDataFromRange = false;

chart.LeftColumn = 1;
chart.TopRow = 11;
chart.RightColumn = 8;
chart.BottomRow = 33;

chart.ChartArea.Fill.CustomPicture(Image.FromFile("2.jpg"), "None");

IChart ichart = sheet.Charts[0];
(ichart.ChartArea.Fill as XlsShapeFill).Tile = false;
(ichart.ChartArea.Fill as XlsShapeFill).PicStretch.Left = 10;
(ichart.ChartArea.Fill as XlsShapeFill).PicStretch.Top = 20;
(ichart.ChartArea.Fill as XlsShapeFill).PicStretch.Right = 10;
(ichart.ChartArea.Fill as XlsShapeFill).PicStretch.Bottom = 5;
Step 5: Save and review.
workbook.SaveToFile("result.xlsx", ExcelVersion.Version2013);
System.Diagnostics.Process.Start("result.xlsx");
Screenshot:
Full code:
using Spire.Xls;
using Spire.Xls.Core;
using Spire.Xls.Core.Spreadsheet.Shapes;
using System.Drawing;
namespace SetOffsetofImage
{
    class Program
    {
        static void Main(string[] args)
        {
            Workbook workbook = new Workbook();
            workbook.LoadFromFile("test.xlsx", ExcelVersion.Version2013);
            Worksheet sheet = workbook.Worksheets[0];
            Worksheet sheet1 = workbook.Worksheets.Add("Contrast");

            //add contrast
            Chart chart1 = sheet1.Charts.Add(ExcelChartType.ColumnClustered);
            chart1.DataRange = sheet.Range["D1:E9"];
            chart1.SeriesDataFromRange = false;

            //Chart Position
            chart1.LeftColumn = 1;
            chart1.TopRow = 11;
            chart1.RightColumn = 8;
            chart1.BottomRow = 33;

            chart1.ChartArea.Fill.CustomPicture(Image.FromFile("2.jpg"), "None");

            //add original
            Chart chart = sheet.Charts.Add(ExcelChartType.ColumnClustered);
            chart.DataRange = sheet.Range["D1:E9"];
            chart.SeriesDataFromRange = false;

            //Chart Position
            chart.LeftColumn = 1;
            chart.TopRow = 11;
            chart.RightColumn = 8;
            chart.BottomRow = 33;

            chart.ChartArea.Fill.CustomPicture(Image.FromFile("2.jpg"), "None");

            IChart ichart = sheet.Charts[0];
            (ichart.ChartArea.Fill as XlsShapeFill).Tile = false;
            (ichart.ChartArea.Fill as XlsShapeFill).PicStretch.Left = 10;
            (ichart.ChartArea.Fill as XlsShapeFill).PicStretch.Top = 20;
            (ichart.ChartArea.Fill as XlsShapeFill).PicStretch.Right = 10;
            (ichart.ChartArea.Fill as XlsShapeFill).PicStretch.Bottom = 5;

            workbook.SaveToFile("result.xlsx", ExcelVersion.Version2013);
            System.Diagnostics.Process.Start("result.xlsx");
        }
    }
}
