Word-Dokumente aus Excel-Daten in C# generieren
Inhaltsverzeichnis
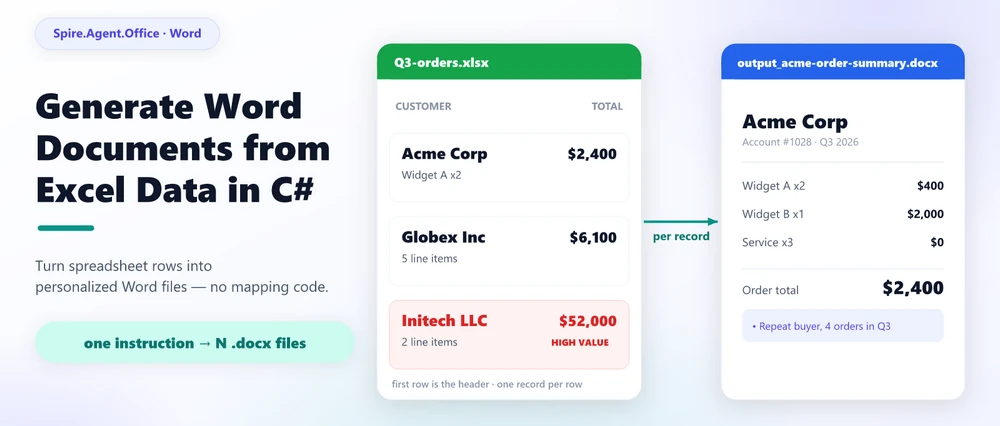
Das Generieren von Word-Dokumenten aus Excel-Daten bedeutet, Tabellenzeilen als Quelle für ein oder mehrere strukturierte Word-Dateien zu verwenden, üblicherweise basierend auf einer Vorlage oder einem Dokumentengenerierungs-Workflow. Traditionell wird diese Aufgabe mit dem Word-Seriendruck erledigt: Sie ordnen Excel-Spalten den Feldern in einer .docx-Vorlage zu und lassen Word ein Dokument pro Zeile erstellen. Dieselbe Aufgabe kann in C# mit einem Dokumenten-SDK automatisiert oder mit einem KI-Dokumenten-Agenten, der die Anforderung als natürlichsprachliche Anweisung entgegennimmt, noch weiter vorangetrieben werden. Dieser Artikel vergleicht die verschiedenen Wege, zeigt auf, wo der Seriendruck an seine Grenzen stößt, und führt durch ein funktionierendes C#-Beispiel, das auf Spire.Agent.Office basiert, einem KI-Agenten-SDK für Office-Dokumente.
Schnellnavigation
- Was bedeutet es, Word-Dokumente aus Excel-Daten zu generieren?
- Seriendruck von Excel zu Word
- Drei Wege zur Automatisierung der Word-Generierung aus Excel in .NET
- Personalisierte Word-Dokumente aus Excel in C# generieren
- FAQ
1. Was bedeutet es, Word-Dokumente aus Excel-Daten zu generieren?
Der Ausdruck klingt ähnlich wie „Excel in Word konvertieren“, aber die Absicht ist eine andere. Beim Konvertieren von .xlsx zu .docx wird das Format einer Datei geändert, während der Inhalt weitgehend gleich bleibt. Beim Generieren von Word-Dokumenten aus Excel-Daten werden neue Dokumente erstellt, deren Inhalt aus Zellen einer Tabelle abgeleitet ist: ein Bestellblatt pro Kunde, ein monatlicher Bericht pro Region, eine Reihe von Briefen oder Etiketten aus einer Adressliste, ein Satz von Rechnungen aus einer Bestelltabelle.
Das wiederkehrende Muster der Anforderung ist fast immer dasselbe:
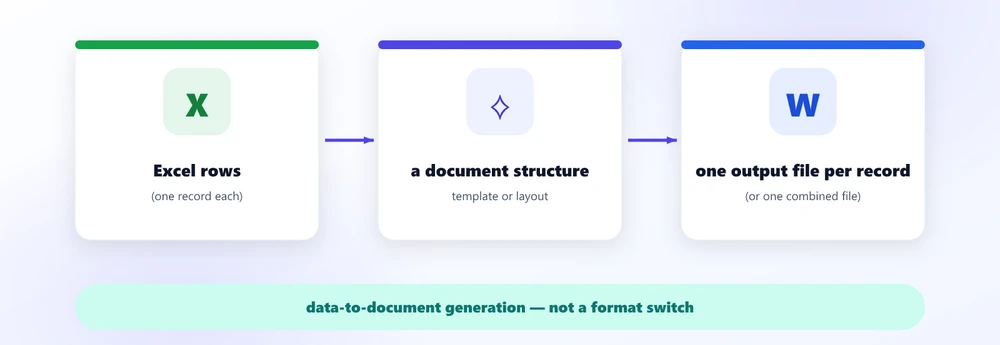
Als echter Satz formuliert klingt es so: „Ich habe eine Liste von Kunden und deren Bestellungen in Excel; ich benötige für jeden Kunden ein Word-Dokument mit seinen Informationen, seinen Artikeln und einer Gesamtsumme.“ Das entscheidende Wort ist abgeleitet: Der Dokumentinhalt stammt aus Daten; es handelt sich also um eine Daten-zu-Dokument-Generierung, nicht um einen Formatwechsel.
Das ist die Anforderung, auf die dieser Artikel abzielt. Alles Folgende befasst sich mit den verschiedenen Wegen, diese zu erfüllen, und dem Punkt, an dem Sie aufhören sollten, Felder manuell zu verknüpfen.
2. Der traditionelle Weg: Seriendruck von Excel zu Word
Auf der UI-Ebene ist die Standardantwort auf die Frage „Wie wandle ich diese Excel-Liste in viele Word-Dokumente um?“ der Word-Seriendruck. Es ist die Funktion, an die die meisten Menschen denken, wenn sie nach dieser Aufgabe suchen, und Microsoft bietet dafür eine Schritt-für-Schritt-Anleitung. Der Mechanismus ist einfach und gut verständlich:
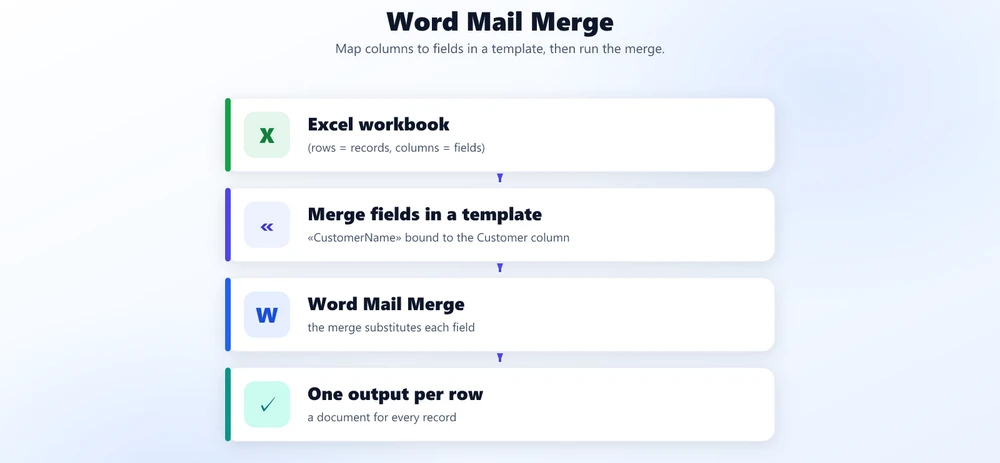
Sie platzieren ein Feld wie «Kundenname» in einer Briefvorlage, verknüpfen es mit der Spalte Kunde der Excel-Quelle, führen den Seriendruck aus, und Word schreibt ein Dokument pro Zeile, wobei der Wert ersetzt wird. Da die Zeilenanzahl in die Tausende gehen kann, wird aus „eine Datei öffnen, den Text kopieren, den Namen ändern“ ein Stapelvorgang ohne eine Zeile Code.
Der Seriendruck ist genau für eine Art von Arbeit hervorragend geeignet: Füge diese Spalte viele Male in jenes Feld ein. Briefe, Umschläge, Etiketten und Mitteilungen mit einem festen Layout sind sein Heimspiel. Er läuft innerhalb von Office, benötigt keine Programmierung, und für diese stabilen, rein feldbasierten Dokumente ist er wirklich das richtige Werkzeug.
3. Die Grenzen des Seriendrucks
Die Grenze ist erreicht, sobald das Dokument kein festes Formular mit leeren Stellen mehr ist, sondern etwas, das von den Daten abhängen muss. Der Seriendruck ersetzt Werte; er entscheidet nicht über die Struktur, analysiert keine Inhalte und verfasst nichts Neues.
Vergleichen Sie zwei Anforderungen. Die erste ist das, was der Seriendruck bewältigt:
„Füge den Kundennamen an der Namensstelle ein, die Adresse an der Adressstelle und die Bestellung in die Bestelldetails.“
Die zweite ist die Anforderung, die die meisten echten Berichte erfordern:
„Lies diese Excel-Arbeitsmappe, analysiere die Daten jedes Kunden, erstelle einen personalisierten Bericht mit seinen Artikeln und Summen, füge eine Zusammenfassung seines Kaufverhaltens hinzu und speichere jedes Ergebnis als separates Word-Dokument.“
Die zweite Anforderung scheitert an allen drei Annahmen des Seriendrucks:
- Die Struktur variiert. Ein Kunde mit drei Positionen benötigt einen anderen Dokumentkörper als einer mit dreißig. Seriendruckfelder setzen ein festes Layout mit festen Leerstellen voraus; sie erweitern eine Tabelle nicht um so viele Zeilen, wie die Daten erfordern.
- Inhalt muss berechnet, nicht kopiert werden. „Das Kaufverhalten zusammenfassen“ und „Kunden mit hohem Wert markieren“ erzeugen Text und Entscheidungen, die in keiner Spalte stehen. Es gibt kein Quellfeld, mit dem sie verknüpft werden könnten.
- Die Ausgabe ist eine Reihe echter Dateien. Jeder Datensatz sollte ein eigenes Word-Dokument mit eigenem Namen sein, und der Workflow sollte unbeaufsichtigt innerhalb einer Anwendung laufen, nicht über einen Office-Assistenten.
Das ist die ehrliche Position des Seriendrucks, fair ausgedrückt: Er ist exzellent bei der Feldzuordnung, wird aber weniger geeignet, wenn Dokumentstruktur, Inhalt oder Ausgabelogik mit den Daten variieren müssen. Die tiefere Anforderung – Daten in Dokumente umwandeln – ist ein Generierungsproblem, und hier beginnen die unten genannten Automatisierungswege.
4. Die Anforderung als Anweisung: Der Agent-Weg
Die Alternative, die zur korrekten Version des Problems passt, ist ein KI-Dokumenten-Agent: eine natürlichsprachliche Ebene über einer deterministischen Dokumenten-Engine. Anstatt Vorlagenfelder und Code pro Feld aufzulisten, beschreiben Sie die Ausgabe, und der Agent kann Anforderungen bewältigen, die mit traditionellem Seriendruck schwer auszudrücken sind – das Lesen der Daten, das Gestalten der Struktur, das Schreiben der Analyse –, während die Dokumenten-Engine garantiert, dass ein echtes, wohlgeformtes .docx (oder PDF) herauskommt.
Der Wert ist als Kette leichter zu erkennen:
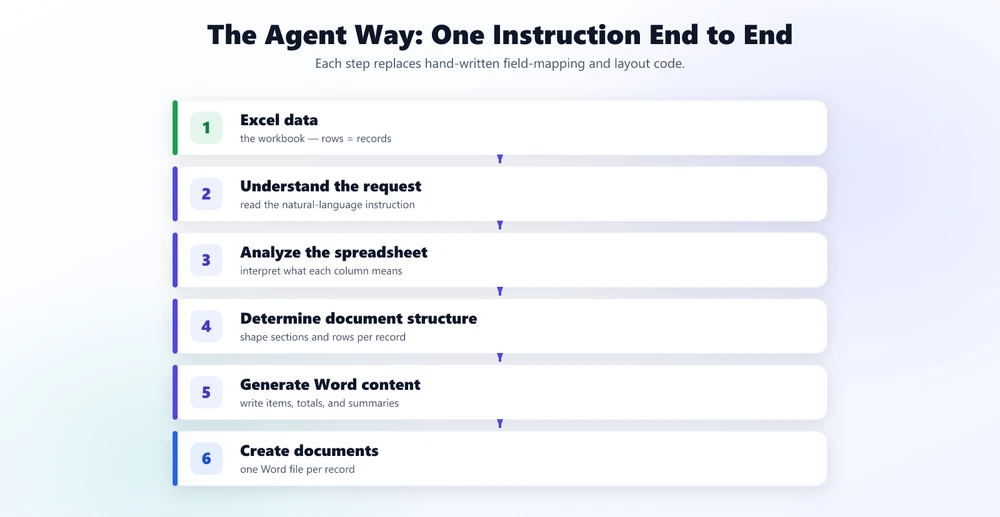
Schritte, die mit traditionellem Seriendruck schwer auszudrücken sind – insbesondere die mittleren drei –, sind genau die Bereiche, in denen ein Agent seinen Wert beweist. Er kann interpretieren, was eine Spalte bedeutet („Gesamtbetrag“, „Umsatz“ und „Netto“ können unter drei Überschriften dasselbe Konzept bezeichnen), die Dokumentstruktur an jeden Datensatz anpassen und die Zusammenfassungsabsätze verfassen. Was Sie bereitstellen, ist ein Satz, keine Feldzuordnung.
Die Botschaft für den Rest dieses Artikels: Seriendruck ordnet Excel-Spalten Word-Feldern zu; ein KI-Agent generiert Dokumente aus einer Anforderung. Ersteres ist ein Wert-Ersetzungsschritt, Letzteres ist das, was die Anforderung eigentlich war.
5. Drei Wege zur Automatisierung der Word-Generierung aus Excel in .NET
Die Entscheidung für den richtigen Weg ist wichtiger als der Code, da jeder Weg eine andere Kostenkurve hat. Für eine .NET-Anwendung, die diesen Workflow benötigt, sind die realistischen Optionen:
| Ansatz | Was er erfordert | Flexibilität | Am besten geeignet für |
|---|---|---|---|
| Word-Seriendruck | Eine .docx-Vorlage mit Seriendruckfeldern + eine Excel-Quelle; Seriendruck ausführen (oder skripten) | Ordnet eine Spalte einem Feld zu; scheitert bei variabler Struktur, bedingtem Inhalt, Analyse | Briefe, Etiketten, Umschläge, Mitteilungen mit fester Form |
| SDK-Feldbindung | Vorlage im Code laden, Arbeitsmappe öffnen, Zeilen durchlaufen, Binden/Suchen-Ersetzen pro Datensatz, jede Datei speichern | Deterministisch und testbar; Sie pflegen die Spaltenzuordnung und das Layout manuell, jede Änderung erfordert Neukompilierung | Wiederholung einer stabilen Dokumentform im großen Maßstab |
| Natürlichsprachlicher KI-Agent | Arbeitsmappe als Anhang übergeben, Ausgabe beschreiben, Ergebnis lesen | Bewältigt variable Struktur, Analyse pro Datensatz, bedingte Abschnitte, Zusammenfassungen | Dokumente, die mit den Daten variieren, oder Workflows, die sich monatlich ändern |
Eine Abkürzung, die die meisten Fälle entscheidet:
- Form ändert sich nie, ein Feld pro Spalte, Massenbriefe – Seriendruck ist schwer zu schlagen.
- Form ändert sich nie, aber Sie benötigen es im Code, deterministisch und testbar – verwenden Sie eine SDK-Feldbindungs-Schleife.
- Das Dokument muss mit den Daten variieren, Analysen enthalten oder sich häufig ändern – hier zahlt sich ein KI-Agent aus, da die Kosten einer Änderung oft darauf reduziert werden können, die Anweisung zu aktualisieren, anstatt die Zuordnungs- und Layoutlogik im Code zu ändern.
6. Personalisierte Word-Dokumente aus Excel in C# generieren
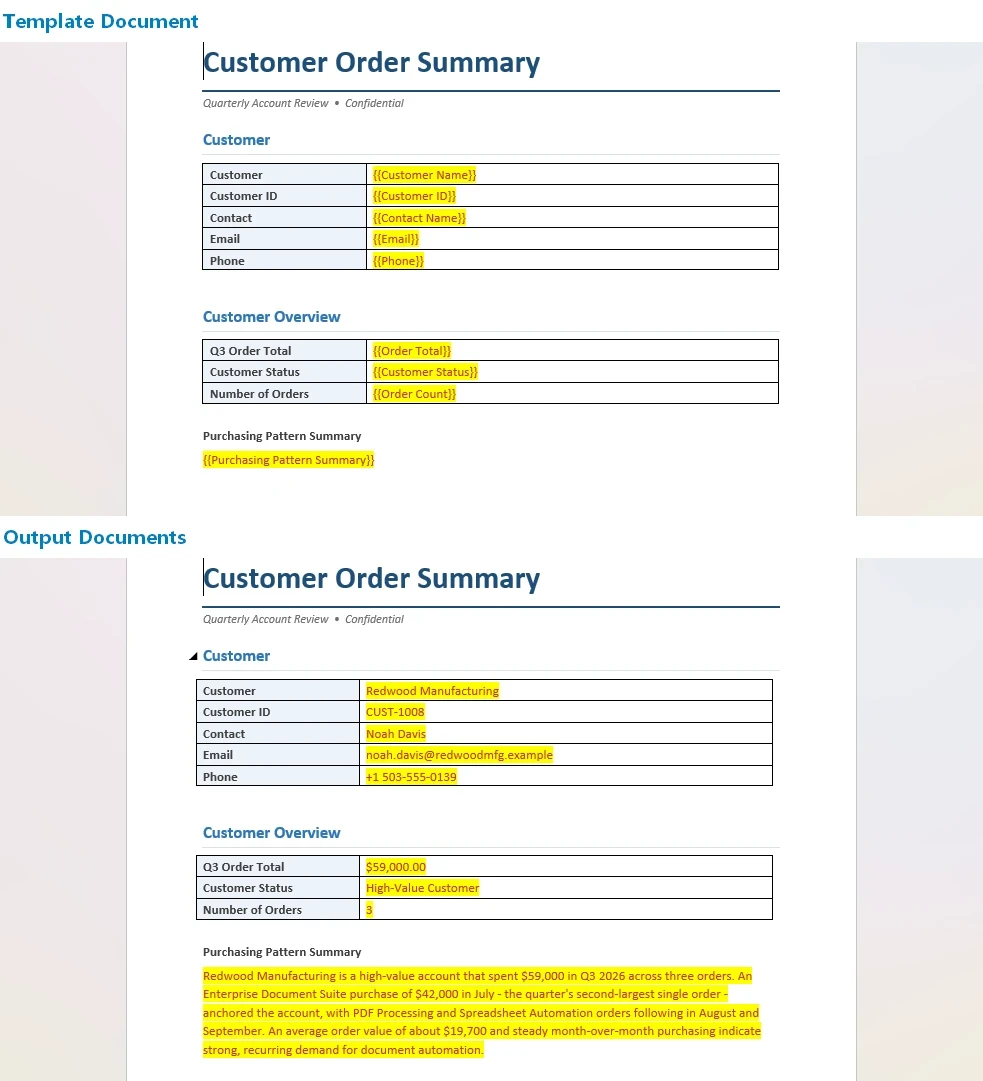
Eine konkrete, funktionierende Version der Anforderung „ein Word-Dokument pro Datensatz“ ist eine Kundenbestellungszusammenfassung. Die Eingaben sind eine Arbeitsmappe mit Kundenbestellungen und eine leichte Word-Vorlage; die Ausgabe ist ein personalisiertes Dokument pro Kunde. Das vollständige Setup – Token, Paket und Projekt-Verkabelung – ist im Getting Started-Tutorial dokumentiert; hier konzentrieren wir uns auf den Generierungsaufruf selbst.
using Spire.Doc;
using Spire.Agent.Office.AI;
using Spire.Agent.Office.Extensions;

AIOptions options = new AIOptions
{
    SpireToken = spireToken,
    WorkDir = @"C:\order-ops\output",   // Ordner, in den die generierten Dokumente geschrieben werden
    TimeoutMs = 300000
};

using (Document doc = new Document())
{
    // Die Vorlage liefert Anker pro Datensatz; die Arbeitsmappe ist die Datenquelle.
    doc.LoadFromFile(@"C:\order-ops\templates\order-summary-template.docx");

    // savePath = null: Eine Anweisung erzeugt ein Dokument pro Datensatz,
    // geschrieben in den WorkDir-Ausgabeordner. Keine C#-Schleife über die Zeilen.
    AIResult result = doc.AI(options).ExecuteInstruction(
        doc,
        "Lies die Kundenbestelldaten in Q3-orders.xlsx. Generiere eine unabhängige " +
        "Word-Bestellzusammenfassung pro Kunde, Zeile für Zeile. Füge ihre Kontakt- " +
        "informationen, jeden Artikel mit Menge und Betrag, die Bestellsummen " +
        "und eine ein-absätzige Zusammenfassung ihres Kaufverhaltens hinzu. Markiere Kunden, " +
        "deren Summe 50.000 übersteigt, als 'High-Value'. Speichere jedes Dokument als eigene " +
        "Datei mit dem Namen output_ gefolgt vom Kundennamen (zum Beispiel " +
        "output_acme-order-summary.docx).",
        null,
        new[] { @"C:\order-ops\input\Q3-orders.xlsx" });

    if (result == null || !result.Success)
        throw new InvalidOperationException($"Generierung fehlgeschlagen: {result?.ErrorMessage}");
}
Drei Details sind wichtig, wenn Sie dies selbst ausführen. Erstens: Die Anweisung ist der Ort, an dem die Generierungslogik lebt: die Analyse („Zusammenfassung des Kaufverhaltens“), die bedingte Logik („Kunden über 50.000 markieren“) und die Struktur pro Datensatz („jeder Artikel“). Zweitens: Die Arbeitsmappe sollte ordentlich sein: erste Zeile ist die Kopfzeile, ein Datensatz pro Zeile, keine leeren Zeilen oder zusammengeführten Kopfzellen – dieselben Regeln, die Word für seine eigene Datenquelle erwartet. Drittens: Das Basisdokument verankert das Ausgabelayout; ein leicht strukturiertes Dokument kann dem Agenten einen nützlichen Startpunkt für die Struktur jedes Datensatzes geben. Mit einem vollständig leeren Basisdokument erzeugt dieselbe Anweisung stattdessen ein einzelnes zusammengesetztes Dokument.
Eine Namensregel ist hier wichtig: Dokumente, die der Agent in WorkDir schreibt, müssen mit dem Präfix output_ beginnen, sonst zählt das SDK sie nicht als generierte Dateien. Deshalb verlangt die obige Anweisung Dateien wie output_acme-order-summary.docx anstelle von bloßen Kundennamen.
Die .docx-Erweiterung in Ihrem Speicherziel oder Dateimuster wählt das Ausgabeformat; richten Sie dieselbe Anweisung auf .pdf und der Agent exportiert die identischen Dokumente zur Verteilung, ohne separaten Rendering-Schritt.
Wichtige API-Aufrufe
Document.AI(options)– hängt den KI-Dokumentenprozessor an ein Word-Dokumentobjekt anExecuteInstruction(doc, instruction, savePath, attachments)– führt die Generierung aus;nullals savePath bedeutet „inWorkDirschreiben“, und die Arbeitsmappe wird inattachmentPathsmitgeführtAIResult.Success/AIResult.ErrorMessage– überprüft den Lauf und zeigt Fehler an
7. Was Sie ohne einen Agenten schreiben würden
Zum Vergleich: Der SDK-Feldbindungs-Weg für dieselbe Aufgabe macht alles explizit. Das Folgende ist absichtlich vereinfacht, um den Umfang der beteiligten Anwendungslogik zu zeigen; eine produktive Implementierung müsste auch die Arbeitsmappendaten laden und gruppieren:
using Spire.Doc;
using Spire.Xls;

// Eine feste Form ist in Ordnung; jede Variation bedeutet mehr Verkabelung.
foreach (DataRow row in customersTable.Rows)
{
    using (Document doc = new Document())
    {
        doc.LoadFromFile(@"templates\order-summary-template.docx");

        // Suchen-und-Ersetzen pro Anker...
        doc.Replace("{{CustomerName}}", row["Customer"].ToString(), true, true);
        doc.Replace("{{TotalAmount}}", row["Amount"].ToString("C"), true, true);

        // Positionen leben in einem zweiten Blatt: Sie verknüpfen sie manuell pro Kunde,
        // erstellen eine Tabelle und fügen sie an einem Lesezeichen ein...
        // Die Regel „Kunden mit hohem Wert markieren“ ist ein if/else, das Sie pflegen,
        // und der Zusammenfassungsabsatz pro Kunde ist eine Vorlage, die Sie von Hand schreiben.
        doc.SaveToFile($@"out\{row["Customer"]}-order-summary.docx");
    }
    // ... und jede neue Regel, Spalte oder Layoutänderung bedeutet, dies zu bearbeiten und neu zu kompilieren.
}
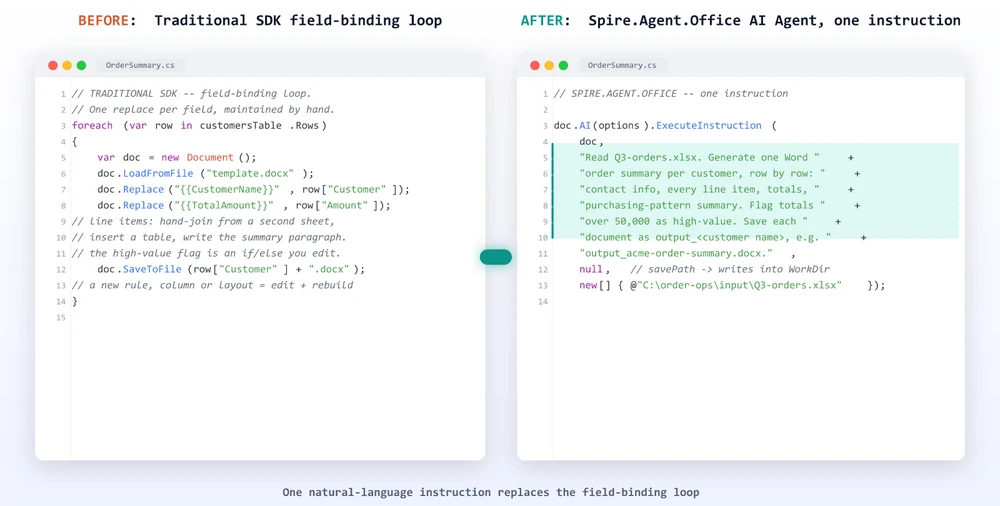
Der Agent beseitigt nicht die Notwendigkeit für Code – er beseitigt die Notwendigkeit für Zuordnungs- und Layout-Code. Der Unterschied liegt darin, wo die Logik lebt: in einem Spaltenindex und einem Suchen-und-Ersetzen oder in einem Satz, den das Unternehmen lesen und bearbeiten kann. Wenn sich Geschäftsregeln oder Dokumentstrukturen häufig ändern, kann der natürlichsprachliche Ansatz die Menge an Zuordnungs- und Layout-Code reduzieren, die gewartet werden muss. Das Vorlagen-plus-Daten-Muster skaliert über Bestellzusammenfassungen hinaus: Batch-Vertragsgenerierung mit Spire.Agent.Office führt durch denselben Ein-Anweisungs-Ein-Dokument-pro-Datensatz-Workflow, angewendet auf Verträge.
8. Wo KI endet und Anwendungslogik beginnt
Eine nützliche Grenze ist nicht „was KI kann und was nicht“, sondern was die Anwendung weiterhin besitzen sollte. Ein Dokumentengenerierungs-Agent sitzt auf deterministischem Code; er ersetzt ihn nicht.
Ihre Anwendung besitzt weiterhin die Teile, die nichts mit dem Verständnis der Tabelle zu tun haben:
- Dateierkennung und -zugriff – die Arbeitsmappe finden, Berechtigungen prüfen, Eingaben bereitstellen
- Workflow-Planung – wann der Job läuft, bei welchem Auslöser, in welcher Reihenfolge
- Datenquellenkontrolle – welche Arbeitsmappe eine autorisierte Eingabe ist und woher sie stammt
- Fehlerbehandlung und Wiederholungen – was passiert, wenn eine Datei fehlt oder ein Lauf fehlschlägt
- Endgültige Genehmigung – ein Mensch überprüft die generierten Dokumente, bevor sie versendet werden
Der Agent übernimmt die semantischen Schritte:
- Verständnis – lesen, was jede Spalte aus verschiedenen Arbeitsmappen bedeutet
- Strukturplanung – bestimmen, wie viele Abschnitte und Zeilen das Dokument benötigt
- Analyse – Bestelldaten in eine Zusammenfassung und ein „High-Value“-Flag umwandeln
- Komposition – personalisierte Word-Dokumente aus der Anforderung zusammenstellen
Behalten Sie die deterministische Installation im Code, wo sie testbar und prüfbar ist, und übergeben Sie die semantische Generierung an den Agenten. Jede Seite tut das, worin sie gut ist. KI-Vertragsprüfung in C# zeigt dieselbe Aufteilung von der anderen Seite: Der Agent übernimmt den semantischen Schritt der Überprüfung eines Dokumentinhalts, während die Anwendung die deterministische Dateibehandlung drumherum behält.
9. FAQ
Ist dies ein Ersatz für den Word-Seriendruck?
Kein direkter Ersatz; es ist dieselbe Aufgabe, nur weitergeführt. Der Seriendruck ordnet Excel-Spalten festen Word-Feldern zu, was für einen Brief mit stabiler Form ausreicht. Ein KI-Agent kann das auch und kann zudem die Arbeitsmappe nach Inhalt lesen, die Struktur pro Datensatz gestalten, Analysen hinzufügen und Prosa verfassen. Für einfache Ausgaben mit fester Form bleibt der Seriendruck ein gutes Werkzeug; wenn das Dokument mit den Daten variieren muss, übernimmt der Agent mehr Arbeit.
Wie generiere ich mehrere Word-Dokumente aus Excel-Daten?
Übergeben Sie die Arbeitsmappe als Anhang, setzen Sie den Speicherpfad auf null und richten Sie AIOptions.WorkDir auf einen Ausgabeordner. Eine ExecuteInstruction mit einer Zeile-für-Zeile-Anweisung lässt den Agenten ein unabhängiges Dokument pro Datensatz erstellen, das jeweils in diesem Ordner gespeichert wird. Für den Stapel pro Datensatz ist keine C#-Schleife über die Zeilen erforderlich.
Kann ich Word-Dokumente aus Excel generieren, ohne den Seriendruck zu verwenden?
Ja. In C# können Sie eine Vorlage direkt mit dem SDK binden oder die Arbeitsmappe an einen KI-Agenten übergeben, der sie aus einer natürlichsprachlichen Anweisung liest, und ein echtes .docx oder PDF zurückerhalten. Der Seriendruck ist ein Weg, nicht der einzige, und er ist der am wenigsten flexible, sobald das Dokument Analysen oder bedingte Abschnitte benötigt.
Was ist der Unterschied zwischen Seriendruck und KI-Dokumentengenerierung?
Der Seriendruck bindet definierte Felder an definierte Spalten: Excel-Spalte rein, Word-Feld raus. Die KI-Dokumentengenerierung interpretiert die Anforderung und die Daten zusammen, sodass sie interpretieren kann, was jede Spalte bedeutet, die Struktur des Dokuments entsprechend gestalten, bedingte oder analytische Inhalte erstellen und mehrere Dokumente aus einer Anweisung zusammenstellen kann. Ersteres ist ein Zuordnungsschritt; Letzteres ist eine Generierungsaufgabe.
Kann ich personalisierte Word-Dokumente aus einer Excel-Datei in C# generieren?
Ja. Laden Sie eine Word-Vorlage oder ein leeres Dokument in Spire.Doc, hängen Sie die Excel-Arbeitsmappe an und rufen Sie ExecuteInstruction mit einer Beschreibung der personalisierten Ausgabe auf. Der Agent liest jeden Datensatz und erstellt ein darauf abgestimmtes Dokument, das pro Datensatz oder als eine kombinierte Datei gespeichert wird – alles innerhalb Ihrer eigenen .NET-Anwendung.
Kann ein KI-Agent Excel-Daten verwenden, um Word-Dokumente zu generieren?
Ja. Spire.Agent.Office kombiniert ein Sprachmodell mit einer deterministischen Word- und Excel-Ebene, sodass die Anweisung verstanden wird und das Ergebnis immer noch eine echte Word-Datei ist, die Ihr Team öffnen, formatieren und verteilen kann. Der Agent interpretiert den Inhalt der Tabelle, anstatt sich auf eine feste Spaltenzuordnung zu verlassen, was heterogene Eingaben erst möglich macht.
Bereit, Ihre Word-Generierung zu automatisieren?
Wenn Ihr Workflow „Excel-Daten werden zu personalisierten Word-Dokumenten“ lautet, ist der schnellste Weg, die Ausgabe zu beschreiben und den Agenten den Rest erledigen zu lassen. Folgen Sie dem Getting Started-Tutorial, um Ihren ersten anweisungsgesteuerten Word-Workflow in .NET auszuführen.
Weiterführende Literatur
- Generieren verschiedener Word-Vorlagen mit Spire.Agent.Office – dasselbe Generierungsmuster angewendet auf verschiedene Word-Vorlagen
- Automatisierung der Analyse und Rangfolge von Schülerergebnissen mit Spire.Agent.Office – ein Excel-seitiger Workflow, der die Dokumente speist, die dieser Artikel generiert
- Spire.Agent.Office Produktübersicht – KI-Agenten-SDKs für jedes Office-Dokumentformat
Создание документов Word из данных Excel на C#
Создание документов Word из данных Excel означает использование строк электронной таблицы в качестве источника для одного или нескольких структурированных файлов Word, обычно на основе шаблона или рабочего процесса генерации документов. Традиционно эта задача решается с помощью функции «Слияние» (Mail Merge) в Word: вы сопоставляете столбцы Excel с полями в шаблоне .docx и позволяете Word создавать по одному документу на каждую строку. Эту же задачу можно автоматизировать на C# с помощью SDK для работы с документами или вывести на новый уровень с помощью ИИ-агента, который выполняет требования на основе инструкций на естественном языке. В этой статье сравниваются различные подходы, рассматриваются ограничения слияния и приводится рабочий пример на C#, построенный на базе Spire.Agent.Office — SDK ИИ-агента для офисных документов.
Быстрая навигация
- Что значит создавать документы Word из Excel?
- Слияние из Excel в Word
- Три способа автоматизации создания Word в .NET
- Создание персонализированных документов Word на C#
- Часто задаваемые вопросы
1. Что значит создавать документы Word из данных Excel?
Эта фраза звучит похоже на «конвертировать Excel в Word», но цель здесь иная. Конвертация .xlsx в .docx меняет формат файла, сохраняя содержимое примерно тем же. Создание документов Word из данных Excel формирует новые документы, содержимое которых извлекается из ячеек таблицы: заказ для каждого клиента, ежемесячный отчет по регионам, пакет писем или этикеток из списка адресов, набор счетов из таблицы заказов.
Суть задачи почти всегда одна и та же:
На обычном языке это звучит так: «У меня есть список клиентов и их заказов в Excel; мне нужен документ Word для каждого из них с их информацией, списком товаров и итоговой суммой». Важно слово извлекается: содержимое документа берется из данных, поэтому это генерация «данные в документ», а не просто смена формата.
Это именно та задача, которой посвящена статья. Ниже мы рассмотрим разные способы её решения и момент, когда стоит перестать настраивать поля вручную.
2. Традиционный способ: Слияние из Excel в Word
На уровне интерфейса стандартным ответом на вопрос «как превратить список Excel во множество документов Word» является Слияние (Mail Merge) в Word. Это функция, о которой думает большинство пользователей, и Microsoft предоставляет пошаговые руководства по её использованию. Механизм прост и понятен:
Вы размещаете поле, например «ИмяКлиента», в шаблоне письма, привязываете его к столбцу Клиент в источнике Excel, запускаете слияние, и Word создает по одному документу на строку с подставленным значением. Поскольку количество строк может исчисляться тысячами, это превращает рутинную работу «открыть файл, скопировать текст, изменить имя» в пакетную операцию без написания кода.
Слияние отлично подходит для одного типа задач: вставить этот столбец в это поле много раз. Письма, конверты, этикетки и уведомления с фиксированной версткой — его стихия. Оно работает внутри Office, не требует программирования, и для таких стабильных документов это действительно подходящий инструмент.
3. Ограничения слияния
Ограничения наступают в тот момент, когда документ перестает быть фиксированной формой с пустыми местами и становится чем-то, что должно зависеть от данных. Слияние подставляет значения; оно не определяет структуру, не анализирует содержимое и не создает ничего нового.
Сравните два запроса. Первый — то, с чем справляется слияние:
«Вставь имя клиента в поле имени, адрес в поле адреса, а заказ в детали заказа».
Второй — то, чем на самом деле является большинство отчетов:
«Прочитай эту книгу Excel, проанализируй данные каждого клиента, создай персонализированный отчет с их товарами и итоговыми суммами, добавь сводку их покупательского поведения и сохрани каждый результат как отдельный документ Word».
Второй запрос не проходит по трем предположениям слияния:
- Структура меняется. Клиенту с тремя позициями в заказе нужен другой объем документа, чем клиенту с тридцатью. Поля слияния предполагают фиксированную верстку; они не могут расширять таблицу на столько строк, сколько требует объем данных.
- Содержимое нужно вычислять, а не копировать. «Обобщить покупательское поведение» и «отметить VIP-клиентов» требует создания текста и принятия решений, которых нет ни в одном столбце. Нет исходного поля, к которому можно было бы привязаться.
- Результат — набор реальных файлов. Каждая запись должна быть отдельным документом Word со своим именем, и рабочий процесс должен выполняться автоматически внутри приложения, а не через мастер Office.
Это честная оценка возможностей слияния: оно отлично справляется с сопоставлением полей, но становится менее подходящим, когда структура документа, содержимое или логика вывода должны меняться в зависимости от данных. Более глубокая потребность — превращение данных в документы — это задача генерации, и именно здесь начинаются пути автоматизации, описанные ниже.
4. Агентный подход: превращение требования в инструкцию
Альтернатива, соответствующая правильной версии проблемы, — это ИИ-агент для документов: слой естественного языка поверх детерминированного движка документов. Вместо перечисления полей шаблона и написания кода для каждого из них, вы описываете желаемый результат, и агент справляется с задачами, которые трудно выразить через традиционное слияние — чтение данных, формирование структуры, написание анализа — в то время как движок документов гарантирует создание корректного файла .docx (или PDF).
Ценность подхода видна в цепочке действий:
Шаги, которые трудно выразить через традиционное слияние — особенно три средних — это именно то, где агент проявляет себя. Он может интерпретировать, что означает столбец («Итого», «Продажи» и «Нетто» могут означать одно и то же понятие под разными заголовками), сформировать структуру документа под каждую запись и составить сводные абзацы. Вы предоставляете предложение, а не карту полей.
Главная мысль этой статьи: слияние сопоставляет столбцы Excel с полями Word; ИИ-агент генерирует документы на основе требования. Первое — это подстановка значений, второе — то, что требовалось на самом деле.
5. Три способа автоматизации создания Word в .NET
Выбор правильного пути важнее, чем сам код, потому что у каждого пути своя кривая затрат. Для приложения .NET, которому нужен такой рабочий процесс, есть три реалистичных варианта:
| Подход | Что требуется | Гибкость | Лучшее применение |
|---|---|---|---|
| Слияние (Mail Merge) | Шаблон .docx с полями слияния + источник Excel; запуск слияния | Сопоставляет один столбец с одним полем; пасует перед переменной структурой и аналитикой | Письма, этикетки, конверты с фиксированной формой |
| Привязка полей через SDK | Загрузка шаблона в коде, открытие книги, цикл по строкам, поиск-замена, сохранение | Детерминированный и тестируемый; вы вручную поддерживаете карту столбцов, любое изменение требует перекомпиляции | Масштабируемое повторение одного стабильного шаблона |
| ИИ-агент | Передача книги как вложения, описание вывода, чтение результата | Обрабатывает переменную структуру, анализ записей, условия, сводки | Документы, зависящие от данных, или процессы, которые часто меняются |
Краткий вывод для большинства случаев:
- Форма никогда не меняется, одно поле на столбец, массовая рассылка — слияние вне конкуренции.
- Форма стабильна, но нужна программная реализация, детерминированность и тесты — используйте цикл привязки полей через SDK.
- Документ должен меняться в зависимости от данных, включать анализ или часто меняться — здесь ИИ-агент окупает себя, так как стоимость изменений часто сводится к обновлению инструкции, а не к переписыванию логики маппинга и верстки.
6. Создание персонализированных документов Word на C#
Конкретный рабочий пример задачи «один документ Word на запись» — это сводка заказа клиента. Входные данные — книга заказов и простой шаблон Word; выходные данные — персонализированный документ для каждого клиента. Полная настройка (токен, пакет и проект) описана в руководстве Getting Started; здесь мы сосредоточимся на самом вызове генерации.
using Spire.Doc;
using Spire.Agent.Office.AI;
using Spire.Agent.Office.Extensions;

AIOptions options = new AIOptions
{
    SpireToken = spireToken,
    WorkDir = @"C:\order-ops\output",   // папка для записи сгенерированных документов
    TimeoutMs = 300000
};

using (Document doc = new Document())
{
    // Шаблон предоставляет якоря для записей; книга — источник данных.
    doc.LoadFromFile(@"C:\order-ops\templates\order-summary-template.docx");

    // savePath = null: одна инструкция создает по одному документу на запись,
    // записанному в папку WorkDir. Никаких циклов C# по строкам.
    AIResult result = doc.AI(options).ExecuteInstruction(
        doc,
        "Прочитай данные заказов клиентов в Q3-orders.xlsx. Создай по одному независимому " +
        "документу Word для каждого клиента, строка за строкой. Включи их контактную " +
        "информацию, каждую позицию с количеством и суммой, итоговые суммы заказа, " +
        "и одноабзацную сводку их покупательского поведения. Отметь клиентов, " +
        "чья сумма превышает 50 000, как VIP. Сохрани каждый документ как отдельный " +
        "файл с именем output_ и именем клиента (например, " +
        "output_acme-order-summary.docx).",
        null,
        new[] { @"C:\order-ops\input\Q3-orders.xlsx" });

    if (result == null || !result.Success)
        throw new InvalidOperationException($"Генерация не удалась: {result?.ErrorMessage}");
}
Три детали важны при запуске. Во-первых, инструкция — это место, где живет логика генерации: анализ («сводка поведения»), условная логика («отметить клиентов выше 50 000») и структура («каждая позиция»). Во-вторых, книга должна быть аккуратной: первая строка — заголовок, одна запись на строку, никаких пустых строк или объединенных ячеек заголовка — те же правила, что ожидает Word. В-третьих, базовый документ задает макет; даже простая структура даст агенту полезную отправную точку. С полностью пустым базовым документом та же инструкция создаст один объединенный документ.
Важно правило именования: документы, которые агент записывает в WorkDir, должны начинаться с префикса output_, иначе SDK не посчитает их сгенерированными файлами.
Расширение .docx в цели сохранения определяет формат вывода; укажите .pdf, и агент экспортирует идентичные документы для распространения без отдельного шага рендеринга.
Ключевые вызовы API
Document.AI(options)— прикрепляет ИИ-процессор к объекту документа WordExecuteInstruction(doc, instruction, savePath, attachments)— запускает генерацию;nullв savePath означает «записать вWorkDir»AIResult.Success/AIResult.ErrorMessage— проверяет результат выполнения и выводит ошибки
7. Что вы написали бы без агента
Для контраста, путь привязки полей через SDK для той же задачи делает всё явно. Ниже приведен упрощенный пример, показывающий объем необходимой логики:
using Spire.Doc;
using Spire.Xls;

foreach (DataRow row in customersTable.Rows)
{
    using (Document doc = new Document())
    {
        doc.LoadFromFile(@"templates\order-summary-template.docx");

        // Поиск и замена по каждому якорю...
        doc.Replace("{{CustomerName}}", row["Customer"].ToString(), true, true);
        doc.Replace("{{TotalAmount}}", row["Amount"].ToString("C"), true, true);

        // Позиции заказа живут на втором листе: вы вручную объединяете их,
        // строите таблицу и вставляете в закладку...
        // Правило «отметить VIP-клиентов» — это if/else, который вы поддерживаете,
        // а сводный абзац — это шаблон, который вы пишете вручную.
        doc.SaveToFile($@"out\{row["Customer"]}-order-summary.docx");
    }
    // ... и каждое новое правило или изменение макета требует правки кода и перекомпиляции.
}
Агент не устраняет необходимость в коде — он устраняет необходимость в коде маппинга и верстки. Разница в том, где живет логика: в индексе столбца и функции поиска-замены или в предложении, которое может прочитать и изменить бизнес-пользователь. Когда бизнес-правила или структура документов часто меняются, подход на естественном языке сокращает объем поддерживаемого кода.
8. Где заканчивается ИИ и начинается логика приложения
Полезная граница — это не «что ИИ может, а что нет», а чем должно владеть приложение. ИИ-агент для генерации документов работает поверх детерминированного кода; он не заменяет его.
Ваше приложение по-прежнему владеет частями, не связанными с пониманием таблицы:
- Доступ к файлам — поиск книги, проверка прав, подготовка входов
- Планирование — когда запускается задача, по какому триггеру
- Контроль источников данных — какая книга является авторизованной
- Обработка ошибок — что делать, если файл отсутствует
- Финальное утверждение — человек проверяет документы перед отправкой
Агент берет на себя семантические шаги:
- Понимание — чтение смысла столбцов из разных книг
- Планирование структуры — определение количества секций и строк
- Анализ — превращение данных в сводку и флаги
- Композиция — сборка персонализированных документов
Оставьте детерминированную «сантехнику» в коде, где она тестируема и аудируема, а семантическую генерацию передайте агенту.
9. Часто задаваемые вопросы
Является ли это заменой слиянию Word?
Это не прямая замена, а развитие той же задачи. Слияние сопоставляет столбцы Excel с полями Word, что достаточно для письма со стабильной формой. ИИ-агент может делать это, а также читать книгу по смыслу, формировать структуру под запись, добавлять анализ и составлять текст. Для простых задач слияние остается хорошим инструментом; когда документ должен меняться в зависимости от данных, агент берет на себя больше работы.
Как создавать несколько документов Word из данных Excel?
Передайте книгу как вложение, установите путь сохранения в null и укажите AIOptions.WorkDir на папку вывода. Один вызов ExecuteInstruction с инструкцией «строка за строкой» заставит агента создать по одному независимому документу на запись.
Можно ли создавать документы Word из Excel без слияния?
Да. На C# вы можете привязать шаблон через SDK напрямую или передать книгу ИИ-агенту, который прочитает её на основе инструкции и вернет реальный .docx или PDF.
В чем разница между слиянием и ИИ-генерацией?
Слияние привязывает определенные поля к определенным столбцам. ИИ-генерация интерпретирует запрос и данные вместе, поэтому может понимать смысл столбцов, формировать структуру, создавать аналитический контент и собирать несколько документов из одной инструкции.
Можно ли создавать персонализированные документы Word из Excel на C#?
Да. Загрузите шаблон Word в Spire.Doc, прикрепите книгу Excel и вызовите ExecuteInstruction с описанием вывода. Агент прочитает каждую запись и составит документ, настроенный под неё.
Готовы автоматизировать создание документов?
Если ваш рабочий процесс — это «данные Excel превращаются в персонализированные документы Word», самый быстрый путь — описать результат и позволить агенту сделать остальное. Следуйте руководству Getting Started, чтобы запустить свой первый рабочий процесс на базе инструкций в .NET.
Дополнительное чтение
Agente de IA para processamento de documentos: o que é e como funciona
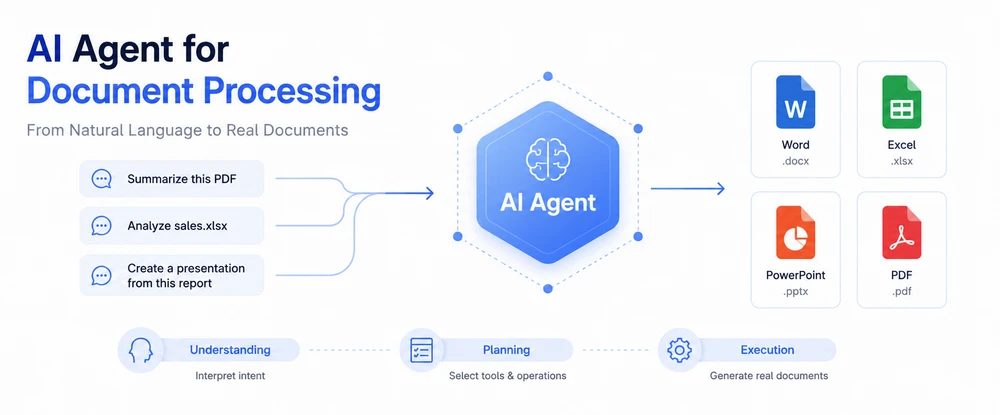
Um agente de IA para processamento de documentos é um sistema de software que utiliza modelos e ferramentas de inteligência artificial para compreender instruções em linguagem natural e realizar tarefas como criar, editar, converter, analisar ou extrair conteúdo de documentos — sem a necessidade de escrever código linha por linha. Um agente de IA pode trabalhar com arquivos Word, Excel, PowerPoint e PDF interpretando a intenção do usuário, selecionando as operações de processamento de documentos apropriadas e produzindo resultados que preservam a estrutura e a formatação do arquivo exigidas.
Os agentes de IA são uma abordagem para automatizar o trabalho relacionado a documentos. Outras abordagens incluem APIs programáticas tradicionais, endpoints de modelos de linguagem brutos usados com código personalizado e mecanismos de fluxo de trabalho que automatizam etapas predefinidas. Este artigo explica o que é o processamento de documentos orientado por IA, como ele difere de métodos anteriores e quando faz sentido utilizá-lo em conjunto com outras tecnologias.
1. O que é Processamento de Documentos com IA?
O processamento de documentos — a atividade de ler, criar, editar, converter, extrair informações ou analisar documentos digitais — sempre foi uma das tarefas de software mais comuns em todos os setores. Faturas por e-mail chegam como PDFs. Relatórios de vendas ficam em pastas de trabalho do Excel com layouts inconsistentes. Manuais de funcionários residem em modelos do Word que mudam todos os anos. Acordos legais aparecem como PDFs digitalizados de terceiros. Por décadas, as organizações escreveram código para gerenciar essa variedade.
As abordagens tradicionais de processamento de documentos compartilham um padrão comum: alguém define o que deve acontecer com quais documentos usando regras explícitas. Um script de preenchimento de modelo lê um CSV e preenche um .docx do Word substituindo espaços reservados predefinidos. Um script Python itera sobre colunas do Excel e chama funções de layout para produzir um relatório estilizado. Uma rotina em C# abre um PDF, procura campos específicos por posição ou padrão regex e grava os resultados de volta em um banco de dados. Esses métodos funcionam bem para fluxos de trabalho estáveis e bem especificados — mas exigem instruções programáticas para cada variação. Quando o modelo muda, quando o formato de entrada muda ou quando novos tipos de documentos entram no pipeline, o código precisa ser reescrito, testado e reimplantado.
O processamento de documentos orientado por IA estende essas mesmas operações introduzindo uma camada de compreensão de linguagem. Em vez de dizer ao software exatamente qual espaço reservado substituir ou qual intervalo de células ler, você descreve qual resultado deseja em linguagem natural: "Resuma este contrato e extraia as condições de pagamento" ou "Compare a planilha de vendas do mês passado com a deste mês e salve a análise como um relatório formatado". O sistema usa um modelo de IA para interpretar essa instrução, determina quais operações de documento são necessárias, executa-as em formatos de arquivo reais e retorna uma saída devidamente estruturada.
Na prática, o processamento de documentos com IA não substitui as abordagens tradicionais — ele as amplia. Tarefas simples e previsíveis ainda podem ser melhor tratadas por scripts baseados em regras, pois são mais rápidas e totalmente determinísticas. Mas quando os documentos variam em estrutura, quando as entradas chegam em formatos imprevisíveis ou quando a pergunta feita a um documento muda com frequência, uma abordagem assistida por IA economiza esforço de engenharia e se adapta mais naturalmente às mudanças nos requisitos.
2. O que é um Agente de IA para Processamento de Documentos?
Um agente de IA para processamento de documentos é um sistema que combina o raciocínio de modelos de linguagem com ferramentas orientadas a documentos, para que uma pessoa possa descrever uma tarefa em termos conversacionais e obter um documento real e bem formado como saída.
A característica definidora de um agente — neste contexto — é que ele une duas capacidades que a maioria dos componentes individuais não possui por conta própria:
- Compreensão. O sistema interpreta instruções de alto nível e em aberto sobre o que fazer com um documento. "Revise este contrato em busca de cláusulas de risco" ou "Transforme estes números trimestrais em uma apresentação de slides" não são consultas estruturadas; elas exigem compreensão semântica.
- Ação. Após entender a intenção, o sistema seleciona e executa operações concretas de documento — ler um arquivo, extrair texto ou tabelas, inserir conteúdo, alterar layout, gerar um novo arquivo — em formatos como
.docx,.xlsx,.pptxou.pdf.
Diferentes fornecedores e grupos de pesquisa usam terminologias ligeiramente diferentes para esses conceitos. Alguns chamam esses sistemas de "assistentes de IA", outros usam "fluxos de trabalho agenticos", "pipelines de documentos autônomos" ou "plataformas de inteligência de documentos". As distinções são sutis e muitas vezes orientadas pelo marketing. O que importa para a avaliação não é o rótulo, mas a capacidade: o sistema consegue interpretar instruções não estruturadas e manipular arquivos de documentos por meio de APIs reais?
Na prática, o termo "agente de documentos" abrange vários tipos de sistemas — incluindo agentes focados em extração que ingerem, classificam e roteiam documentos, e agentes que interpretam diretamente instruções em linguagem natural e manipulam ou geram documentos. Neste artigo, o termo refere-se especificamente a agentes que combinam o raciocínio de modelos de linguagem com APIs de processamento de documentos. Abaixo está uma comparação funcional que distingue um agente de documentos de IA de tecnologias relacionadas. Essas categorias se sobrepõem significativamente — muitos produtos combinam várias delas — mas entender onde cada abordagem se destaca ajuda a esclarecer o que um agente realmente adiciona.
| Abordagem | Força principal | Como lida com instruções | Limitação típica |
|---|---|---|---|
| Apenas endpoint de LLM | Compreensão profunda da linguagem | Interpreta linguagem natural com muita eficácia | Não fornece, por si só, controle determinístico e consciente do formato sobre estruturas de arquivos Office e PDF; produz texto bruto ou HTML, a menos que combinado com ferramentas de processamento de documentos |
| Agente de linguagem natural | Une compreensão com execução de ferramentas | Aceita solicitações de alto nível e encadeia ferramentas apropriadas | Depende da qualidade das ferramentas disponíveis e da lógica de orquestração |
| SDK / API Tradicional | Manipulação de arquivos determinística e precisa | Requer comandos programáticos explícitos; sem compreensão de linguagem | Rígido — cada mudança no modelo ou formato de entrada requer atualizações de código |
| RPA (Automação de Processos Robóticos) | Automatiza interações em nível de interface em aplicativos | Segue fluxos de trabalho roteirizados; alguns RPA modernos incluem visão e OCR | Tem dificuldade com instruções ambíguas que exigem interpretação semântica — RPA (Automação de Processos Robóticos) baseia-se em robôs de software que lidam com dados em aplicativos seguindo regras predefinidas, enquanto agentes interpretam solicitações de linguagem natural em aberto |
| OCR (Reconhecimento Óptico de Caracteres) | Converte imagens / digitalizações em texto legível por máquina | Opera em conteúdo visual; extrai caracteres e layout básico | Não realiza geração de documentos, análise ou fluxos de trabalho de várias etapas |
Essas capacidades geralmente aparecem juntas em sistemas de produção. Um pipeline de documentos corporativo pode usar OCR para digitalizar faturas, passar o texto extraído por um LLM para classificação semântica, rotear o resultado para um fluxo de trabalho de RPA para entrada de dados e, finalmente, gerar um relatório com a marca usando uma API de documentos. Um agente de documentos de IA fica no centro desse pipeline como o componente que entende a solicitação humana e coordena as ferramentas necessárias para atendê-la.
Quando as pessoas pesquisam "o que é processamento de documentos com IA" ou "como funcionam os agentes de documentos com IA", elas geralmente estão tentando entender se comprar ou construir tal sistema é diferente de combinar ferramentas prontas manualmente. A resposta curta: sim — quando a variedade de documentos, a variabilidade das instruções e a fidelidade da formatação importam o suficiente para justificar uma camada de orquestração dedicada entre a compreensão da linguagem e a manipulação de arquivos.
3. Como Funciona um Agente de Documentos com IA?
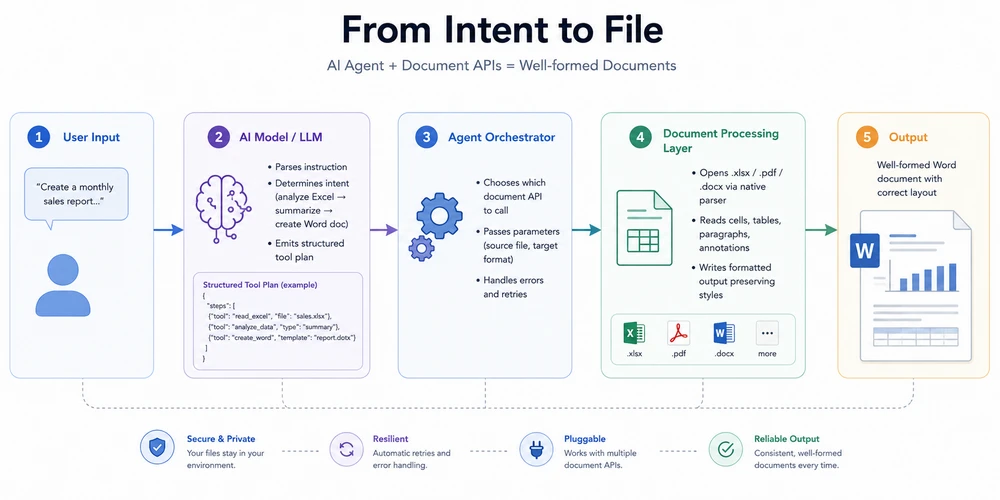
Em um nível alto, um agente de documentos com IA segue cinco estágios conceituais:
Usuário fornece instrução em linguagem natural
     ↓
Modelo de IA interpreta a intenção e identifica as operações necessárias
     ↓
Agente seleciona ferramentas ou APIs de processamento de documentos apropriadas
     ↓
APIs de documentos executam operações em nível de arquivo (ler, modificar, gerar)
     ↓
Documento de saída é gerado usando operações de processamento de documentos determinísticas
Cada estágio introduz decisões que determinam quão precisa, confiável e bem formatada será a saída final. Entender essas decisões esclarece por que um LLM puro, por si só, não pode produzir de forma confiável arquivos Word ou Excel reais — e por que um SDK tradicional, por si só, não pode entender uma solicitação vaga ou em aberto.
Arquitetura: Da Intenção ao Arquivo
Uma implementação típica encadeia cinco camadas, passando o documento por cada estágio, da intenção à saída:
Exemplo: De uma Solicitação em Linguagem Natural a um Documento Finalizado
Considere um cenário que muitas equipes financeiras encontram todos os meses: um gerente envia uma pasta de pastas de trabalho de vendas regionais e pede um relatório de resumo consolidado em formato Word.
A solicitação em linguagem natural de um usuário pode ser algo como:
"Leia todos os arquivos de vendas do 3º trimestre nesta pasta, compare cada região com o trimestre anterior, resuma as principais tendências e valores discrepantes e salve os resultados como um documento Word formatado."
Nos bastidores, o agente decompõe essa frase única em uma sequência de operações:
- Descobrir e abrir cada arquivo
.xlsxno diretório especificado. - Ler linhas de resumo ou planilhas principais de cada pasta de trabalho.
- Calcular as mudanças período a período.
- Identificar as regiões com melhor e pior desempenho.
- Compor um resumo narrativo descrevendo as tendências.
- Criar um novo documento Word, inserir o resumo, adicionar tabelas mostrando comparações regionais e aplicar formatação consistente com os modelos corporativos.
O resultado final — o relatório Word consolidado com o resumo narrativo e as tabelas de comparação regional:

Sem um agente, um desenvolvedor normalmente precisaria construir e orquestrar cada uma dessas seis etapas — escrevendo código para descoberta de arquivos, leitura de dados, cálculo de mudanças, chamada de um LLM para geração de texto, análise de sua resposta e mapeamento para um layout de documento estruturado. Com um agente, as etapas 4–6 podem ser expressas em uma única instrução, enquanto as etapas 1–3 ainda aproveitam as mesmas capacidades de análise de arquivo que seu aplicativo já possui.
Esse tipo de fluxo de trabalho entre formatos — onde a leitura de dados de um tipo de arquivo e a produção de saída em outro requer tanto raciocínio semântico quanto manipulação precisa de arquivos — é exatamente onde os agentes de IA agregam mais valor. Ferramentas como o Spire.Agent.Office agrupam a camada de orquestração com APIs de documentos determinísticas para que os desenvolvedores obtenham uma interface de linguagem natural sem perder o controle sobre a formatação, o layout ou a fidelidade da saída.
4. O que os Agentes de IA Podem Fazer com Documentos?
Dependendo das capacidades das ferramentas de processamento de documentos subjacentes, os agentes de IA podem potencialmente cobrir uma ampla gama de operações de documentos que os desenvolvedores tradicionalmente implementam com código explícito — apenas expressas por intenção em vez de sintaxe. A tabela abaixo mostra categorias de operações representativas que muitas implementações suportam quando suas ferramentas de processamento de documentos subjacentes fornecem essas capacidades.
| Capacidade | Word (.docx/.doc) | Excel (.xlsx/.xls) | PowerPoint (.pptx/.ppt) | PDF (.pdf) |
|---|---|---|---|---|
| Criar do zero ou a partir de dados | Sim — parágrafos, tabelas, títulos, estilos | Sim — planilhas, células, fórmulas, gráficos | Sim — slides, layouts, temas | Sim — seções, blocos de texto, anotações |
| Editar documentos existentes | Sim — inserir, substituir, refazer conteúdo | Sim — atualizar células, reorganizar linhas/colunas | Sim — modificar conteúdo do slide, reordenar | Sim — adicionar/remover páginas, anotar, redigir |
| Converter entre formatos | Sim ↔ PDF, HTML, XPS, Markdown | Sim ↔ CSV, PDF, HTML | Sim ↔ PDF | Sim ↔ DOCX, HTML, formatos de imagem |
| Analisar / Resumir conteúdo | Sim — extrair cláusulas, identificar estrutura | Sim — comparar conjuntos de dados, calcular estatísticas | Sim — revisar narrativas de slides | Sim — classificar páginas, extrair informações-chave |
| Extrair dados (estruturados) | Sim — extrair texto de parágrafos e tabelas | Sim — ler valores de células, intervalos, intervalos nomeados | Limitado — texto e notas do slide | Sim — analisar formulários, tabelas, texto incorporado |
As capacidades reais dependem das bibliotecas de processamento de documentos subjacentes e da implementação específica do agente.
Casos de uso comuns que se enquadram nessas capacidades incluem:
- Revisão de contratos e acordos: Ler PDFs ou arquivos Word recebidos, sinalizar cláusulas incomuns ou disposições ausentes e produzir um resumo em Markdown ou Word.
- Consolidação de relatórios: Agregar planilhas díspares de várias regiões, detectar anomalias e gerar um relatório Word ou PDF pronto para a gerência.
- Geração de apresentações: Inserir um documento de briefing ou conjunto de dados em um modelo de apresentação e produzir um deck de slides finalizado com gráficos e pontos de discussão.
- Processamento de faturas e formulários: Abrir faturas digitalizadas ou digitais, extrair itens de linha e totais, verificar com pedidos de compra e preencher sistemas downstream.
- Manutenção de políticas e manuais: Atualizar documentos de funcionários substituindo nomes, datas e linguagem específica do departamento em dezenas de modelos.
Para equipes que já criam fluxos de trabalho de documentos hoje, essas capacidades não substituem sua lógica existente — elas a estendem. Um agente lida com as partes de um fluxo de trabalho que dependem da comunicação humana (entender o que fazer), enquanto as APIs de documentos subjacentes lidam com as partes que dependem de precisão (produzir o arquivo certo com o layout certo). Veja os tutoriais oficiais sobre geração de contratos em lote e geração de apresentações a partir de documentos para exemplos de como essas operações se encaixam em aplicativos reais.
5. Abordagens para Automação de Documentos
Nem toda organização recorre a um agente de IA ao automatizar fluxos de trabalho de documentos. A escolha da tecnologia depende de quais tipos de documentos você lida, com que frequência eles mudam e quanto esforço de engenharia você tem disponível. Abaixo está uma comparação das principais abordagens que você encontrará na prática.
| Abordagem | Pontos fortes | Limitações | Mais adequado para |
|---|---|---|---|
| Agente de linguagem natural | Interação amigável; mínimo de código repetitivo; adapta-se a formatos de entrada variados | Requer integração com uma camada de processamento de documentos; depende da precisão do modelo para instruções complexas | Equipes que recebem documentos com estruturas inconsistentes e desejam iteração rápida sem recompilar |
| LLM API + código personalizado | Altamente personalizável; escolha os melhores modelos para cada tarefa; controle total sobre a orquestração | Esforço de engenharia significativo para E/S de arquivos, tratamento de erros, formatação e validação | Organizações que já executam uma pilha de LLM e desejam flexibilidade máxima e possuem largura de banda de engenharia |
| SDK / API de documento tradicional | Totalmente determinístico; controle preciso sobre layout, estilo e consistência de saída; sem dependência de modelo em tempo de execução | Requer instruções programáticas explícitas para cada cenário; rígido quando modelos ou estruturas de entrada mudam com frequência | Documentos de formato fixo com estrutura previsível que raramente mudam, como formulários padronizados ou relatórios de conformidade |
| RPA / mecanismo de fluxo de trabalho | Bom para automatizar processos repetíveis baseados em regras em sistemas; aproveita a infraestrutura existente | Menos flexível para tarefas ambíguas ou em aberto; tem dificuldade quando os formatos de documentos variam muito | Processos de back-office com alto volume e baixa variância, como entrada de faturas em sistemas ERP |
Nenhuma dessas abordagens é universalmente superior. Uma estratégia madura de automação de documentos geralmente combina mais de uma. Por exemplo, uma organização pode usar código SDK tradicional para gerar relatórios de conformidade fixos e reservar um agente de IA para tarefas de análise ad-hoc que variam de semana para semana.
Onde uma solução como o Spire.Agent.Office se diferencia é ao oferecer um único SDK que fornece tanto a interface de linguagem natural quanto as capacidades de processamento de documentos determinísticas necessárias para transformar instruções em arquivos reais. Em vez de conectar serviços de LLM separados, bibliotecas de formatação personalizadas e lógica de orquestração, os desenvolvedores adicionam um processador de IA aos seus objetos de documento existentes — uma única chamada AI(options) em qualquer instância de Document, Workbook, Presentation ou PdfDocument — e então emitem instruções em linguagem simples que retornam saída formatada, preservando layout, fontes, tabelas e estilos.
Se você já usa uma biblioteca de documentos tradicional para operações determinísticas, adicionar uma camada de agente geralmente significa envolver o mesmo objeto Document ou Spreadsheet com um processador de IA e substituir a lógica de substituição campo a campo por instruções declarativas. A curva de aprendizado se concentra em escrever prompts eficazes em vez de aprender um novo formato de arquivo.
6. Processamento de Documentos com IA vs Processamento Inteligente de Documentos (IDP)
Se você pesquisou automação de documentos profissionalmente, encontrará vários termos que se sobrepõem: processamento de documentos com IA, processamento inteligente de documentos (ou IDP), inteligência de documentos, automação de documentos com IA e agente de documentos com IA. Entender o relacionamento entre eles ajuda a restringir o que você está realmente procurando — e evita confusão causada pela terminologia dos fornecedores que varia entre os mercados.
No uso comum:
- Processamento de documentos com IA é frequentemente usado como um termo abrangente — refere-se a qualquer abordagem que aplique técnicas de inteligência artificial para entender, criar, editar, converter ou analisar documentos. No entanto, quão ampla ou estreitamente esse termo é definido varia dependendo de a quem você pergunta.
- Processamento Inteligente de Documentos (IDP) originou-se no gerenciamento de documentos corporativos com ênfase na fase de captura e extração: digitalizar ou ingerir documentos, classificá-los por tipo (fatura, recibo, contrato), aplicar OCR, extrair campos, validar regras de negócios e rotear para sistemas downstream. Com o tempo, as fronteiras do que conta como IDP mudaram à medida que os fornecedores incorporam IA generativa em seus produtos.
- Inteligência de documentos é às vezes usada de forma intercambiável com IDP, mas muitas vezes carrega uma ênfase mais forte na extração e compreensão do que na geração. Fornecedores nos espaços de tecnologia jurídica e serviços financeiros preferem essa terminologia.
- Automação de documentos com IA destaca o lado da execução — usar IA para acionar fluxos de trabalho que produzem, enviam ou modificam documentos com base em gatilhos ou solicitações do usuário.
- Agente de documentos com IA foca no aspecto do orquestrador: um sistema que recebe intenção em linguagem natural, planeja as operações necessárias e delega para quaisquer ferramentas necessárias para concluir o trabalho.
Essas definições são convencionais, não formais. Você encontrará diferentes fornecedores estabelecendo limites em pontos diferentes, e muitos produtos abrangem várias categorias simultaneamente. A principal conclusão não é qual rótulo sua ferramenta escolhida carrega, mas se a ferramenta pode fazer o que você realmente precisa: entender uma solicitação, escolher as operações certas, executá-las em arquivos reais e retornar saída estruturada.
Por exemplo, um sistema rotulado como "plataforma de inteligência de documentos" pode se destacar na classificação e extração, mas carecer de fortes capacidades de geração. Um "agente de documentos com IA" pode suportar a geração além da extração, classificação e roteamento, dependendo de suas ferramentas e fluxo de trabalho pretendido. Na prática, as melhores soluções combinam extração, raciocínio e geração sob o mesmo teto — e é por isso que estruturas como o Spire.Agent.Office se posicionam como agentes de ponta a ponta, em vez de soluções pontuais para um único estágio do pipeline.
7. Por que os Agentes de IA são Úteis para Processamento de Documentos
A razão central pela qual os agentes de IA são importantes para o trabalho com documentos é simples: a maioria das tarefas significativas de documentos envolve três requisitos simultaneamente.
Primeiro, o sistema precisa entender o que o usuário deseja. "Prepare um resumo trimestral a partir destes relatórios" não é uma consulta estruturada — ela deixa sem especificar quais arquivos ler, quais métricas extrair, como estruturar a saída e qual tom usar. Um modelo de linguagem se destaca na resolução dessa ambiguidade.
Segundo, o sistema precisa executar ações em arquivos reais. Gerar texto coerente em uma janela de chat é diferente de produzir um .docx com estilos de parágrafo, margens de página, bordas de tabela e gráficos incorporados corretos. Um modelo de linguagem, por si só, não fornece controle determinístico e consciente do formato sobre estruturas de arquivos Office.
Terceiro, o sistema precisa garantir que a saída preserve a estrutura e a formatação. Documentos de negócios carregam restrições que vão além do texto legível: numeração de cláusulas, hierarquias de seção, cabeçalhos de rodapé, campos de mesclagem, regras de formatação condicional. Essas são propriedades estruturais que pertencem ao próprio formato do arquivo, não ao texto simples.
Um SDK tradicional é projetado para abordar #2 e #3 de forma determinística, mas não fornece a compreensão da intenção em nível de linguagem descrita em #1. Uma API de LLM bruta pode abordar #1 de forma eficaz, mas não fornece, por si só, controle determinístico sobre #2 e #3. Combinar os dois — colocar um modelo de linguagem por trás de uma camada de processamento de documentos determinística — é o que torna um agente útil para o trabalho real com documentos.
Organizações que processam grandes volumes de documentos geralmente enfrentam a mesma tensão fundamental: documentos exigem tanto compreensão semântica (para descobrir o que fazer) quanto manipulação determinística de arquivos (para produzir saída formatada corretamente). Os agentes de IA abordam essa tensão combinando ambas as capacidades sob uma única interface.
Analistas do setor esperam que essa combinação se torne a norma, e não a exceção. O Gartner prevê que, até 2028, 33% dos aplicativos de software corporativo incluirão IA agentica, acima de menos de 1% em 2024, e que 15% das decisões de trabalho diárias serão tomadas de forma autônoma — uma mudança com implicações diretas para fluxos de trabalho de negócios pesados em documentos.
8. Perguntas Frequentes
Qual é a diferença entre um agente de documentos com IA e um LLM comum?
Um LLM (Large Language Model) é uma rede neural treinada para gerar e entender texto. Ele opera em sequências de tokens. Por si só, ele não fornece controle determinístico e consciente do formato sobre estruturas de arquivos Office ou PDF — embora sistemas alimentados por LLM possam acessar esses formatos por meio de ferramentas e APIs separadas. Um agente de documentos com IA fica em cima de um LLM (ou modelo semelhante) e o conecta a ferramentas de processamento de documentos que podem abrir arquivos .docx, .xlsx, .pptx e .pdf, executar operações neles e produzir saída bem formada. O LLM fornece a compreensão; o agente fornece a ponte para arquivos reais.
Preciso enviar documentos para a nuvem para usar um agente de documentos com IA?
Não necessariamente. Muitos agentes de documentos com IA podem ser executados inteiramente dentro de sua própria infraestrutura — o SDK ou serviço é executado localmente ou em uma nuvem privada, e os documentos permanecem dentro do seu ambiente. Para analisar o conteúdo, as camadas de texto relevantes são transmitidas ao modelo subjacente, que pode residir em uma API hospedada ou localmente, dependendo da configuração. Se a privacidade dos dados for uma preocupação, procure soluções que suportem a implantação local de modelos ou permitam configurar de onde as chamadas de modelo se originam.
Quais formatos de documento os agentes de IA suportam?
Os agentes de documentos com IA podem suportar uma ampla gama de formatos, mas o conjunto exato varia consideravelmente de acordo com a implementação. Alguns agentes focam principalmente em fluxos de trabalho de PDF e OCR baseados em imagem, enquanto outros lidam com formatos de arquivo completos do Microsoft Office, incluindo Word (.docx, .doc), Excel (.xlsx, .xls) e PowerPoint (.pptx, .ppt). Muitos também suportam formatos intermediários, como HTML, Markdown, XPS, CSV e tipos de imagem comuns para fins de conversão. Verifique a documentação para quaisquer limitações específicas do produto em relação a arquivos criptografados, formatos binários legados ou modelos especializados.
Posso usar meu próprio modelo de IA com um SDK de agente de documentos?
Alguns SDKs de agente de documentos suportam integração flexível de modelos, permitindo que os desenvolvedores configurem o provedor ou endpoint usado pelo agente. Você geralmente pode escolher entre serviços hospedados como OpenAI ou Azure OpenAI, modelos de código aberto executados em seu ambiente ou endpoints proprietários fornecidos pelo fornecedor do SDK. Os provedores suportados variam de acordo com a implementação, portanto, consulte o guia de integração do produto específico que você está avaliando.
Como um agente de documentos com IA difere das ferramentas de RPA ou OCR?
O RPA (Automação de Processos Robóticos) automatiza principalmente fluxos de trabalho e interações predefinidos, enquanto os agentes de IA podem interpretar instruções de nível superior e selecionar dinamicamente ferramentas ou ações com base no contexto. Os sistemas de RPA modernos às vezes incorporam OCR, PNL ou até mesmo os próprios LLMs, mas seu paradigma central permanece a automação de processos baseada em regras.
O OCR (Reconhecimento Óptico de Caracteres) converte principalmente o conteúdo visual do documento em texto legível por máquina, enquanto um agente de documentos com IA pode usar o OCR como um componente em um fluxo de trabalho mais amplo que inclui interpretação e operações de documentos. Na prática, os agentes frequentemente invocam o OCR internamente ao lidar com documentos digitalizados, mas vão muito além da extração de texto para gerar, formatar e estruturar novos arquivos a partir do que encontram.
O processamento de documentos com IA é adequado para fluxos de trabalho corporativos?
O processamento de documentos com IA é cada vez mais adequado para uso corporativo, mas a prontidão depende de vários fatores práticos. No lado positivo, os agentes de documentos modernos fornecem manipulação de arquivos determinística que garante que a saída corresponda aos modelos corporativos e diretrizes de marca. Eles são executados dentro de pilhas de aplicativos existentes sem exigir que os usuários aprendam novas interfaces.
As principais considerações antes da implantação incluem privacidade de dados (como e onde o texto do documento é transmitido), confiabilidade do modelo (lidar com casos extremos onde as instruções são ambíguas), processos de revisão humana para documentos confidenciais e a capacidade de configurar o comportamento de fallback quando uma chamada de modelo falha. As empresas que testam um agente para tarefas de baixo risco primeiro — memorandos internos, resumos de rascunho, modelos não compatíveis — geralmente alcançam implantações de produção mais rapidamente do que aquelas que tentam a implementação em toda a empresa no primeiro dia.
Qual é a diferença entre processamento de documentos com IA e Processamento Inteligente de Documentos (IDP)?
O Processamento Inteligente de Documentos (IDP) normalmente se refere a sistemas focados em empresas que se especializam na fase de captura e extração de fluxos de trabalho de documentos: ingerir documentos, classificá-los por tipo, aplicar OCR, extrair campos estruturados, validar regras de negócios e rotear para sistemas downstream. O processamento de documentos com IA é um termo abrangente mais amplo que engloba o IDP, mas também inclui geração, transformação, fluxos de trabalho entre formatos e automação interativa baseada em agentes.
Uma maneira útil de pensar sobre a distinção é que o IDP tradicionalmente enfatiza a ingestão, classificação, extração, validação e orquestração de fluxo de trabalho downstream de documentos, enquanto o processamento de documentos com IA é frequentemente usado de forma mais ampla para incluir análise, geração, transformação e raciocínio baseado em agentes. As duas categorias se sobrepõem cada vez mais à medida que os fornecedores incorporam capacidades generativas em plataformas de IDP e os agentes adotam pipelines de extração estruturados.
Pronto para Experimentar o Processamento de Documentos com IA?
O processamento de documentos orientado por IA abrange uma ampla gama de casos de uso, desde a simples geração de relatórios até fluxos de trabalho complexos entre formatos que combinam análise de dados, sumarização e saída estruturada. Se você está avaliando opções para integrar agentes de IA em um aplicativo .NET, comece com o tutorial oficial de Introdução e, em seguida, explore guias específicos sobre geração de contratos e automação de apresentações.
Leitura Adicional
- Visão geral do produto Spire.Agent.Office — SDK de agente de IA para processamento de documentos Word, Excel, PowerPoint e PDF
- Tutorial de Geração de Contratos em Lote — gerando contratos a partir de modelos e fontes de dados
- Gerar PPT a partir de Documentos — transformando Word, PDF e outros formatos em apresentações
- Automatizar Análise e Classificação de Notas de Alunos no Excel — análise de dados e classificação com agentes de IA
- Gerar Vários Modelos Word — construindo modelos que o agente pode preencher
문서 처리를 위한 AI 에이전트: 정의 및 작동 원리
문서 처리를 위한 AI 에이전트는 인공지능 모델과 도구를 사용하여 자연어 지시를 이해하고, 한 줄 한 줄 코드를 작성하지 않고도 문서 생성, 편집, 변환, 분석, 콘텐츠 추출과 같은 작업을 수행하는 소프트웨어 시스템입니다. AI 에이전트는 사용자의 의도를 해석하고 적절한 문서 처리 작업을 선택하여 필요한 파일 구조와 서식을 유지하는 결과물을 생성함으로써 Word, Excel, PowerPoint 및 PDF 파일과 연동하여 작업할 수 있습니다.
AI 에이전트는 문서 관련 작업을 자동화하는 여러 접근 방식 중 하나입니다. 다른 접근 방식으로는 기존의 프로그래밍 방식 API, 사용자 지정 코드와 함께 사용되는 순수 언어 모델 엔드포인트, 사전 정의된 단계를 자동화하는 워크플로 엔진 등이 있습니다. 이 문서에서는 AI 기반 문서 처리가 무엇인지, 이전 방식과 어떻게 다른지, 그리고 다른 기술과 함께 사용하기에 적합한 시점이 언제인지 설명합니다.
1. AI 문서 처리란 무엇인가요?
디지털 문서를 읽고, 생성하고, 편집하고, 변환하고, 정보를 추출하거나 분석하는 문서 처리 활동은 언제나 다양한 산업 전반에서 가장 흔한 소프트웨어 작업 중 하나였습니다. 이메일 청구서는 PDF로 도착합니다. 매출 보고서는 일관되지 않은 레이아웃의 Excel 통합 문서에 들어 있습니다. 직원 핸드북은 매년 변경되는 Word 템플릿으로 작성됩니다. 법적 계약서는 외부 당사자가 스캔한 PDF로 전달됩니다. 수십 년 동안 기업과 조직은 이러한 다양성을 관리하기 위해 코드를 작성해 왔습니다.
기존의 문서 처리 방식은 명시적인 규칙을 사용하여 어떤 문서에 무엇을 해야 하는지 정의하는 공통적인 패턴을 공유합니다. 템플릿 채우기 스크립트는 CSV를 읽고 사전 정의된 자리 표시자를 대체하여 Word .docx 파일 데이터를 채웁니다. Python 스크립트는 Excel 열을 순회하고 레이아웃 함수를 호출하여 스타일이 적용된 보고서를 만듭니다. C# 루틴은 PDF를 열고 위치나 정규식(regex) 패턴으로 특정 필드를 검색한 다음 결과를 다시 데이터베이스에 기록합니다. 이러한 방식은 안정적이고 명확하게 지정된 워크플로에는 잘 작동하지만, 모든 변형에 대해 프로그래밍 방식의 지시가 필요합니다. 템플릿이 변경되거나, 입력 형식이 바뀌거나, 새로운 문서 유형이 파이프라인에 들어오면 코드를 다시 작성하고 테스트한 뒤 재배포해야 합니다.
AI 기반 문서 처리는 언어 이해 레이어를 도입하여 동일한 작업을 확장합니다. 소프트웨어에 대체할 정확한 자리 표시자나 읽을 셀 범위를 일일이 알려주는 대신, 자연어로 원하는 결과를 설명합니다. 예를 들어 "이 계약서를 요약하고 지불 조건을 추출해 줘" 또는 "지난달 매출 스프레드시트와 이번 달 스프레드시트를 비교하고 분석 결과를 서식이 지정된 보고서로 저장해 줘"와 같이 지시합니다. 시스템은 AI 모델을 사용하여 해당 지시를 해석하고, 필요한 문서 작업을 결정하며, 실제 파일 형식에 대해 이를 실행하고, 올바르게 구조화된 결과물을 반환합니다.
실제 적용에 있어 AI 문서 처리는 기존 방식을 완전히 대체하는 것이 아니라 보완합니다. 단순하고 예측 가능한 작업은 속도가 빠르고 완전히 결정론적(deterministic)이기 때문에 여전히 규칙 기반 스크립트로 처리하는 것이 더 나을 수 있습니다. 그러나 문서 구조가 다양하거나, 입력 형식이 예측할 수 없게 들어오거나, 문서에 요구되는 질문이 자주 변경되는 경우 AI 지원 방식은 엔지니어링 공수를 줄여주고 변화하는 요구 사항에 더욱 자연스럽게 적응합니다.
2. 문서 처리를 위한 AI 에이전트란 무엇인가요?
문서 처리를 위한 AI 에이전트는 언어 모델의 추론 능력과 문서 지향 도구를 결합한 시스템으로, 사용자가 대화 형식으로 작업을 설명하면 정교하고 완성도 높은 실제 문서를 결과물로 반환합니다.
이러한 맥락에서 에이전트의 결정적인 특징은 개별 구성 요소가 단독으로는 가질 수 없는 다음 두 가지 기능을 연결한다는 점입니다.
- 이해 (Understanding): 시스템은 문서로 수행할 작업에 대한 개방형의 고차원 지시를 해석합니다. "이 계약서에서 위험한 조항이 있는지 검토해 줘" 또는 "이 분기별 수치를 발표용 슬라이드 덱으로 만들어 줘"와 같은 요청은 구조화된 쿼리가 아니므로 의미론적 이해(semantic comprehension)가 필요합니다.
- 실행 (Action): 의도를 파악한 후 시스템은 파일 읽기, 텍스트 또는 표 추출, 콘텐츠 삽입, 레이아웃 변경, 새 파일 생성 등 콘크리트 문서 작업을 선택하여
.docx,.xlsx,.pptx,.pdf와 같은 형식으로 실행합니다.
다양한 공급업체와 연구 그룹은 이러한 개념에 대해 약간씩 다른 용어를 사용합니다. 어떤 곳에서는 "AI 어시스턴트"라고 부르고, 다른 곳에서는 "에이전틱 워크플로(agentic workflows)", "자율형 문서 파이프라인" 또는 "문서 지능 플랫폼"이라는 용어를 사용합니다. 그 차이는 미묘하며 대부분 마케팅 관점에서 비롯됩니다. 평가에 중요한 것은 라벨이 아니라 기능입니다. 즉, 시스템이 비구조화된 지시를 해석하는 것과 동시에 실제 API를 통해 문서 파일을 조작할 수 있는지 여부입니다.
실제 적용 시 "문서 에이전트"라는 용어는 문서를 수집, 분류 및 라우팅하는 추출 중심 에이전트, 자연어 지시를 직접 해석하여 문서를 조작하거나 생성하는 에이전트 등 여러 유형의 시스템을 아우릅니다. 이 문서에서 이 용어는 특히 언어 모델의 추론 능력과 문서 처리 API를 결합한 에이전트를 가리킵니다. 아래는 AI 문서 에이전트와 관련 기술을 구분하는 기능적 비교입니다. 이러한 범주는 상당 부분 중첩되며(많은 제품이 여러 범주를 결합함) 각 접근 방식이 뛰어난 부분을 이해하면 에이전트가 실제로 추가하는 가치가 무엇인지 명확히 알 수 있습니다.
| 접근 방식 | 주요 강점 | 지시 처리 방식 | 일반적인 한계점 |
|---|---|---|---|
| LLM 엔드포인트 단독 | 깊은 언어 이해 능력 | 자연어를 매우 효과적으로 해석함 | 그 자체로는 Office 및 PDF 파일 구조에 대한 결정론적이고 서식을 인식하는 제어를 제공하지 못함. 문서 처리 도구와 결합되지 않으면 순수 텍스트나 HTML만 생성함 |
| 자연어 에이전트 | 이해 능력과 도구 실행을 연결함 | 고차원 요청을 수용하고 적절한 도구를 체인으로 엮음 | 사용 가능한 도구의 품질 및 오케스트레이션 로직에 의존함 |
| 기존 SDK / API | 결정론적이고 정밀한 파일 조작 | 명시적인 프로그래밍 명령이 필요함. 언어 이해 능력 없음 | 경직됨—템플릿이나 입력 형식이 변경될 때마다 코드를 업데이트해야 함 |
| RPA (로봇 프로세스 자동화) | 애플리케이션 간 UI 수준의 상호작용 자동화 | 스크립트화된 워크플로를 따름. 일부 현대적 RPA는 비전 및 OCR 포함 | 의미론적 해석이 필요한 모호한 지시 처리에 어려움을 겪음 — RPA(Robotic Process Automation)는 사전 정의된 규칙에 따라 애플리케이션 간 데이터를 처리하는 소프트웨어 로봇 기반인 반면, 에이전트는 개방형 자연어 요청을 해석함 |
| OCR (광학 문자 인식) | 이미지/스캔본을 기계가 읽을 수 있는 텍스트로 변환 | 시각적 콘텐츠를 대상으로 작동하며 문자 및 기본 레이아웃 추출 | 문서 생성, 분석 또는 다단계 워크플로를 수행하지 않음 |
이러한 기능들은 실제 프로덕션 시스템에서 함께 나타나는 경우가 많습니다. 엔터프라이즈 문서 파이프라인은 OCR을 사용하여 스캔한 청구서를 디지털화하고, 추출된 텍스트를 LLM에 전달하여 의미론적 분류를 수행하며, 결과를 RPA 워크플로로 전달하여 데이터를 입력하고, 마지막으로 문서 API를 사용하여 브랜드 보고서를 생성할 수 있습니다. AI 문서 에이전트는 인간의 요청을 이해하고 이를 이행하는 데 필요한 도구를 조율하는 구성 요소로서 이러한 파이프라인의 중심에 위치합니다.
사람들이 "AI 문서 처리란 무엇인가" 또는 "AI 문서 에이전트는 어떻게 작동하는가"를 검색할 때, 그들은 보통 이러한 시스템을 구매하거나 구축하는 것이 상용 도구를 수동으로 조합하는 것과 어떻게 다른지 이해하려 합니다. 간단한 답변은 그렇다는 것입니다. 문서의 다양성, 지시의 가변성, 서식 정밀도가 언어 이해와 파일 조작 사이에 전용 오케스트레이션 레이어를 둘 만큼 정당화될 때 차별점이 나타납니다.
3. AI 문서 에이전트는 어떻게 작동하나요?
고차원적인 관점에서 AI 문서 에이전트는 개념적으로 다음 5단계를 따릅니다.
사용자가 자연어 지시 제공
     ↓
AI 모델이 의도를 해석하고 필요한 작업 식별
     ↓
에이전트가 적절한 문서 처리 도구 또는 API 선택
     ↓
문서 API가 파일 수준의 작업 실행 (읽기, 수정, 생성)
     ↓
결정론적 문서 처리 작업을 사용하여 출력 문서 생성
각 단계마다 최종 출력의 정확성, 신뢰성, 서식 완성도를 결정하는 선택이 이루어집니다. 이러한 결정을 이해하면 왜 순수 LLM만으로는 실제 Word나 Excel 파일을 안정적으로 생성할 수 없는지, 그리고 기존 SDK만으로는 모호하거나 개방형인 요청을 왜 이해할 수 없는지 명확해집니다.
아키텍처: 의도에서 파일까지
일반적인 구현은 5개 레이어를 체인으로 구성하여 의도 파악부터 출력까지 문서를 각 단계로 전달합니다.
예시: 자연어 요청부터 완성된 문서까지
많은 재무 팀이 매달 겪는 시나리오를 고려해 보겠습니다. 관리자가 지역별 매출 통합 문서가 담긴 폴더를 보내며 Word 형식의 통합 요약 보고서를 요청합니다.
사용자의 자연어 요청은 다음과 같을 수 있습니다.
"이 폴더에 있는 모든 3분기 매출 파일을 읽고, 각 지역을 이전 분기와 비교한 뒤, 주요 동향과 특이사항을 요약하여 결과를 서식이 지정된 Word 문서로 저장해 줘."
백그라운드에서 에이전트는 이 단일 문장을 일련의 작업 시퀀스로 분해합니다.
- 지정된 디렉터리에서 모든
.xlsx파일을 탐색하고 엽니다. - 각 통합 문서에서 요약 행이나 주요 시트를 읽습니다.
- 전분기 대비(PoP) 변화량을 계산합니다.
- 최고 실적 지역과 저조한 실적 지역을 식별합니다.
- 동향을 설명하는 줄글 요약을 작성합니다.
- 새 Word 문서를 생성하고, 요약을 삽입하고, 지역별 비교를 보여주는 표를 추가하며, 기업 템플릿에 부합하는 서식을 적용합니다.
완성된 최종 결과물—줄글 요약과 지역별 비교 표가 포함된 통합 Word 보고서:
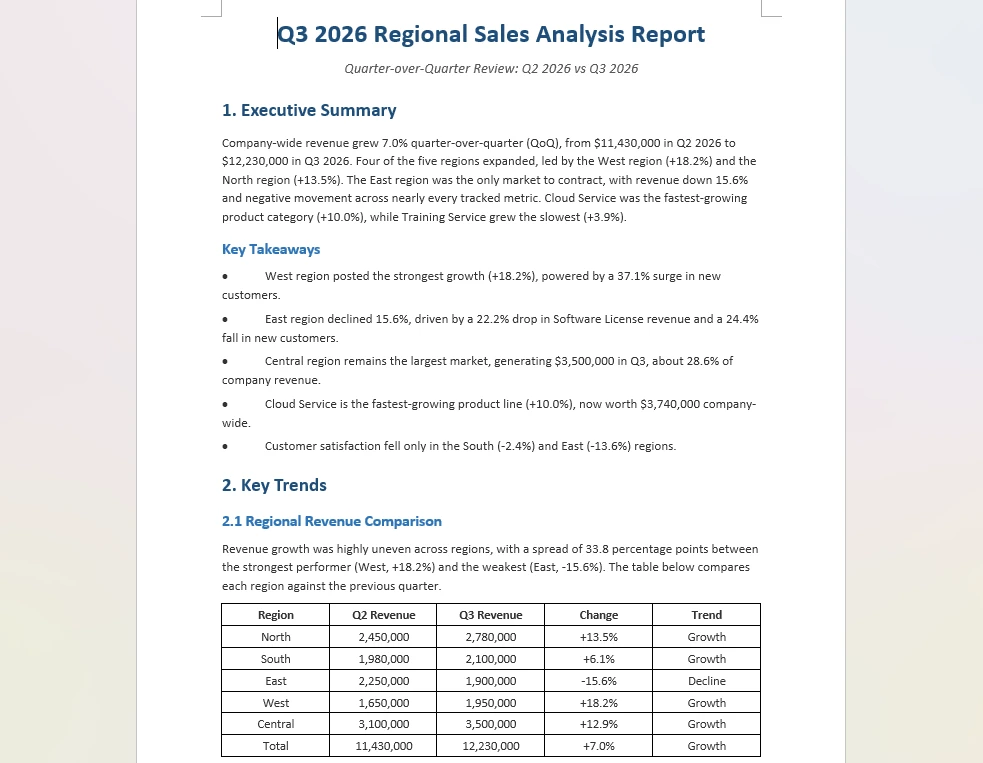
에이전트가 없다면 개발자는 일반적으로 파일 탐색, 데이터 읽기, 변화량 계산, 글 생성용 LLM 호출, 응답 파싱, 구조화된 문서 레이아웃으로의 매핑 등 6개 단계를 각각 직접 구축하고 조율해야 합니다. 에이전트를 사용하면 4~6단계는 단일 지시로 표현할 수 있으며, 1~3단계는 애플리케이션이 이미 보유한 동일한 파일 파싱 기능을 그대로 활용합니다.
한 유형의 파일에서 데이터를 읽고 다른 유형의 결과물을 생성하는 데 의미론적 추론과 정밀한 파일 조작이 모두 필요한 이와 같은 교차 형식(cross-format) 워크플로는 AI 에이전트가 가장 큰 가치를 제공하는 영역입니다. Spire.Agent.Office와 같은 도구는 오케스트레이션 레이어를 결정론적 문서 API와 함께 패키지화하므로 개발자는 서식, 레이아웃 또는 출력 정밀도에 대한 제어를 잃지 않고도 자연어 인터페이스를 얻을 수 있습니다.
4. AI 에이전트는 문서로 어떤 작업을 할 수 있나요?
기반 문서 처리 도구의 기능에 따라 AI 에이전트는 개발자가 기존에 명시적 코드로 구현했던 광범위한 문서 작업을 구문(syntax)이 아닌 의도(intent) 표현을 통해 잠재적으로 다룰 수 있습니다. 아래 표는 기본 문서 처리 도구가 해당 기능을 제공할 때 많은 구현체가 지원하는 대표적인 작업 범주를 보여줍니다.
| 기능 | Word (.docx/.doc) | Excel (.xlsx/.xls) | PowerPoint (.pptx/.ppt) | PDF (.pdf) |
|---|---|---|---|---|
| 빈 상태 또는 데이터로부터 생성 | 가능 — 단락, 표, 제목, 스타일 | 가능 — 시트, 셀, 수식, 차트 | 가능 — 슬라이드, 레이아웃, 테마 | 가능 — 섹션, 텍스트 블록, 주석 |
| 기존 문서 편집 | 가능 — 콘텐츠 삽입, 교체, 줄바꿈 조정 | 가능 — 셀 업데이트, 행/열 재배치 | 가능 — 슬라이드 내용 수정, 순서 변경 | 가능 — 페이지 추가/삭제, 주석, 마스킹(redact) |
| 형식 간 변환 | 가능 ↔ PDF, HTML, XPS, Markdown | 가능 ↔ CSV, PDF, HTML | 가능 ↔ PDF | 가능 ↔ DOCX, HTML, 이미지 형식 |
| 콘텐츠 분석 / 요약 | 가능 — 조항 추출, 구조 식별 | 가능 — 데이터셋 비교, 통계 계산 | 가능 — 슬라이드 내러티브 검토 | 가능 — 페이지 분류, 핵심 정보 추출 |
| 데이터 추출 (구조화) | 가능 — 단락 및 표에서 텍스트 추출 | 가능 — 셀 값, 범위, 이름 지정된 범위 읽기 | 제한적 — 슬라이드 텍스트 및 슬라이드 노트 | 가능 — 양식, 표, 임베디드 텍스트 파싱 |
실제 기능은 기반 문서 처리 라이브러리 및 특정 에이전트 구현 방식에 따라 다릅니다.
이러한 기능에 해당하는 일반적인 사용 사례는 다음과 같습니다.
- 계약서 및 합의서 검토: 수신된 PDF 또는 Word 파일을 읽고, 이례적인 조항이나 누락된 규정을 표시하며, Markdown 또는 Word 요약 보고서를 만듭니다.
- 보고서 통합: 여러 지역의 서로 다른 스프레드시트를 집계하고, 이상징후를 감지하며, 경영진 보고용 Word 또는 PDF 보고서를 생성합니다.
- 프레젠테이션 생성: 브리핑 문서나 데이터셋을 프레젠테이션 템플릿에 입력하여 차트와 발표용 포인트가 포함된 완성된 슬라이드 덱을 만듭니다.
- 청구서 및 양식 처리: 스캔본 또는 디지털 청구서를 열고, 품목 및 합계를 추출하며, 구매 주문서와 비교 검증한 뒤 다운스트림 시스템에 입력합니다.
- 규정 및 핸드북 유지 관리: 수십 개의 템플릿에 걸쳐 이름, 날짜, 부서별 문구를 교체하여 직원 문서를 업데이트합니다.
이미 문서 워크플로를 구축하고 있는 팀의 경우 이러한 기능이 기존 로직을 대체하는 것이 아니라 확장합니다. 에이전트는 인간과의 커뮤니케이션에 의존하는 워크플로 부분(할 일 이해)을 처리하고, 기반 문서 API는 정밀도에 의존하는 부분(올바른 레이아웃의 올바른 파일 생성)을 처리합니다. 이러한 작업이 실제 애플리케이션에 어떻게 적용되는지에 대한 예는 배치 계약서 생성 및 문서에서 프레젠테이션 생성에 관한 공식 튜토리얼을 참조하세요.
5. 문서 자동화 접근 방식
문서 워크플로를 자동화할 때 모든 조직이 AI 에이전트를 선택하는 것은 아닙니다. 기술 선택은 다루는 문서의 종류, 변경 빈도, 사용 가능한 엔지니어링 공수에 따라 달라집니다. 아래는 실제 현장에서 접하게 되는 주요 접근 방식을 비교한 것입니다.
| 접근 방식 | 강점 | 한계점 | 최적의 사용 사례 |
|---|---|---|---|
| 자연어 에이전트 | 사용자 친화적 상호작용, 보일러플레이트 코드 최소화, 다양한 입력 형식에 유연하게 적응 | 문서 처리 레이어와의 통합 필요, 복잡한 지시에 대해 모델 정확도에 의존함 | 일관되지 않은 구조의 문서를 수신하며 재컴파일 없이 빠른 반복을 원하는 팀 |
| LLM API + 사용자 지정 코드 | 높은 맞춤 설정 가능, 각 작업에 최적의 모델 선택 가능, 오케스트레이션 완전 제어 | 파일 I/O, 예외 처리, 서식 지정 및 검증에 상당한 엔지니어링 공수 소요 | 이미 LLM 스택을 운용 중이며 최대 유연성과 엔지니어링 여력이 있는 조직 |
| 기존 문서 SDK / API | 완전한 결정론, 레이아웃·스타일·출력 일관성에 대한 정밀 제어, 런타임 시 모델 의존성 없음 | 모든 시나리오에 대해 명시적 프로그래밍 지시 필요, 템플릿이나 입력 구조가 자주 바뀔 때 경직됨 | 표준화된 양식이나 규정 준수 보고서와 같이 거의 변경되지 않고 예측 가능한 구조의 고정 형식 문서 |
| RPA / 워크플로 엔진 | 시스템 간 반복적이고 규칙 기반인 프로세스 자동화에 유용, 기존 인프라 활용 | 모호하거나 개방형인 작업에 덜 유연함, 문서 형식이 크게 다를 때 어려움을 겪음 | ERP 시스템으로의 청구서 입력과 같이 볼륨이 크고 변형이 적은 백오피스 프로세스 |
이러한 접근 방식 중 어느 하나가 보편적으로 우수하다고 할 수는 없습니다. 성숙한 문서 자동화 전략은 여러 방식을 결합하는 경우가 많습니다. 예를 들어, 조직은 고정된 규정 준수 보고서 생성에는 기존 SDK 코드를 사용하고, 주마다 변경되는 임시 분석 작업에는 AI 에이전트를 지정할 수 있습니다.
Spire.Agent.Office와 같은 솔루션이 차별화되는 지점은 지시 사항을 실제 파일로 전환하는 데 필요한 자연어 인터페이스와 결정론적 문서 처리 기능을 모두 제공하는 단일 SDK를 제공한다는 것입니다. 개별 LLM 서비스, 사용자 지정 서식 라이브러리, 오케스트레이션 로직을 조합하는 대신, 개발자는 기존 문서 개체에 AI 프로세서를 추가하기만 하면 됩니다 — 모든 Document, Workbook, Presentation 또는 PdfDocument 인스턴스에서 단일 AI(options) 호출 — 이후 일상적인 언어로 지시를 내리면 레이아웃, 글꼴, 표 및 스타일을 유지하면서 서식이 적용된 결과물이 반환됩니다.
결정론적 작업을 위해 이미 기존 문서 라이브러리를 사용하고 있다면 에이전트 레이어를 추가한다는 것은 일반적으로 동일한 Document 또는 Spreadsheet 개체를 AI 프로세서로 감싸고 필드별 교체 로직을 선언적 지시로 바꾸는 것을 의미합니다. 학습 곡선은 새로운 파일 형식을 배우는 대신 효과적인 프롬프트를 작성하는 데 집중됩니다.
6. AI 문서 처리 vs 지능형 문서 처리 (IDP)
문서 자동화를 전문적으로 조사하다 보면 중첩되는 여러 용어를 접하게 됩니다: AI 문서 처리, 지능형 문서 처리(또는 IDP), 문서 지능, AI 문서 자동화, AI 문서 에이전트. 이들의 관계를 이해하면 실제로 찾고 있는 것이 무엇인지 명확히 할 수 있으며 시장마다 다르게 사용되는 솔루션 업체의 용어로 인한 혼란을 피할 수 있습니다.
일반적인 쓰임새는 다음과 같습니다.
- AI 문서 처리(AI Document Processing)는 흔히 광범위한 상위 개념으로 사용됩니다 — 인공지능 기술을 적용하여 문서를 이해, 생성, 편집, 변환 또는 분석하는 모든 접근 방식을 의미합니다. 그러나 이 용어가 얼마나 넓게 또는 좁게 정의되는지는 묻는 대상에 따라 다릅니다.
- 지능형 문서 처리(IDP)는 캡처 및 추출 단계에 초점을 맞춘 엔터프라이즈 문서 관리에서 유래했습니다: 문서 스캔 또는 수집, 유형별 분류(청구서, 영수증, 계약서), OCR 적용, 필드 추출, 비즈니스 규칙 대비 검증, 다운스트림 시스템으로의 라우팅. 시간이 지남에 따라 솔루션 업체들이 생성형 AI를 제품에 도입함에 따라 IDP의 경계도 변화했습니다.
- 문서 지능(Document Intelligence)은 때로 IDP와 혼용되지만, 생성보다는 추출과 이해에 더 강한 중점을 두는 경우가 많습니다. 리걸테크 및 금융 서비스 분야의 솔루션 업체들이 이 용어를 선호합니다.
- AI 문서 자동화(AI Document Automation)는 트리거 또는 사용자 요청에 따라 문서를 생성, 전송 또는 수정하는 워크플로를 트리거하기 위해 AI를 사용하는 실행 측면을 강조합니다.
- AI 문서 에이전트(AI Document Agent)는 오케스트레이터(조율자) 측면에 집중합니다: 자연어 의도를 수신하고, 필요한 작업을 계획하며, 작업을 완료하는 데 필요한 도구에 위임하는 시스템입니다.
이러한 정의는 공식적인 규정이라기보다는 관습적인 구분입니다. 업체마다 서로 다른 지점에 경계를 설정하며, 다수의 제품이 여러 범주에 동시에 걸쳐 있습니다. 핵심은 선택한 도구에 어떤 라벨이 붙어 있는지보다는, 그 도구가 실제로 필요한 작업(요청 이해, 올바른 작업 선택, 실제 파일에 대한 실행, 구조화된 결과물 반환)을 수행할 수 있느냐는 점입니다.
예를 들어 "문서 지능 플랫폼"이라는 라벨이 붙은 시스템은 분류와 추출에는 뛰어나지만 생성 기능은 부족할 수 있습니다. 반면 "AI 문서 에이전트"는 도구와 의도된 워크플로에 따라 추출, 분류, 라우팅 외에도 생성 기능을 지원할 수 있습니다. 실제 구현에서는 추출, 추론, 생성을 한데 모으는 최상의 솔루션이 선호되며, 이것이 Spire.Agent.Office와 같은 프레임워크가 파이프라인의 단일 단계를 위한 부분 솔루션이 아닌 엔드투엔드 에이전트로 자리매김하는 이유입니다.
7. AI 에이전트가 문서 처리에 유용한 이유
AI 에이전트가 문서 작업에서 중요한 핵심 이유는 간단합니다. 대부분의 의미 있는 문서 작업은 다음 세 가지 요구 사항을 동시에 수용해야 하기 때문입니다.
첫째, 시스템은 사용자가 무엇을 원하는지 이해해야 합니다. "이 보고서들로 분기 요약을 작성해 줘"라는 요청은 구조화된 쿼리가 아닙니다. 어떤 파일을 읽을지, 어떤 지표를 추출할지, 출력 구조를 어떻게 만들지, 어떤 톤을 사용할지 지정되어 있지 않습니다. 언어 모델은 이러한 모호함을 해결하는 데 뛰어납니다.
둘째, 시스템은 실제 파일에 대해 작업을 실행해야 합니다. 대화 창에서 일관성 있는 텍스트를 생성하는 것과 올바른 단락 스타일, 페이지 여백, 표 테두리, 차트가 포함된 .docx 파일 만드는 것은 완전히 다른 문제입니다. 언어 모델 자체는 Office 파일 구조에 대한 결정론적이고 서식을 인식하는 제어를 제공하지 않습니다.
셋째, 시스템은 출력물이 구조와 서식을 유지하도록 보장해야 합니다. 비즈니스 문서에는 읽기 쉬운 텍스트 이상의 제약 조건이 따릅니다. 조항 번호 매기기, 섹션 계층 구조, 머리글/바닥글, 병합 필드, 조건부 서식 규칙 등이 있습니다. 이것들은 일반 텍스트가 아닌 파일 형식 자체에 속하는 구조적 속성입니다.
기존 SDK는 #2와 #3을 결정론적으로 해결하도록 설계되었지만, #1에서 설명한 언어 수준의 의도 이해를 제공하지 못합니다. 순수 LLM API는 #1을 효과적으로 해결할 수 있지만 #2와 #3에 대한 결정론적 제어를 제공하지 못합니다. 이 둘을 결합하는 것, 즉 결정론적 문서 처리 레이어 뒤에 언어 모델을 두는 것이 AI 에이전트를 실무 문서 작업에 유용하게 만드는 이유입니다.
대량의 문서를 처리하는 조직은 수많은 근본적인 갈등에 직면합니다. 즉, 문서는 의미론적 이해(할 일을 파악하기 위해)와 결정론적 파일 조작(올바르게 서식이 지정된 결과를 생성하기 위해)을 모두 필요로 합니다. AI 에이전트는 하나의 인터페이스 내에서 두 기능을 결합하여 이 문제를 해결합니다.
업계 분석가들은 이러한 결합이 예외가 아닌 표준이 될 것으로 예상합니다. Gartner는 2028년까지 엔터프라이즈 소프트웨어 애플리케이션의 33%에 에이전틱 AI가 포함될 것으로 예측하고 있으며(2024년 1% 미만에서 증가), 일상 업무 결정의 15%가 자율적으로 이루어질 것으로 보고 있습니다. 이는 문서 집약적인 비즈니스 워크플로에 직접적인 영향을 미치는 변화입니다.
8. 자주 묻는 질문
AI 문서 에이전트와 일반 LLM의 차이점은 무엇인가요?
LLM(대형 언어 모델)은 텍스트를 생성하고 이해하도록 학습된 신경망으로, 토큰 시퀀스 상에서 작동합니다. 그 자체로는 Office나 PDF 파일 구조에 대해 결정론적이고 서식을 인식하는 제어를 제공하지 않습니다(비록 LLM 기반 시스템이 별도의 도구와 API를 통해 이러한 형식에 접근할 수 있다 하더라도). AI 문서 에이전트는 LLM(또는 유사 모델) 위에 위치하여 .docx, .xlsx, .pptx, .pdf 파일을 열고, 작업을 실행하며, 완성도 높은 결과물을 생성할 수 있는 문서 처리 도구와 LLM을 연결합니다. LLM이 이해를 제공한다면, 에이전트는 실제 파일과의 교량 역할을 제공합니다.
AI 문서 에이전트를 사용하려면 문서를 클라우드로 전송해야 하나요?
반드시 그렇지는 않습니다. 많은 AI 문서 에이전트가 사용자의 자체 인프라 내에서 완전히 실행될 수 있습니다 — SDK나 서비스가 온프레미스 또는 프라이빗 클라우드에서 실행되고 문서는 환경 내에 남아 있습니다. 콘텐츠를 분석하기 위해 관련 텍스트 레이어가 백엔드 모델로 전송되는데, 설정에 따라 호스팅된 API에 위치할 수도 있고 로컬에 위치할 수도 있습니다. 데이터 프라이버시가 중요한 경우 로컬 모델 배포를 지원하거나 모델 호출의 출처를 구성할 수 있는 솔루션을 확인하세요.
AI 에이전트는 어떤 문서 형식을 지원하나요?
AI 문서 에이전트는 광범위한 형식을 지원할 수 있지만 정확한 세트는 구현에 따라 크게 다릅니다. 일부 에이전트는 주로 PDF 및 이미지 기반 OCR 워크플로에 집중하는 반면, 다른 에이전트는 Word(.docx, .doc), Excel(.xlsx, .xls), PowerPoint(.pptx, .ppt)를 포함한 전체 Microsoft Office 파일 형식을 다룹니다. 다수는 변환 목적으로 HTML, Markdown, XPS, CSV 및 일반 이미지 유형과 같은 중간 형식도 지원합니다. 암호화된 파일, 레거시 바이너리 형식 또는 특수 템플릿에 관한 제품별 제한 사항은 설명서를 참조하세요.
문서 에이전트 SDK에 자체 AI 모델을 사용할 수 있나요?
일부 문서 에이전트 SDK는 유연한 모델 통합을 지원하여 개발자가 에이전트에서 사용하는 제공업체나 엔드포인트를 구성할 수 있도록 합니다. OpenAI 또는 Azure OpenAI와 같은 호스팅 서비스, 사용자 환경에서 실행되는 오픈소스 모델, 또는 SDK 공급업체가 제공하는 전용 엔드포인트 중에서 선택할 수 있는 경우가 많습니다. 지원되는 제공업체는 구현체마다 다르므로 평가 중인 특정 제품의 통합 가이드를 확인하세요.
AI 문서 에이전트는 RPA나 OCR 도구와 어떻게 다른가요?
RPA(로봇 프로세스 자동화)는 주로 사전 정의된 워크플로와 상호작용을 자동화하는 반면, AI 에이전트는 더 높은 수준의 지시를 해석하고 컨텍스트에 따라 도구나 작업을 동적으로 선택할 수 있습니다. 최신 RPA 시스템은 때로 OCR, NLP 또는 LLM 자체를 포함하기도 하지만, 핵심 패러다임은 여전히 규칙 기반 프로세스 자동화입니다.
OCR(광학 문자 인식)은 주로 시각적 문서 콘텐츠를 기계가 읽을 수 있는 텍스트로 변환하는 반면, AI 문서 에이전트는 해석 및 문서 작업을 포함하는 더 넓은 워크플로의 한 구성 요소로 OCR을 활용할 수 있습니다. 실제 적용에서 에이전트는 스캔된 문서를 다룰 때 내부적으로 OCR을 자주 호출하지만, 단순한 텍스트 추출을 넘어 찾은 내용으로 새 파일을 생성, 서식 지정 및 구조화합니다.
AI 문서 처리가 엔터프라이즈 워크플로에 적합한가요?
AI 문서 처리는 엔터프라이즈 용도로 점점 더 적합해지고 있지만, 준비 상태는 몇 가지 실무적 요인에 따라 달라집니다. 긍정적인 면은 최신 문서 에이전트가 기업 템플릿 및 브랜드 가이드라인과 결과물이 일치하도록 보장하는 결정론적 파일 조작을 제공한다는 것입니다. 또한 사용자가 새 인터페이스를 배울 필요 없이 기존 애플리케이션 스택 내부에서 실행됩니다.
배포 전 주요 고려 사항으로는 데이터 프라이버시(문서 텍스트의 전송 방식 및 위치), 모델 신뢰성(지시가 모호한 예외 케이스 처리), 민감한 문서에 대한 Human-in-the-loop(사람의 개입 검토) 프로세스, 모델 호출 실패 시 대체(fallback) 동작 구성 기능 등이 있습니다. 내부 메모, 요약 초안 작성, 비표준 템플릿과 같이 위험도가 낮은 작업부터 에이전트를 시범 도입하는 기업이 첫날부터 기업 전반에 배포하려는 기업보다 프로덕션 배포에 더 빠르게 도달하는 편입니다.
AI 문서 처리와 지능형 문서 처리(IDP)의 차이점은 무엇인가요?
지능형 문서 처리(IDP)는 일반적으로 문서 워크플로의 캡처 및 추출 단계에 특화된 엔터프라이즈 중심 시스템을 가리킵니다: 문서 수집, 유형별 분류, OCR 적용, 구조화된 필드 추출, 비즈니스 규칙 대비 검증, 다운스트림 시스템으로 라우팅. AI 문서 처리는 IDP를 포함하면서도 생성, 변환, 교체 형식 워크플로 및 대화형 에이전트 기반 자동화까지 아우르는 더 넓은 상위 개념입니다.
이 구분을 생각하는 유용한 방법은, IDP가 전통적으로 문서 수집, 분류, 추출, 검증 및 다운스트림 워크플로 오케스트레이션을 강조하는 반면, AI 문서 처리는 분석, 생성, 변환 및 에이전트 기반 추론을 포함하여 더 넓게 사용된다는 점입니다. 솔루션 업체들이 IDP 플랫폼에 생성 기능을 접목하고 에이전트가 구조화된 추출 파이프라인을 채택함에 따라 두 범주는 점점 더 중첩되고 있습니다.
AI 문서 처리를 시작할 준비가 되셨나요?
AI 기반 문서 처리는 단순한 보고서 생성부터 데이터 분석, 요약, 구조화된 출력이 결합된 복잡한 교차 형식 워크플로까지 다양한 사용 사례에 적용됩니다. .NET 애플리케이션에 AI 에이전트를 통합하는 옵션을 평가 중이라면 공식 시작하기 튜토리얼을 먼저 확인한 다음, 계약서 생성 및 프레젠테이션 자동화에 관한 주제별 가이드를 살펴보세요.
추가 읽을거리
- Spire.Agent.Office 제품 개요 — Word, Excel, PowerPoint 및 PDF 문서 처리를 위한 AI 에이전트 SDK
- 일괄 계약서 생성 튜토리얼 — 템플릿 및 데이터 소스로부터 계약서 자동 생성
- 문서에서 PPT 생성하기 — Word, PDF 및 기타 형식을 프레젠테이션으로 변환
- Excel에서 학생 성적 분석 및 순위 자동화 — AI 에이전트를 활용한 데이터 분석 및 순위 산출
- 다양한 Word 템플릿 생성하기 — 에이전트가 채울 수 있는 템플릿 구축
Agente IA per l'elaborazione dei documenti: cos'è e come funziona
Un agente IA per l'elaborazione di documenti è un sistema software che utilizza modelli e strumenti di intelligenza artificiale per comprendere istruzioni in linguaggio naturale ed eseguire attività come la creazione, la modifica, la conversione, l'analisi o l'estrazione di contenuti dai documenti, senza dover scrivere codice riga per riga. Un agente IA può lavorare con file Word, Excel, PowerPoint e PDF interpretando l'intento dell'utente, selezionando le operazioni di elaborazione documenti appropriate e producendo un output che preserva la struttura e la formattazione del file richiesto.
Gli agenti IA rappresentano un approccio all'automazione del lavoro legato ai documenti. Altri approcci includono le API programmatiche tradizionali, gli endpoint di modelli linguistici grezzi utilizzati con codice personalizzato e i motori di workflow che automatizzano passaggi predefiniti. Questo articolo spiega cos'è l'elaborazione documenti basata su IA, in cosa differisce dai metodi precedenti e quando ha senso utilizzarla insieme ad altre tecnologie.
1. Cos'è l'elaborazione documenti con IA?
L'elaborazione dei documenti — l'attività di lettura, creazione, modifica, conversione, estrazione di informazioni o analisi di documenti digitali — è sempre stata una delle attività software più comuni in tutti i settori. Le fatture arrivano via email come PDF. I report di vendita si trovano in cartelle di lavoro Excel con layout incoerenti. I manuali per i dipendenti risiedono in modelli Word che cambiano ogni anno. Gli accordi legali si presentano come PDF scansionati da terze parti. Per decenni, le organizzazioni hanno scritto codice per gestire questa varietà.
Gli approcci tradizionali all'elaborazione dei documenti condividono uno schema comune: qualcuno definisce cosa deve accadere a quali documenti utilizzando regole esplicite. Uno script di compilazione di modelli legge un CSV e popola un file Word .docx sostituendo segnaposto predefiniti. Uno script Python scorre le colonne di Excel e chiama funzioni di layout per produrre un report formattato. Una routine C# apre un PDF, cerca campi specifici per posizione o espressione regolare e riscrive i risultati in un database. Questi metodi funzionano bene per workflow stabili e ben definiti, ma richiedono istruzioni programmatiche per ogni variazione. Quando il modello cambia, quando il formato di input si sposta o quando nuovi tipi di documenti entrano nella pipeline, il codice deve essere riscritto, testato e ridistribuito.
L'elaborazione documenti basata su IA estende queste stesse operazioni introducendo un livello di comprensione del linguaggio. Invece di dire al software esattamente quale segnaposto sostituire o quale intervallo di celle leggere, descrivi quale risultato desideri in linguaggio naturale: "Riassumi questo contratto ed estrai i termini di pagamento" o "Confronta il foglio di calcolo delle vendite del mese scorso con quello di questo mese e salva l'analisi come report formattato". Il sistema utilizza un modello IA per interpretare tale istruzione, determina quali operazioni sui documenti sono necessarie, le esegue sui formati di file reali e restituisce un output correttamente strutturato.
In pratica, l'elaborazione documenti con IA non sostituisce gli approcci tradizionali, ma li potenzia. Le attività semplici e prevedibili potrebbero essere ancora gestite meglio da script basati su regole perché sono più veloci e completamente deterministiche. Ma quando i documenti variano nella struttura, quando gli input arrivano in formati imprevedibili o quando la domanda posta a un documento cambia frequentemente, un approccio assistito dall'IA risparmia sforzi di ingegneria e si adatta più naturalmente ai requisiti mutevoli.
2. Cos'è un agente IA per l'elaborazione di documenti?
Un agente IA per l'elaborazione di documenti è un sistema che combina il ragionamento dei modelli linguistici con strumenti orientati ai documenti, in modo che una persona possa descrivere un'attività in termini colloquiali e ottenere come output un documento reale e ben formato.
La caratteristica distintiva di un agente, in questo contesto, è che colma due capacità che la maggior parte dei singoli componenti non possiede da sola:
- Comprensione. Il sistema interpreta istruzioni di alto livello e a risposta aperta su cosa fare con un documento. "Esamina questo accordo per clausole rischiose" o "Trasforma queste cifre trimestrali in una presentazione" non sono query strutturate; richiedono comprensione semantica.
- Azione. Dopo aver compreso l'intento, il sistema seleziona ed esegue operazioni concrete sui documenti — leggere un file, estrarre testo o tabelle, inserire contenuti, modificare il layout, generare un nuovo file — in formati come
.docx,.xlsx,.pptxo.pdf.
Diversi fornitori e gruppi di ricerca utilizzano una terminologia leggermente diversa per questi concetti. Alcuni chiamano questi sistemi "assistenti IA", altri usano "workflow agentici", "pipeline documentali autonome" o "piattaforme di intelligenza documentale". Le distinzioni sono sottili e spesso guidate dal marketing. Ciò che conta per la valutazione non è l'etichetta ma la capacità: il sistema può interpretare istruzioni non strutturate e manipolare file di documenti tramite API reali?
In pratica, il termine "agente documentale" copre diversi tipi di sistemi — inclusi agenti focalizzati sull'estrazione che ingeriscono, classificano e instradano documenti, e agenti che interpretano direttamente istruzioni in linguaggio naturale e manipolano o generano documenti. In questo articolo, il termine si riferisce specificamente agli agenti che combinano il ragionamento dei modelli linguistici con API di elaborazione documenti. Di seguito è riportato un confronto funzionale che distingue un agente documentale IA dalle tecnologie correlate. Queste categorie si sovrappongono significativamente — molti prodotti ne combinano diverse — ma capire dove eccelle ogni approccio aiuta a chiarire cosa aggiunge effettivamente un agente.
| Approccio | Punto di forza principale | Come gestisce le istruzioni | Limitazione tipica |
|---|---|---|---|
| Solo endpoint LLM | Profonda comprensione del linguaggio | Interpreta il linguaggio naturale in modo molto efficace | Non fornisce di per sé un controllo deterministico e consapevole del formato sulle strutture di file Office e PDF; produce testo grezzo o HTML a meno che non sia combinato con strumenti di elaborazione documenti |
| Agente in linguaggio naturale | Colma la comprensione con l'esecuzione di strumenti | Accetta richieste di alto livello e concatena gli strumenti appropriati | Dipende dalla qualità degli strumenti disponibili e dalla logica di orchestrazione |
| SDK / API tradizionali | Manipolazione deterministica e precisa dei file | Richiede comandi programmatici espliciti; nessuna comprensione del linguaggio | Rigido: ogni modifica nel modello o nel formato di input richiede aggiornamenti del codice |
| RPA (Robotic Process Automation) | Automatizza le interazioni a livello di interfaccia utente tra le applicazioni | Segue workflow basati su script; alcune RPA moderne includono visione e OCR | Difficoltà con istruzioni ambigue che richiedono interpretazione semantica — L'RPA (Robotic Process Automation) si basa su robot software che gestiscono dati tra applicazioni seguendo regole predefinite, mentre gli agenti interpretano richieste in linguaggio naturale a risposta aperta |
| OCR (Riconoscimento ottico dei caratteri) | Converte immagini/scansioni in testo leggibile dalla macchina | Opera su contenuti visivi; estrae caratteri e layout di base | Non esegue la generazione di documenti, l'analisi o workflow a più fasi |
Queste capacità appaiono spesso insieme nei sistemi di produzione. Una pipeline documentale aziendale potrebbe utilizzare l'OCR per digitalizzare fatture scansionate, passare il testo estratto attraverso un LLM per la classificazione semantica, instradare il risultato in un workflow RPA per l'inserimento dati e infine generare un report brandizzato utilizzando un'API documentale. Un agente documentale IA si colloca al centro di tale pipeline come il componente che comprende la richiesta umana e coordina gli strumenti necessari per soddisfarla.
Quando le persone cercano "cos'è l'elaborazione documenti con IA" o "come funzionano gli agenti documentali IA", di solito cercano di capire se acquistare o costruire un sistema del genere sia diverso dal combinare manualmente strumenti pronti all'uso. La risposta breve è: sì, quando la varietà dei documenti, la variabilità delle istruzioni e la fedeltà della formattazione sono abbastanza importanti da giustificare un livello di orchestrazione dedicato tra la comprensione del linguaggio e la manipolazione dei file.
3. Come funziona un agente IA per documenti?
A un alto livello, un agente IA per documenti segue cinque fasi concettuali:
L'utente fornisce un'istruzione in linguaggio naturale
     ↓
Il modello IA interpreta l'intento e identifica le operazioni necessarie
     ↓
L'agente seleziona gli strumenti o le API di elaborazione documenti appropriati
     ↓
Le API documentali eseguono operazioni a livello di file (lettura, modifica, generazione)
     ↓
Il documento di output viene generato utilizzando operazioni di elaborazione deterministiche
Ogni fase introduce decisioni che determinano quanto accurato, affidabile e ben formattato sarà l'output finale. Comprendere queste decisioni chiarisce perché un puro LLM da solo non può produrre in modo affidabile file Word o Excel reali, e perché un SDK tradizionale da solo non può comprendere una richiesta vaga o a risposta aperta.
Architettura: dall'intento al file
Un'implementazione tipica concatena cinque livelli, passando il documento attraverso ogni fase dall'intento all'output:
Esempio: da una richiesta in linguaggio naturale a un documento finito
Consideriamo uno scenario che molti team finanziari incontrano ogni mese: un manager invia una cartella di cartelle di lavoro di vendita regionali e richiede un report riepilogativo consolidato in formato Word.
La richiesta in linguaggio naturale di un utente potrebbe essere simile a questa:
"Leggi tutti i file di vendita del Q3 in questa cartella, confronta ogni regione con il trimestre precedente, riassumi le tendenze chiave e i valori anomali, e salva i risultati come documento Word formattato."
Dietro le quinte, l'agente scompone quella singola frase in una sequenza di operazioni:
- Scoprire e aprire ogni file
.xlsxnella directory specificata. - Leggere le righe di riepilogo o i fogli chiave da ogni cartella di lavoro.
- Calcolare le variazioni periodo su periodo.
- Identificare le regioni con le prestazioni migliori e peggiori.
- Comporre un riepilogo narrativo che descriva le tendenze.
- Creare un nuovo documento Word, inserire il riepilogo, aggiungere tabelle che mostrano i confronti regionali e applicare una formattazione coerente con i modelli aziendali.
Il risultato finale — il report Word consolidato con il riepilogo narrativo e le tabelle di confronto regionale:
Senza un agente, uno sviluppatore dovrebbe tipicamente costruire e orchestrare ciascuno di questi sei passaggi — scrivendo codice per la scoperta dei file, la lettura dei dati, il calcolo delle variazioni, la chiamata a un LLM per la generazione della prosa, l'analisi della sua risposta e la mappatura in un layout di documento strutturato. Con un agente, i passaggi 4–6 possono essere espressi in una singola istruzione, mentre i passaggi 1–3 sfruttano comunque le stesse capacità di analisi dei file che la tua applicazione già possiede.
Questo tipo di workflow cross-formato — dove la lettura di dati da un tipo di file e la produzione di output in un altro richiede sia ragionamento semantico che una manipolazione precisa dei file — è esattamente dove gli agenti IA offrono il massimo valore. Strumenti come Spire.Agent.Office raggruppano il livello di orchestrazione insieme ad API documentali deterministiche, in modo che gli sviluppatori ottengano un'interfaccia in linguaggio naturale senza perdere il controllo su formattazione, layout o fedeltà dell'output.
4. Cosa possono fare gli agenti IA con i documenti?
A seconda delle capacità degli strumenti di elaborazione documenti sottostanti, gli agenti IA possono potenzialmente coprire una vasta gamma di operazioni che gli sviluppatori implementano tradizionalmente con codice esplicito — solo espresse attraverso l'intento piuttosto che la sintassi. La tabella seguente mostra le categorie di operazioni rappresentative che molte implementazioni supportano quando i loro strumenti di elaborazione documenti sottostanti forniscono tali capacità.
| Capacità | Word (.docx/.doc) | Excel (.xlsx/.xls) | PowerPoint (.pptx/.ppt) | PDF (.pdf) |
|---|---|---|---|---|
| Creare da zero o da dati | Sì — paragrafi, tabelle, intestazioni, stili | Sì — fogli, celle, formule, grafici | Sì — diapositive, layout, temi | Sì — sezioni, blocchi di testo, annotazioni |
| Modificare documenti esistenti | Sì — inserire, sostituire, rifluire contenuti | Sì — aggiornare celle, riorganizzare righe/colonne | Sì — modificare contenuti diapositive, riordinare | Sì — aggiungere/rimuovere pagine, annotare, oscurare |
| Convertire tra formati | Sì ↔ PDF, HTML, XPS, Markdown | Sì ↔ CSV, PDF, HTML | Sì ↔ PDF | Sì ↔ DOCX, HTML, formati immagine |
| Analizzare / Riassumere contenuti | Sì — estrarre clausole, identificare struttura | Sì — confrontare set di dati, calcolare statistiche | Sì — rivedere narrazioni diapositive | Sì — classificare pagine, estrarre info chiave |
| Estrarre dati (strutturati) | Sì — estrarre testo da paragrafi e tabelle | Sì — leggere valori celle, intervalli, intervalli denominati | Limitato — testo e note diapositive | Sì — analizzare moduli, tabelle, testo incorporato |
Le capacità effettive dipendono dalle librerie di elaborazione documenti sottostanti e dall'implementazione specifica dell'agente.
I casi d'uso comuni che rientrano in queste capacità includono:
- Revisione di contratti e accordi: Leggere PDF o file Word in arrivo, segnalare clausole insolite o disposizioni mancanti e produrre un riepilogo in Markdown o Word.
- Consolidamento di report: Aggregare fogli di calcolo disparati da più regioni, rilevare anomalie e generare un report Word o PDF pronto per il management.
- Generazione di presentazioni: Inserire un documento di briefing o un set di dati in un modello di presentazione e produrre una presentazione finita con grafici e punti chiave.
- Elaborazione di fatture e moduli: Aprire fatture scansionate o digitali, estrarre voci e totali, verificare rispetto agli ordini di acquisto e popolare i sistemi a valle.
- Manutenzione di policy e manuali: Aggiornare i documenti dei dipendenti sostituendo nomi, date e linguaggio specifico del dipartimento in decine di modelli.
Per i team che costruiscono già workflow documentali, queste capacità non sostituiscono la loro logica esistente — la estendono. Un agente gestisce le parti di un workflow che dipendono dalla comunicazione umana (comprendere cosa fare), mentre le API documentali sottostanti gestiscono le parti che dipendono dalla precisione (produrre il file giusto con il layout giusto). Consulta i tutorial ufficiali sulla generazione di contratti in batch e sulla generazione di presentazioni da documenti per esempi di come queste operazioni si inseriscono nelle applicazioni reali.
5. Approcci all'automazione dei documenti
Non tutte le organizzazioni si rivolgono a un agente IA quando automatizzano i workflow documentali. La scelta tecnologica dipende dai tipi di documenti gestiti, dalla frequenza con cui cambiano e dalla quantità di sforzo ingegneristico disponibile. Di seguito è riportato un confronto degli approcci principali che incontrerai nella pratica.
| Approccio | Punti di forza | Limitazioni | Ideale per |
|---|---|---|---|
| Agente in linguaggio naturale | Interazione amichevole; boilerplate minimo; si adatta a formati di input vari | Richiede integrazione con un livello di elaborazione documenti; dipende dall'accuratezza del modello per istruzioni complesse | Team che ricevono documenti con strutture incoerenti e desiderano un'iterazione rapida senza ricompilazione |
| API LLM + codice personalizzato | Altamente personalizzabile; scelta dei migliori modelli per ogni attività; controllo totale sull'orchestrazione | Sforzo ingegneristico significativo per I/O file, gestione errori, formattazione e validazione | Organizzazioni che eseguono già uno stack LLM, desiderano la massima flessibilità e hanno disponibilità ingegneristica |
| SDK / API documentali tradizionali | Completamente deterministico; controllo preciso su layout, stile e coerenza dell'output; nessuna dipendenza dal modello in runtime | Richiede istruzioni programmatiche esplicite per ogni scenario; rigido quando i modelli o le strutture di input cambiano frequentemente | Documenti a formato fisso con struttura prevedibile che cambiano raramente, come moduli standardizzati o report di conformità |
| RPA / Motore di workflow | Ottimo per automatizzare processi ripetibili basati su regole tra sistemi; sfrutta l'infrastruttura esistente | Meno flessibile per attività ambigue o a risposta aperta; difficoltà quando i formati dei documenti variano ampiamente | Processi di back-office con alto volume e bassa varianza, come l'inserimento di fatture nei sistemi ERP |
Nessuno di questi approcci è universalmente superiore. Una strategia di automazione documentale matura spesso ne combina più di uno. Ad esempio, un'organizzazione potrebbe utilizzare codice SDK tradizionale per generare report di conformità fissi e riservare un agente IA per attività di analisi ad-hoc che variano di settimana in settimana.
Dove una soluzione come Spire.Agent.Office si differenzia è nell'offrire un unico SDK che fornisce sia l'interfaccia in linguaggio naturale sia le capacità di elaborazione documentale deterministica necessarie per trasformare le istruzioni in file reali. Invece di collegare insieme servizi LLM separati, librerie di formattazione personalizzate e logica di orchestrazione, gli sviluppatori aggiungono un processore IA ai loro oggetti documento esistenti — una singola chiamata AI(options) su qualsiasi istanza di Document, Workbook, Presentation o PdfDocument — e quindi emettono istruzioni in linguaggio semplice che restituiscono un output formattato preservando layout, font, tabelle e stili.
Se utilizzi già una libreria documentale tradizionale per operazioni deterministiche, aggiungere un livello agente significa tipicamente avvolgere lo stesso oggetto Document o Spreadsheet con un processore IA e sostituire la logica di sostituzione campo per campo con istruzioni dichiarative. La curva di apprendimento si concentra sulla scrittura di prompt efficaci piuttosto che sull'apprendimento di un nuovo formato di file.
6. Elaborazione documenti con IA vs Elaborazione intelligente dei documenti (IDP)
Se hai ricercato l'automazione documentale professionalmente, incontrerai diversi termini sovrapposti: elaborazione documenti con IA, elaborazione intelligente dei documenti (o IDP), intelligenza documentale, automazione documentale con IA e agente documentale IA. Comprendere la loro relazione aiuta a restringere ciò che stai effettivamente cercando — ed evita la confusione causata dalla terminologia dei fornitori che varia tra i mercati.
Nell'uso comune:
- Elaborazione documenti con IA è spesso usato come termine ombrello ampio — si riferisce a qualsiasi approccio che applichi tecniche di intelligenza artificiale per comprendere, creare, modificare, convertire o analizzare documenti. Tuttavia, quanto questo termine sia definito in modo ampio o ristretto varia a seconda di chi lo usa.
- Elaborazione intelligente dei documenti (IDP) ha avuto origine nella gestione documentale aziendale con un'enfasi sulla fase di acquisizione ed estrazione: scansione o ingestione di documenti, classificazione per tipo (fattura, ricevuta, contratto), applicazione dell'OCR, estrazione di campi, validazione rispetto alle regole aziendali e instradamento verso i sistemi a valle. Nel tempo, i confini di ciò che conta come IDP si sono spostati man mano che i fornitori incorporano l'IA generativa nei loro prodotti.
- Intelligenza documentale è talvolta usata in modo intercambiabile con IDP ma spesso porta una maggiore enfasi sull'estrazione e la comprensione rispetto alla generazione. I fornitori negli spazi legal-tech e dei servizi finanziari preferiscono questa terminologia.
- Automazione documentale con IA evidenzia il lato dell'esecuzione — utilizzare l'IA per attivare workflow che producono, inviano o modificano documenti basati su trigger o richieste dell'utente.
- Agente documentale IA si concentra sull'aspetto dell'orchestratore: un sistema che riceve l'intento in linguaggio naturale, pianifica le operazioni necessarie e delega agli strumenti richiesti per completare il lavoro.
Queste definizioni sono convenzionali piuttosto che formali. Troverai diversi fornitori che pongono confini in punti diversi e molti prodotti coprono più categorie contemporaneamente. Il punto chiave non è quale etichetta porti lo strumento scelto, ma se lo strumento può fare ciò di cui hai effettivamente bisogno: comprendere una richiesta, scegliere le operazioni giuste, eseguirle su file reali e restituire un output strutturato.
Ad esempio, un sistema etichettato come "piattaforma di intelligenza documentale" potrebbe eccellere nella classificazione e nell'estrazione ma mancare di forti capacità di generazione. Un "agente documentale IA" può supportare la generazione oltre all'estrazione, alla classificazione e all'instradamento, a seconda dei suoi strumenti e del workflow previsto. In pratica, le migliori soluzioni combinano estrazione, ragionamento e generazione sotto lo stesso tetto — motivo per cui framework come Spire.Agent.Office si posizionano come agenti end-to-end piuttosto che come soluzioni puntuali per una singola fase della pipeline.
7. Perché gli agenti IA sono utili per l'elaborazione dei documenti
Il motivo fondamentale per cui gli agenti IA sono importanti per il lavoro sui documenti è semplice: la maggior parte delle attività documentali significative coinvolge tre requisiti simultaneamente.
In primo luogo, il sistema deve comprendere cosa vuole l'utente. "Prepara un riepilogo trimestrale da questi report" non è una query strutturata — lascia non specificato quali file leggere, quali metriche estrarre, come strutturare l'output e quale tono usare. Un modello linguistico eccelle nel risolvere tale ambiguità.
In secondo luogo, il sistema deve eseguire azioni su file reali. Generare testo coerente in una finestra di chat è diverso dal produrre un .docx con stili di paragrafo, margini di pagina, bordi di tabella e grafici incorporati corretti. Un modello linguistico da solo non fornisce un controllo deterministico e consapevole del formato sulle strutture dei file Office.
In terzo luogo, il sistema deve garantire che l'output preservi struttura e formattazione. I documenti aziendali comportano vincoli che vanno oltre il testo leggibile: numerazione delle clausole, gerarchie di sezioni, intestazioni a piè di pagina, campi di unione, regole di formattazione condizionale. Queste sono proprietà strutturali che appartengono al formato del file stesso, non al testo semplice.
Un SDK tradizionale è progettato per affrontare #2 e #3 in modo deterministico, ma non fornisce la comprensione dell'intento a livello linguistico descritta in #1. Un'API LLM grezza può affrontare #1 in modo efficace, ma non fornisce di per sé un controllo deterministico su #2 e #3. Combinare i due — mettere un modello linguistico dietro un livello di elaborazione documentale deterministico — è ciò che rende un agente utile per il lavoro documentale nel mondo reale.
Le organizzazioni che elaborano volumi elevati di documenti affrontano spesso la stessa tensione fondamentale: i documenti richiedono sia comprensione semantica (per capire cosa fare) sia manipolazione deterministica dei file (per produrre un output formattato correttamente). Gli agenti IA affrontano questa tensione combinando entrambe le capacità sotto un'unica interfaccia.
Gli analisti del settore si aspettano che questa combinazione diventi la norma piuttosto che l'eccezione. Gartner prevede che entro il 2028, il 33% delle applicazioni software aziendali includerà IA agentica, rispetto a meno dell'1% nel 2024, e che il 15% delle decisioni lavorative quotidiane sarà preso in modo autonomo — un cambiamento con implicazioni dirette per i workflow aziendali pesanti dal punto di vista documentale.
8. Domande frequenti (FAQ)
Qual è la differenza tra un agente documentale IA e un normale LLM?
Un LLM (Large Language Model) è una rete neurale addestrata per generare e comprendere testo. Opera su sequenze di token. Di per sé, non fornisce un controllo deterministico e consapevole del formato sulle strutture di file Office o PDF — sebbene i sistemi basati su LLM possano accedere a questi formati tramite strumenti e API separati. Un agente documentale IA si colloca sopra un LLM (o modello simile) e lo connette a strumenti di elaborazione documenti in grado di aprire file .docx, .xlsx, .pptx e .pdf, eseguire operazioni su di essi e produrre un output ben formato. L'LLM fornisce la comprensione; l'agente fornisce il ponte verso i file reali.
Devo inviare documenti al cloud per utilizzare un agente documentale IA?
Non necessariamente. Molti agenti documentali IA possono essere eseguiti interamente all'interno della tua infrastruttura — l'SDK o il servizio viene eseguito on-premise o in un cloud privato e i documenti rimangono all'interno del tuo ambiente. Per analizzare il contenuto, i livelli di testo rilevanti vengono trasmessi al modello sottostante, che può risiedere su un'API ospitata o localmente a seconda della configurazione. Se la privacy dei dati è una preoccupazione, cerca soluzioni che supportino il deployment locale del modello o che ti consentano di configurare l'origine delle chiamate al modello.
Quali formati di documento supportano gli agenti IA?
Gli agenti documentali IA possono supportare una vasta gamma di formati, ma il set esatto varia considerevolmente in base all'implementazione. Alcuni agenti si concentrano principalmente su workflow PDF e OCR basati su immagini, mentre altri gestiscono formati di file Microsoft Office completi inclusi Word (.docx, .doc), Excel (.xlsx, .xls) e PowerPoint (.pptx, .ppt). Molti supportano anche formati intermedi come HTML, Markdown, XPS, CSV e tipi di immagine comuni a fini di conversione. Controlla la documentazione per eventuali limitazioni specifiche del prodotto relative a file crittografati, formati binari legacy o modelli specializzati.
Posso usare il mio modello IA con un SDK di agente documentale?
Alcuni SDK di agenti documentali supportano un'integrazione flessibile del modello, consentendo agli sviluppatori di configurare il provider o l'endpoint utilizzato dall'agente. Spesso puoi scegliere tra servizi ospitati come OpenAI o Azure OpenAI, modelli open-source in esecuzione nel tuo ambiente o endpoint proprietari forniti dal fornitore dell'SDK. I provider supportati variano in base all'implementazione, quindi consulta la guida all'integrazione per il prodotto specifico che stai valutando.
In che modo un agente documentale IA differisce dagli strumenti RPA o OCR?
L'RPA (Robotic Process Automation) automatizza principalmente workflow e interazioni predefiniti, mentre gli agenti IA possono interpretare istruzioni di livello superiore e selezionare dinamicamente strumenti o azioni in base al contesto. I sistemi RPA moderni a volte incorporano OCR, NLP o persino gli stessi LLM, ma il loro paradigma principale rimane l'automazione dei processi basata su regole.
L'OCR (Riconoscimento ottico dei caratteri) converte principalmente il contenuto visivo del documento in testo leggibile dalla macchina, mentre un agente documentale IA può utilizzare l'OCR come un componente in un workflow più ampio che include interpretazione e operazioni sui documenti. In pratica, gli agenti invocano frequentemente l'OCR internamente quando gestiscono documenti scansionati, ma vanno ben oltre l'estrazione del testo per generare, formattare e strutturare nuovi file da ciò che trovano.
L'elaborazione documenti con IA è adatta ai workflow aziendali?
L'elaborazione documenti con IA è sempre più adatta all'uso aziendale, ma la prontezza dipende da diversi fattori pratici. Dal lato positivo, i moderni agenti documentali forniscono una manipolazione deterministica dei file che garantisce che l'output corrisponda ai modelli aziendali e alle linee guida del brand. Vengono eseguiti all'interno degli stack applicativi esistenti senza richiedere agli utenti di apprendere nuove interfacce.
Le considerazioni chiave prima del deployment includono la privacy dei dati (come e dove viene trasmesso il testo del documento), l'affidabilità del modello (gestione dei casi limite in cui le istruzioni sono ambigue), i processi di revisione umana per documenti sensibili e la capacità di configurare il comportamento di fallback quando una chiamata al modello fallisce. Le aziende che pilotano un agente per attività a basso rischio — memo interni, bozze di riepilogo, modelli non conformi — solitamente raggiungono i deployment di produzione più velocemente di quelle che tentano un rollout a livello aziendale fin dal primo giorno.
Qual è la differenza tra elaborazione documenti con IA e Elaborazione intelligente dei documenti (IDP)?
L'elaborazione intelligente dei documenti (IDP) si riferisce tipicamente a sistemi focalizzati sull'azienda che si specializzano nella fase di acquisizione ed estrazione dei workflow documentali: ingestione di documenti, classificazione per tipo, applicazione dell'OCR, estrazione di campi strutturati, validazione rispetto alle regole aziendali e instradamento verso i sistemi a valle. L'elaborazione documenti con IA è un termine ombrello più ampio che comprende l'IDP ma include anche generazione, trasformazione, workflow cross-formato e automazione interattiva basata su agenti.
Un modo utile per pensare alla distinzione è che l'IDP enfatizza tradizionalmente l'ingestione, la classificazione, l'estrazione, la validazione e l'orchestrazione dei workflow a valle, mentre l'elaborazione documenti con IA è spesso usata in modo più ampio per includere analisi, generazione, trasformazione e ragionamento basato su agenti. Le due categorie si sovrappongono sempre più man mano che i fornitori incorporano capacità generative nelle piattaforme IDP e gli agenti adottano pipeline di estrazione strutturata.
Pronto a provare l'elaborazione documenti con IA?
L'elaborazione documenti basata su IA copre una vasta gamma di casi d'uso, dalla semplice generazione di report a complessi workflow cross-formato che combinano analisi dei dati, riepilogo e output strutturato. Se stai valutando opzioni per integrare agenti IA in un'applicazione .NET, inizia con il tutorial ufficiale Getting Started, quindi esplora le guide specifiche per argomento sulla generazione di contratti e sull'automazione delle presentazioni.
Ulteriori letture
- Panoramica del prodotto Spire.Agent.Office — SDK per agenti IA per l'elaborazione di documenti Word, Excel, PowerPoint e PDF
- Tutorial sulla generazione di contratti in batch — generazione di contratti da modelli e fonti dati
- Generare PPT da documenti — trasformare Word, PDF e altri formati in presentazioni
- Automatizzare l'analisi e la classificazione dei punteggi degli studenti in Excel — analisi dati e classificazione con agenti IA
- Generare vari modelli Word — costruire modelli che l'agente può compilare
Agent IA pour le traitement de documents : qu'est-ce que c'est et comment ça fonctionne
Un agent IA pour le traitement de documents est un système logiciel qui utilise des modèles et des outils d'intelligence artificielle pour comprendre des instructions en langage naturel et effectuer des tâches telles que la création, l'édition, la conversion, l'analyse ou l'extraction de contenu à partir de documents, sans avoir à écrire de code ligne par ligne. Un agent IA peut travailler avec des fichiers Word, Excel, PowerPoint et PDF en interprétant l'intention de l'utilisateur, en sélectionnant les opérations de traitement de documents appropriées et en produisant un résultat qui préserve la structure et la mise en forme requises du fichier.
Les agents IA constituent une approche de l'automatisation du travail lié aux documents. D'autres approches incluent les API programmatiques traditionnelles, les points de terminaison de modèles de langage bruts utilisés avec du code personnalisé, et les moteurs de workflow qui automatisent des étapes prédéfinies. Cet article explique ce qu'est le traitement de documents piloté par l'IA, en quoi il diffère des méthodes antérieures et quand il est judicieux de l'utiliser parallèlement à d'autres technologies.
1. Qu'est-ce que le traitement de documents par IA ?
Le traitement de documents — l'activité consistant à lire, créer, modifier, convertir, extraire des informations ou analyser des documents numériques — a toujours été l'une des tâches logicielles les plus courantes dans tous les secteurs. Les factures arrivent par e-mail sous forme de PDF. Les rapports de vente se trouvent dans des classeurs Excel aux mises en page incohérentes. Les manuels des employés résident dans des modèles Word qui changent chaque année. Les accords juridiques se présentent sous forme de PDF numérisés provenant de tiers. Pendant des décennies, les organisations ont écrit du code pour gérer cette diversité.
Les approches traditionnelles de traitement de documents partagent un modèle commun : quelqu'un définit ce qui doit arriver à quels documents en utilisant des règles explicites. Un script de remplissage de modèle lit un CSV et remplit un .docx Word en remplaçant des espaces réservés prédéfinis. Un script Python parcourt les colonnes Excel et appelle des fonctions de mise en page pour produire un rapport stylisé. Une routine C# ouvre un PDF, recherche des champs spécifiques par position ou par expression régulière, et réécrit les résultats dans une base de données. Ces méthodes fonctionnent bien pour des workflows stables et bien définis, mais elles nécessitent des instructions programmatiques pour chaque variante. Lorsque le modèle change, lorsque le format d'entrée change ou lorsque de nouveaux types de documents entrent dans le pipeline, le code doit être réécrit, testé et redéployé.
Le traitement de documents piloté par l'IA étend ces mêmes opérations en introduisant une couche de compréhension du langage. Au lieu de dire au logiciel exactement quel espace réservé remplacer ou quelle plage de cellules lire, vous décrivez le résultat que vous souhaitez en langage naturel : "Résume ce contrat et extrais les conditions de paiement", ou "Compare la feuille de calcul des ventes du mois dernier à celle de ce mois-ci et enregistre l'analyse sous forme de rapport formaté." Le système utilise un modèle d'IA pour interpréter cette instruction, détermine quelles opérations de document sont nécessaires, les exécute sur les formats de fichiers réels et renvoie une sortie correctement structurée.
En pratique, le traitement de documents par IA ne remplace pas les approches traditionnelles, il les complète. Les tâches simples et prévisibles peuvent toujours être mieux gérées par des scripts basés sur des règles, car ils sont plus rapides et entièrement déterministes. Mais lorsque les documents varient en structure, lorsque les entrées arrivent dans des formats imprévisibles ou lorsque la question posée à un document change fréquemment, une approche assistée par l'IA économise des efforts d'ingénierie et s'adapte plus naturellement aux exigences changeantes.
2. Qu'est-ce qu'un agent IA pour le traitement de documents ?
Un agent IA pour le traitement de documents est un système qui combine le raisonnement d'un modèle de langage avec des outils orientés documents, afin qu'une personne puisse décrire une tâche en termes conversationnels et obtenir un document réel et bien formé en retour.
La caractéristique déterminante d'un agent — dans ce contexte — est qu'il comble deux capacités que la plupart des composants individuels ne possèdent pas par eux-mêmes :
- Compréhension. Le système interprète des instructions ouvertes et de haut niveau sur ce qu'il faut faire avec un document. "Examine cet accord pour détecter les clauses risquées" ou "Transforme ces chiffres trimestriels en une présentation" ne sont pas des requêtes structurées ; elles nécessitent une compréhension sémantique.
- Action. Après avoir compris l'intention, le système sélectionne et exécute des opérations documentaires concrètes — lire un fichier, extraire du texte ou des tableaux, insérer du contenu, modifier la mise en page, générer un nouveau fichier — dans des formats tels que
.docx,.xlsx,.pptxou.pdf.
Différents fournisseurs et groupes de recherche utilisent une terminologie légèrement différente autour de ces concepts. Certains appellent ces systèmes "assistants IA", d'autres utilisent "workflows agentiques", "pipelines de documents autonomes" ou "plateformes d'intelligence documentaire". Les distinctions sont subtiles et souvent axées sur le marketing. Ce qui compte pour l'évaluation n'est pas l'étiquette mais la capacité : le système peut-il à la fois interpréter des instructions non structurées et manipuler des fichiers de documents via de vraies API ?
En pratique, le terme "agent de documents" couvre plusieurs types de systèmes — y compris les agents axés sur l'extraction qui ingèrent, classent et acheminent les documents, et les agents qui interprètent directement les instructions en langage naturel et manipulent ou génèrent des documents. Dans cet article, le terme fait spécifiquement référence aux agents qui combinent le raisonnement d'un modèle de langage avec des API de traitement de documents. Vous trouverez ci-dessous une comparaison fonctionnelle qui distingue un agent de documents IA des technologies connexes. Ces catégories se chevauchent considérablement — de nombreux produits en combinent plusieurs — mais comprendre où chaque approche excelle aide à clarifier ce qu'un agent ajoute réellement.
| Approche | Force principale | Comment il gère les instructions | Limitation typique |
|---|---|---|---|
| Point de terminaison LLM uniquement | Compréhension approfondie du langage | Interprète très efficacement le langage naturel | Ne fournit pas en soi un contrôle déterministe et conscient du format sur les structures de fichiers Office et PDF ; produit du texte brut ou du HTML à moins d'être combiné avec des outils de traitement de documents |
| Agent en langage naturel | Relie la compréhension à l'exécution d'outils | Prend des demandes de haut niveau et enchaîne les outils appropriés | Dépend de la qualité des outils disponibles et de la logique d'orchestration |
| SDK / API traditionnel | Manipulation de fichiers déterministe et précise | Nécessite des commandes programmatiques explicites ; aucune compréhension du langage | Rigide — chaque changement de modèle ou de format d'entrée nécessite des mises à jour de code |
| RPA (Automatisation des processus robotisés) | Automatise les interactions au niveau de l'interface utilisateur entre les applications | Suit des workflows scriptés ; certains RPA modernes incluent la vision et l'OCR | A du mal avec les instructions ambiguës qui nécessitent une interprétation sémantique — le RPA est basé sur des robots logiciels qui gèrent les données entre les applications en suivant des règles prédéfinies, alors que les agents interprètent des demandes en langage naturel ouvertes |
| OCR (Reconnaissance optique de caractères) | Convertit les images / numérisations en texte lisible par machine | Opère sur le contenu visuel ; extrait les caractères et la mise en page de base | N'effectue pas de génération de documents, d'analyse ou de workflows en plusieurs étapes |
Ces capacités apparaissent souvent ensemble dans les systèmes de production. Un pipeline de documents d'entreprise peut utiliser l'OCR pour numériser des factures, transmettre le texte extrait via un LLM pour une classification sémantique, acheminer le résultat dans un workflow RPA pour la saisie de données, et enfin générer un rapport de marque à l'aide d'une API de document. Un agent de documents IA se place au centre d'un tel pipeline en tant que composant qui comprend la demande humaine et coordonne les outils nécessaires pour la satisfaire.
Lorsque les gens recherchent "qu'est-ce que le traitement de documents par IA" ou "comment fonctionnent les agents de documents IA", ils essaient généralement de comprendre si l'achat ou la construction d'un tel système est différent de la combinaison manuelle d'outils prêts à l'emploi. La réponse courte : oui — lorsque la variété des documents, la variabilité des instructions et la fidélité du formatage sont suffisamment importantes pour justifier une couche d'orchestration dédiée entre la compréhension du langage et la manipulation de fichiers.
3. Comment fonctionne un agent IA pour le traitement de documents ?
À un niveau élevé, un agent de documents IA suit cinq étapes conceptuelles :
L'utilisateur fournit une instruction en langage naturel
     ↓
Le modèle IA interprète l'intention et identifie les opérations nécessaires
     ↓
L'agent sélectionne les outils ou API de traitement de documents appropriés
     ↓
Les API de documents exécutent des opérations au niveau du fichier (lecture, modification, génération)
     ↓
Le document de sortie est généré à l'aide d'opérations de traitement de documents déterministes
Chaque étape introduit des décisions qui déterminent la précision, la fiabilité et la mise en forme du résultat final. Comprendre ces décisions clarifie pourquoi un LLM pur ne peut pas produire de manière fiable de vrais fichiers Word ou Excel — et pourquoi un SDK traditionnel seul ne peut pas comprendre une demande vague ou ouverte.
Architecture : De l'intention au fichier
Une implémentation typique enchaîne cinq couches, faisant passer le document par chaque étape, de l'intention à la sortie :
Exemple : D'une demande en langage naturel à un document fini
Considérez un scénario que de nombreuses équipes financières rencontrent chaque mois : un responsable envoie un dossier de classeurs de ventes régionales et demande un rapport de synthèse consolidé au format Word.
La demande en langage naturel d'un utilisateur pourrait ressembler à ceci :
"Lis tous les fichiers de ventes du T3 dans ce dossier, compare chaque région au trimestre précédent, résume les tendances clés et les valeurs aberrantes, et enregistre les résultats sous forme de document Word formaté."
En coulisses, l'agent décompose cette phrase unique en une séquence d'opérations :
- Découvrir et ouvrir chaque fichier
.xlsxdans le répertoire spécifié. - Lire les lignes de synthèse ou les feuilles clés de chaque classeur.
- Calculer les changements d'une période à l'autre.
- Identifier les régions les plus performantes et les moins performantes.
- Rédiger un résumé narratif décrivant les tendances.
- Créer un nouveau document Word, insérer le résumé, ajouter des tableaux montrant les comparaisons régionales et appliquer une mise en forme cohérente avec les modèles de l'entreprise.
Le livrable fini — le rapport Word consolidé avec le résumé narratif et les tableaux de comparaison régionale :
Sans agent, un développeur devrait généralement construire et orchestrer chacune de ces six étapes — écrire du code pour la découverte de fichiers, la lecture de données, le calcul des changements, l'appel à un LLM pour la génération de texte, l'analyse de sa réponse et son mappage dans une mise en page structurée. Avec un agent, les étapes 4 à 6 peuvent être exprimées en une seule instruction, tandis que les étapes 1 à 3 exploitent toujours les mêmes capacités d'analyse de fichiers que votre application possède déjà.
Ce type de workflow multi-format — où la lecture de données à partir d'un type de fichier et la production de résultats dans un autre nécessite à la fois un raisonnement sémantique et une manipulation précise des fichiers — est exactement là où les agents IA apportent le plus de valeur. Des outils comme Spire.Agent.Office regroupent la couche d'orchestration avec des API de documents déterministes afin que les développeurs obtiennent une interface en langage naturel sans perdre le contrôle sur la mise en forme, la mise en page ou la fidélité de la sortie.
4. Que peuvent faire les agents IA avec les documents ?
Selon les capacités des outils de traitement de documents sous-jacents, les agents IA peuvent potentiellement couvrir un large éventail d'opérations documentaires que les développeurs implémentent traditionnellement avec du code explicite — mais exprimées par l'intention plutôt que par la syntaxe. Le tableau ci-dessous montre des catégories d'opérations représentatives que de nombreuses implémentations prennent en charge lorsque leurs outils de traitement de documents sous-jacents offrent ces capacités.
| Capacité | Word (.docx/.doc) | Excel (.xlsx/.xls) | PowerPoint (.pptx/.ppt) | PDF (.pdf) |
|---|---|---|---|---|
| Créer à partir de zéro ou de données | Oui — paragraphes, tableaux, titres, styles | Oui — feuilles, cellules, formules, graphiques | Oui — diapositives, mises en page, thèmes | Oui — sections, blocs de texte, annotations |
| Modifier des documents existants | Oui — insérer, remplacer, refaire le contenu | Oui — mettre à jour les cellules, réorganiser les lignes/colonnes | Oui — modifier le contenu des diapositives, réorganiser | Oui — ajouter/supprimer des pages, annoter, masquer |
| Convertir entre formats | Oui ↔ PDF, HTML, XPS, Markdown | Oui ↔ CSV, PDF, HTML | Oui ↔ PDF | Oui ↔ DOCX, HTML, formats d'image |
| Analyser / Résumer le contenu | Oui — extraire des clauses, identifier la structure | Oui — comparer des ensembles de données, calculer des statistiques | Oui — examiner les récits de diapositives | Oui — classer les pages, extraire des informations clés |
| Extraire des données (structurées) | Oui — extraire du texte des paragraphes et des tableaux | Oui — lire les valeurs des cellules, plages, plages nommées | Limité — texte des diapositives et notes | Oui — analyser les formulaires, tableaux, texte intégré |
Les capacités réelles dépendent des bibliothèques de traitement de documents sous-jacentes et de l'implémentation spécifique de l'agent.
Les cas d'utilisation courants qui relèvent de ces capacités incluent :
- Examen de contrats et d'accords : Lire les PDF ou fichiers Word entrants, signaler les clauses inhabituelles ou les dispositions manquantes, et produire un résumé en Markdown ou Word.
- Consolidation de rapports : Agréger des feuilles de calcul disparates provenant de plusieurs régions, détecter les anomalies et générer un rapport Word ou PDF prêt pour la direction.
- Génération de présentations : Intégrer un document d'information ou un ensemble de données dans un modèle de présentation et produire un jeu de diapositives fini avec des graphiques et des points de discussion.
- Traitement de factures et de formulaires : Ouvrir des factures numérisées ou numériques, extraire les éléments de ligne et les totaux, vérifier par rapport aux bons de commande et remplir les systèmes en aval.
- Maintenance des politiques et manuels : Mettre à jour les documents des employés en remplaçant les noms, les dates et le langage spécifique au département dans des dizaines de modèles.
Pour les équipes qui construisent déjà des workflows documentaires aujourd'hui, ces capacités ne remplacent pas leur logique existante — elles l'étendent. Un agent gère les parties d'un workflow qui dépendent de la communication humaine (comprendre quoi faire), tandis que les API de documents sous-jacentes gèrent les parties qui dépendent de la précision (produire le bon fichier avec la bonne mise en page). Consultez les tutoriels officiels sur la génération de contrats par lots et la génération de présentations à partir de documents pour des exemples de la façon dont ces opérations s'intègrent dans des applications réelles.
5. Approches de l'automatisation des documents
Toutes les organisations ne se tournent pas vers un agent IA lors de l'automatisation des workflows documentaires. Le choix technologique dépend des types de documents que vous gérez, de leur fréquence de changement et de l'effort d'ingénierie dont vous disposez. Vous trouverez ci-dessous une comparaison des principales approches que vous rencontrerez en pratique.
| Approche | Forces | Limitations | Mieux adapté pour |
|---|---|---|---|
| Agent en langage naturel | Interaction conviviale ; code standard minimal ; s'adapte à des formats d'entrée variés | Nécessite une intégration avec une couche de traitement de documents ; dépend de la précision du modèle pour les instructions complexes | Équipes qui reçoivent des documents avec des structures incohérentes et souhaitent une itération rapide sans recompiler |
| API LLM + code personnalisé | Hautement personnalisable ; choix des meilleurs modèles pour chaque tâche ; contrôle total sur l'orchestration | Effort d'ingénierie important pour les E/S de fichiers, la gestion des erreurs, le formatage et la validation | Organisations exécutant déjà une pile LLM qui souhaitent une flexibilité maximale et disposent de ressources d'ingénierie |
| SDK / API de documents traditionnel | Entièrement déterministe ; contrôle précis sur la mise en page, le style et la cohérence de la sortie ; aucune dépendance au modèle lors de l'exécution | Nécessite des instructions programmatiques explicites pour chaque scénario ; rigide lorsque les modèles ou les structures d'entrée changent fréquemment | Documents à format fixe avec une structure prévisible qui changent rarement, comme des formulaires standardisés ou des rapports de conformité |
| RPA / moteur de workflow | Bon pour automatiser les processus répétitifs basés sur des règles entre les systèmes ; exploite l'infrastructure existante | Moins flexible pour les tâches ambiguës ou ouvertes ; a du mal lorsque les formats de documents varient considérablement | Processus de back-office avec un volume élevé et une faible variance, comme la saisie de factures dans les systèmes ERP |
Aucune de ces approches n'est universellement supérieure. Une stratégie d'automatisation documentaire mature combine souvent plus d'une approche. Par exemple, une organisation peut utiliser du code SDK traditionnel pour générer des rapports de conformité fixes et réserver un agent IA pour des tâches d'analyse ad hoc qui varient d'une semaine à l'autre.
Là où une solution comme Spire.Agent.Office se différencie, c'est en offrant un SDK unique qui fournit à la fois l'interface en langage naturel et les capacités de traitement de documents déterministes nécessaires pour transformer les instructions en fichiers réels. Plutôt que de connecter des services LLM séparés, des bibliothèques de formatage personnalisées et une logique d'orchestration, les développeurs ajoutent un processeur IA à leurs objets de document existants — un appel unique AI(options) sur n'importe quelle instance Document, Workbook, Presentation ou PdfDocument — puis émettent des instructions en langage clair qui renvoient une sortie formatée tout en préservant la mise en page, les polices, les tableaux et les styles.
Si vous utilisez déjà une bibliothèque de documents traditionnelle pour des opérations déterministes, l'ajout d'une couche d'agent signifie généralement envelopper le même objet Document ou Spreadsheet avec un processeur IA et remplacer la logique de remplacement champ par champ par des instructions déclaratives. La courbe d'apprentissage se concentre sur l'écriture de prompts efficaces plutôt que sur l'apprentissage d'un nouveau format de fichier.
6. Traitement de documents par IA vs Traitement intelligent de documents (IDP)
Si vous avez fait des recherches sur l'automatisation documentaire de manière professionnelle, vous rencontrerez plusieurs termes qui se chevauchent : traitement de documents par IA, traitement intelligent de documents (ou IDP), intelligence documentaire, automatisation documentaire par IA et agent de documents IA. Comprendre leur relation aide à restreindre ce que vous recherchez réellement — et évite la confusion causée par la terminologie des fournisseurs qui varie selon les marchés.
Dans l'usage courant :
- Le traitement de documents par IA est souvent utilisé comme un terme générique — il fait référence à toute approche qui applique des techniques d'intelligence artificielle pour comprendre, créer, modifier, convertir ou analyser des documents. Cependant, la façon dont ce terme est défini largement ou étroitement varie selon à qui vous vous adressez.
- Le traitement intelligent de documents (IDP) est né dans la gestion documentaire d'entreprise avec un accent sur la phase de capture et d'extraction : numériser ou ingérer des documents, les classer par type (facture, reçu, contrat), appliquer l'OCR, extraire des champs, valider par rapport aux règles métier et acheminer vers les systèmes en aval. Au fil du temps, les limites de ce qui compte comme IDP ont changé à mesure que les fournisseurs intègrent l'IA générative dans leurs produits.
- L'intelligence documentaire est parfois utilisée de manière interchangeable avec l'IDP, mais met souvent davantage l'accent sur l'extraction et la compréhension que sur la génération. Les fournisseurs dans les espaces de la technologie juridique et des services financiers privilégient cette terminologie.
- L'automatisation documentaire par IA met en évidence le côté exécution — utiliser l'IA pour déclencher des workflows qui produisent, envoient ou modifient des documents en fonction de déclencheurs ou de demandes des utilisateurs.
- L'agent de documents IA se concentre sur l'aspect orchestrateur : un système qui reçoit une intention en langage naturel, planifie les opérations nécessaires et délègue aux outils requis pour terminer le travail.
Ces définitions sont conventionnelles plutôt que formelles. Vous trouverez différents fournisseurs plaçant des limites à différents points, et de nombreux produits couvrent plusieurs catégories simultanément. Le point clé n'est pas l'étiquette que porte l'outil que vous avez choisi, mais si l'outil peut faire ce dont vous avez réellement besoin : comprendre une demande, choisir les bonnes opérations, les exécuter sur de vrais fichiers et renvoyer une sortie structurée.
Par exemple, un système étiqueté "plateforme d'intelligence documentaire" peut exceller dans la classification et l'extraction mais manquer de fortes capacités de génération. Un "agent de documents IA" peut prendre en charge la génération en plus de l'extraction, de la classification et de l'acheminement, selon ses outils et le workflow prévu. En pratique, les meilleures solutions combinent l'extraction, le raisonnement et la génération sous un même toit — c'est pourquoi des frameworks comme Spire.Agent.Office se positionnent comme des agents de bout en bout plutôt que comme des solutions ponctuelles pour une seule étape du pipeline.
7. Pourquoi les agents IA sont utiles pour le traitement de documents
La raison fondamentale pour laquelle les agents IA sont importants pour le travail documentaire est simple : la plupart des tâches documentaires significatives impliquent trois exigences simultanément.
Premièrement, le système doit comprendre ce que l'utilisateur veut. "Prépare un résumé trimestriel à partir de ces rapports" n'est pas une requête structurée — elle laisse indéterminé quels fichiers lire, quelles mesures extraire, comment structurer la sortie et quel ton utiliser. Un modèle de langage excelle à résoudre cette ambiguïté.
Deuxièmement, le système doit exécuter des actions sur des fichiers réels. Générer du texte cohérent dans une fenêtre de chat est différent de produire un .docx avec les styles de paragraphe, les marges de page, les bordures de tableau et les graphiques intégrés corrects. Un modèle de langage seul ne fournit pas de contrôle déterministe et conscient du format sur les structures de fichiers Office.
Troisièmement, le système doit s'assurer que la sortie préserve la structure et la mise en forme. Les documents commerciaux comportent des contraintes qui vont au-delà du texte lisible : numérotation des clauses, hiérarchies de sections, en-têtes de pied de page, champs de fusion, règles de mise en forme conditionnelle. Ce sont des propriétés structurelles qui appartiennent au format de fichier lui-même, et non au texte brut.
Un SDK traditionnel est conçu pour répondre aux points #2 et #3 de manière déterministe, mais il ne fournit pas la compréhension de l'intention au niveau du langage décrite au point #1. Une API LLM brute peut répondre efficacement au point #1, mais ne fournit pas en soi un contrôle déterministe sur les points #2 et #3. Combiner les deux — placer un modèle de langage derrière une couche de traitement de documents déterministe — est ce qui rend un agent utile pour le travail documentaire réel.
Les organisations qui traitent de gros volumes de documents sont souvent confrontées à la même tension fondamentale : les documents nécessitent à la fois une compréhension sémantique (pour comprendre quoi faire) et une manipulation de fichiers déterministe (pour produire une sortie correctement formatée). Les agents IA répondent à cette tension en combinant les deux capacités sous une seule interface.
Les analystes de l'industrie s'attendent à ce que cette combinaison devienne la norme plutôt que l'exception. Gartner prédit que d'ici 2028, 33 % des applications logicielles d'entreprise incluront de l'IA agentique, contre moins de 1 % en 2024, et que 15 % des décisions de travail quotidiennes seront prises de manière autonome — un changement avec des implications directes pour les workflows commerciaux lourds en documents.
8. Foire aux questions (FAQ)
Quelle est la différence entre un agent de documents IA et un LLM classique ?
Un LLM (Large Language Model) est un réseau neuronal entraîné à générer et à comprendre du texte. Il opère sur des séquences de jetons. En soi, il ne fournit pas de contrôle déterministe et conscient du format sur les structures de fichiers Office ou PDF — bien que les systèmes alimentés par LLM puissent accéder à ces formats via des outils et des API distincts. Un agent de documents IA se place au-dessus d'un LLM (ou modèle similaire) et le connecte à des outils de traitement de documents capables d'ouvrir des fichiers .docx, .xlsx, .pptx et .pdf, d'exécuter des opérations sur eux et de produire une sortie bien formée. Le LLM fournit la compréhension ; l'agent fournit le pont vers les fichiers réels.
Dois-je envoyer des documents dans le cloud pour utiliser un agent de documents IA ?
Pas nécessairement. De nombreux agents de documents IA peuvent fonctionner entièrement au sein de votre propre infrastructure — le SDK ou le service s'exécute sur site ou dans un cloud privé, et les documents restent dans votre environnement. Pour analyser le contenu, les couches de texte pertinentes sont transmises au modèle sous-jacent, qui peut résider sur une API hébergée ou localement selon la configuration. Si la confidentialité des données est une préoccupation, recherchez des solutions qui prennent en charge le déploiement de modèles locaux ou vous permettent de configurer l'origine des appels de modèle.
Quels formats de documents les agents IA prennent-ils en charge ?
Les agents de documents IA peuvent prendre en charge un large éventail de formats, mais l'ensemble exact varie considérablement selon l'implémentation. Certains agents se concentrent principalement sur les workflows PDF et OCR basés sur l'image, tandis que d'autres gèrent les formats de fichiers Microsoft Office complets, notamment Word (.docx, .doc), Excel (.xlsx, .xls) et PowerPoint (.pptx, .ppt). Beaucoup prennent également en charge des formats intermédiaires tels que HTML, Markdown, XPS, CSV et les types d'images courants à des fins de conversion. Consultez la documentation pour connaître les limitations spécifiques au produit concernant les fichiers cryptés, les formats binaires hérités ou les modèles spécialisés.
Puis-je utiliser mon propre modèle d'IA avec un SDK d'agent de documents ?
Certains SDK d'agent de documents prennent en charge une intégration flexible des modèles, permettant aux développeurs de configurer le fournisseur ou le point de terminaison utilisé par l'agent. Vous pouvez souvent choisir entre des services hébergés comme OpenAI ou Azure OpenAI, des modèles open source exécutés dans votre environnement, ou des points de terminaison propriétaires fournis par le fournisseur du SDK. Les fournisseurs pris en charge varient selon l'implémentation, consultez donc le guide d'intégration du produit spécifique que vous évaluez.
En quoi un agent de documents IA diffère-t-il des outils RPA ou OCR ?
Le RPA (Robotic Process Automation) automatise principalement les workflows et les interactions prédéfinis, tandis que les agents IA peuvent interpréter des instructions de niveau supérieur et sélectionner dynamiquement des outils ou des actions en fonction du contexte. Les systèmes RPA modernes intègrent parfois l'OCR, le NLP ou même les LLM eux-mêmes, mais leur paradigme central reste l'automatisation des processus basée sur des règles.
L'OCR (Reconnaissance optique de caractères) convertit principalement le contenu visuel du document en texte lisible par machine, tandis qu'un agent de documents IA peut utiliser l'OCR comme un composant dans un workflow plus large qui inclut l'interprétation et les opérations documentaires. En pratique, les agents invoquent fréquemment l'OCR en interne lors du traitement de documents numérisés, mais vont bien au-delà de l'extraction de texte pour générer, formater et structurer de nouveaux fichiers à partir de ce qu'ils trouvent.
Le traitement de documents par IA est-il adapté aux workflows d'entreprise ?
Le traitement de documents par IA est de plus en plus adapté à un usage en entreprise, mais la préparation dépend de plusieurs facteurs pratiques. Du côté positif, les agents de documents modernes fournissent une manipulation de fichiers déterministe qui garantit que la sortie correspond aux modèles et aux directives de marque de l'entreprise. Ils s'exécutent dans les piles d'applications existantes sans obliger les utilisateurs à apprendre de nouvelles interfaces.
Les considérations clés avant le déploiement incluent la confidentialité des données (comment et où le texte du document est transmis), la fiabilité du modèle (gestion des cas limites où les instructions sont ambiguës), les processus d'examen humain pour les documents sensibles, et la capacité de configurer un comportement de repli lorsqu'un appel de modèle échoue. Les entreprises qui testent d'abord un agent pour des tâches à faible risque — mémos internes, résumés de brouillons, modèles non conformes — atteignent généralement les déploiements en production plus rapidement que celles qui tentent un déploiement à l'échelle de l'entreprise dès le premier jour.
Quelle est la différence entre le traitement de documents par IA et le Traitement intelligent de documents (IDP) ?
Le traitement intelligent de documents (IDP) fait généralement référence aux systèmes axés sur l'entreprise qui se spécialisent dans la phase de capture et d'extraction des workflows documentaires : ingérer des documents, les classer par type, appliquer l'OCR, extraire des champs structurés, valider par rapport aux règles métier et acheminer vers les systèmes en aval. Le traitement de documents par IA est un terme générique plus large qui englobe l'IDP mais inclut également la génération, la transformation, les workflows multi-formats et l'automatisation interactive basée sur des agents.
Une façon utile de penser à la distinction est que l'IDP met traditionnellement l'accent sur l'ingestion, la classification, l'extraction, la validation et l'orchestration des workflows en aval, tandis que le traitement de documents par IA est souvent utilisé plus largement pour inclure l'analyse, la génération, la transformation et le raisonnement basé sur des agents. Les deux catégories se chevauchent de plus en plus à mesure que les fournisseurs intègrent des capacités génératives dans les plateformes IDP et que les agents adoptent des pipelines d'extraction structurés.
Prêt à essayer le traitement de documents par IA ?
Le traitement de documents piloté par l'IA couvre un large éventail de cas d'utilisation, de la simple génération de rapports aux workflows multi-formats complexes qui combinent analyse de données, résumé et sortie structurée. Si vous évaluez des options pour intégrer des agents IA dans une application .NET, commencez par le tutoriel officiel Getting Started, puis explorez les guides thématiques sur la génération de contrats et l'automatisation de présentations.
Lectures complémentaires
- Présentation du produit Spire.Agent.Office — SDK d'agent IA pour le traitement de documents Word, Excel, PowerPoint et PDF
- Tutoriel sur la génération de contrats par lots — générer des contrats à partir de modèles et de sources de données
- Générer des PPT à partir de documents — transformer Word, PDF et d'autres formats en présentations
- Automatiser l'analyse et le classement des scores des étudiants dans Excel — analyse de données et classement avec des agents IA
- Générer divers modèles Word — créer des modèles que l'agent peut remplir
Agente de IA para el procesamiento de documentos: qué es y cómo funciona
Un agente de IA para el procesamiento de documentos es un sistema de software que utiliza modelos y herramientas de inteligencia artificial para comprender instrucciones en lenguaje natural y realizar tareas como crear, editar, convertir, analizar o extraer contenido de documentos, sin necesidad de escribir código línea por línea. Un agente de IA puede trabajar con archivos de Word, Excel, PowerPoint y PDF interpretando la intención del usuario, seleccionando las operaciones de procesamiento de documentos adecuadas y produciendo un resultado que conserve la estructura y el formato de archivo requeridos.
Los agentes de IA son un enfoque para automatizar el trabajo relacionado con documentos. Otros enfoques incluyen las API programáticas tradicionales, los puntos de enlace de modelos de lenguaje sin procesar utilizados con código personalizado y los motores de flujo de trabajo que automatizan pasos predefinidos. Este artículo explica qué es el procesamiento de documentos impulsado por IA, en qué se diferencia de los métodos anteriores y cuándo tiene sentido utilizarlo junto con otras tecnologías.
1. ¿Qué es el procesamiento de documentos con IA?
El procesamiento de documentos (la actividad de leer, crear, editar, convertir, extraer información o analizar documentos digitales) siempre ha sido una de las tareas de software más comunes en todas las industrias. Los correos electrónicos con facturas llegan en formato PDF. Los informes de ventas se encuentran dentro de libros de trabajo de Excel con diseños inconsistentes. Los manuales para empleados viven en plantillas de Word que cambian cada año. Los acuerdos legales se presentan como PDF escaneados de partes externas. Durante décadas, las organizaciones han escrito código para gestionar esta variedad.
Los enfoques tradicionales de procesamiento de documentos comparten un patrón común: alguien define qué debe suceder con qué documentos utilizando reglas explícitas. Un script para rellenar plantillas lee un archivo CSV y puebla un archivo .docx de Word reemplazando marcadores de posición predefinidos. Un script de Python itera sobre las columnas de Excel y llama a funciones de diseño para producir un informe con estilo. Una rutina de C# abre un PDF, busca campos específicos por posición o patrón de expresión regular y escribe los resultados en una base de datos. Estos métodos funcionan bien para flujos de trabajo estables y bien especificados, pero requieren instrucciones programáticas para cada variación. Cuando la plantilla cambia, cuando el formato de entrada se modifica o cuando ingresan nuevos tipos de documentos al flujo de trabajo, el código debe reescribirse, probarse y volver a desplegarse.
El procesamiento de documentos impulsado por IA amplía esas mismas operaciones introduciendo una capa de comprensión del lenguaje. En lugar de decirle al software exactamente qué marcador de posición reemplazar o qué rango de celdas leer, usted describe qué resultado desea en lenguaje natural: "Resuma este contrato y extraiga los términos de pago" o "Compare la hoja de cálculo de ventas del mes pasado con la de este mes y guarde el análisis como un informe formateado." El sistema utiliza un modelo de IA para interpretar esa instrucción, determina qué operaciones de documentos se necesitan, las ejecuta en formatos de archivo reales y devuelve un resultado correctamente estructurado.
En la práctica, el procesamiento de documentos con IA no reemplaza los enfoques tradicionales, sino que los aumenta. Es posible que las tareas simples y predecibles aún se manejen mejor mediante scripts basados en reglas porque son más rápidos y completamente deterministas. Pero cuando los documentos varían en estructura, cuando las entradas llegan en formatos impredecibles o cuando la pregunta que se le hace a un documento cambia con frecuencia, un enfoque asistido por IA ahorra esfuerzo de ingeniería y se adapta de manera más natural a los requisitos cambiantes.
2. ¿Qué es un agente de IA para el procesamiento de documentos?
Un agente de IA para el procesamiento de documentos es un sistema que combina el razonamiento de modelos de lenguaje con herramientas orientadas a documentos para que una persona pueda describir una tarea en términos conversacionales y obtener como resultado un documento real y bien formado.
La característica definitoria de un agente, en este contexto, es que une dos capacidades que la mayoría de los componentes individuales no poseen por sí solos:
- Comprensión. El sistema interpreta instrucciones abiertas y de alto nivel sobre qué hacer con un documento. "Revisar este acuerdo en busca de cláusulas de riesgo" o "Convertir estas cifras trimestrales en una presentación de diapositivas" no son consultas estructuradas; requieren comprensión semántica.
- Acción. Tras comprender la intención, el sistema selecciona y ejecuta operaciones concretas sobre los documentos: leer un archivo, extraer texto o tablas, insertar contenido, cambiar el diseño, generar un nuevo archivo, en formatos como
.docx,.xlsx,.pptxo.pdf.
Diferentes proveedores y grupos de investigación utilizan una terminología ligeramente diferente para estos conceptos. Algunos llaman a estos sistemas "asistentes de IA", otros utilizan "flujos de trabajo agénticos", "flujos autónomos de documentos" o "plataformas de inteligencia documental". Las distinciones son sutiles y a menudo responden al marketing. Lo que importa para la evaluación no es la etiqueta, sino la capacidad: ¿puede el sistema tanto interpretar instrucciones no estructuradas como manipular archivos de documentos a través de API reales?
En la práctica, el término "agente de documentos" abarca varios tipos de sistemas, incluidos aquellos centrados en la extracción que ingieren, clasifican y enrutan documentos, y agentes que interpretan directamente instrucciones en lenguaje natural y manipulan o generan documentos. En este artículo, el término se refiere específicamente a los agentes que combinan el razonamiento de modelos de lenguaje con API de procesamiento de documentos. A continuación, se presenta una comparación funcional que distingue un agente de documentos con IA de otras tecnologías relacionadas. Estas categorías se superponen significativamente (muchos productos combinan varias de ellas), pero comprender dónde destaca cada enfoque ayuda a aclarar lo que realmente aporta un agente.
| Enfoque | Fortaleza principal | Cómo maneja las instrucciones | Limitación típica |
|---|---|---|---|
| Solo endpoint de LLM | Profunda comprensión del lenguaje | Interpreta el lenguaje natural de manera muy eficaz | No proporciona por sí solo un control determinista y consciente del formato sobre las estructuras de archivos de Office y PDF; produce texto sin formato o HTML a menos que se combine con herramientas de procesamiento de documentos |
| Agente de lenguaje natural | Une la comprensión con la ejecución de herramientas | Toma solicitudes de alto nivel y encadena las herramientas adecuadas | Depende de la calidad de las herramientas disponibles y la lógica de orquestación |
| SDK / API tradicional | Manipulación de archivos precisa y determinista | Requiere comandos programáticos explícitos; sin comprensión del lenguaje | Rígido: cada cambio en la plantilla o en el formato de entrada requiere actualizaciones de código |
| RPA (Automatización Robótica de Procesos) | Automatiza interacciones a nivel de interfaz de usuario entre aplicaciones | Sigue flujos de trabajo programados; algunas soluciones de RPA modernas incluyen visión por computadora y OCR | Tiene dificultades con instrucciones ambiguas que requieren interpretación semántica: la RPA (Automatización Robótica de Procesos) se basa en robots de software que manejan datos entre aplicaciones siguiendo reglas predefinidas, mientras que los agentes interpretan solicitudes abiertas en lenguaje natural |
| OCR (Reconocimiento Óptico de Caracteres) | Convierte imágenes / escaneos en texto legible por máquina | Opera sobre contenido visual; extrae caracteres y diseño básico | No realiza generación de documentos, análisis ni flujos de trabajo de varios pasos |
Estas capacidades a menudo aparecen juntas en sistemas de producción. Un flujo de trabajo de documentos empresarial puede usar OCR para digitalizar facturas escaneadas, pasar el texto extraído a través de un LLM para su clasificación semántica, enrutar el resultado a un flujo de RPA para la entrada de datos y finalmente generar un informe de marca utilizando una API de documentos. Un agente de documentos con IA se sitúa en el centro de dicho flujo de trabajo como el componente que comprende la solicitud humana y coordina las herramientas necesarias para cumplirla.
Cuando las personas buscan "qué es el procesamiento de documentos con IA" o "cómo funcionan los agentes de documentos con IA", generalmente intentan comprender si comprar o construir dicho sistema es diferente de combinar manualmente herramientas listas para usar. La respuesta corta es sí: cuando la variedad de documentos, la variabilidad de las instrucciones y la fidelidad del formato importan lo suficiente como para justificar una capa de orquestación dedicada entre la comprensión del lenguaje y la manipulación de archivos.
3. ¿Cómo funciona un agente de documentos con IA?
A un alto nivel, un agente de documentos con IA sigue cinco etapas conceptuales:
El usuario proporciona una instrucción en lenguaje natural
     ↓
El modelo de IA interpreta la intención e identifica las operaciones necesarias
     ↓
El agente selecciona las herramientas o API de procesamiento de documentos adecuadas
     ↓
Las API de documentos ejecutan operaciones a nivel de archivo (leer, modificar, generar)
     ↓
El documento de salida se genera mediante operaciones deterministas de procesamiento de documentos
Cada etapa introduce decisiones que determinan qué tan preciso, confiable y bien formateado será el resultado final. Comprender estas decisiones aclara por qué un LLM puro no puede producir por sí solo archivos reales de Word o Excel de manera confiable, y por qué un SDK tradicional no puede comprender una solicitud vaga o abierta.
Arquitectura: de la intención al archivo
Una implementación típica encadena cinco capas, pasando el documento a través de cada etapa, desde la intención hasta el resultado:
Ejemplo: de una solicitud en lenguaje natural a un documento terminado
Considere un escenario con el que muchos equipos de finanzas se encuentran cada mes: un gerente envía una carpeta con libros de trabajo de ventas regionales y solicita un informe resumido consolidado en formato Word.
La solicitud en lenguaje natural de un usuario podría ser algo como:
"Lea todos los archivos de ventas del T3 en esta carpeta, compare cada región con el trimestre anterior, resuma las tendencias clave y los valores atípicos, y guarde los resultados como un documento de Word formateado."
Detrás de escena, el agente descompone esa única frase en una secuencia de operaciones:
- Descubrir y abrir cada archivo
.xlsxen el directorio especificado. - Leer las filas de resumen o las hojas clave de cada libro de trabajo.
- Calcular los cambios periodo tras periodo.
- Identificar las regiones con mejor y peor rendimiento.
- Redactar un resumen narrativo que describa las tendencias.
- Crear un nuevo documento de Word, insertar el resumen, agregar tablas que muestren las comparaciones regionales y aplicar un formato coherente con las plantillas corporativas.
El entregable final (el informe consolidado de Word con el resumen narrativo y las tablas de comparación regional):
Sin un agente, un desarrollador normalmente necesitaría construir y orquestar cada uno de esos seis pasos: escribir código para el descubrimiento de archivos, leer datos, calcular cambios, llamar a un LLM para la generación de texto, analizar su respuesta y mapearla en un diseño de documento estructurado. Con un agente, los pasos 4 a 6 se pueden expresar en una sola instrucción, mientras que los pasos 1 a 3 siguen aprovechando las mismas capacidades de análisis de archivos que su aplicación ya posee.
Este tipo de flujo de trabajo multiformato, donde leer datos de un tipo de archivo y producir resultados en otro requiere tanto razonamiento semántico como una manipulación precisa de archivos, es exactamente donde los agentes de IA aportan el mayor valor. Herramientas como Spire.Agent.Office empaquetan la capa de orquestación junto con API deterministas de documentos para que los desarrolladores obtengan una interfaz en lenguaje natural sin perder el control sobre el formato, el diseño o la fidelidad del resultado.
4. ¿Qué pueden hacer los agentes de IA con los documentos?
Dependiendo de las capacidades de las herramientas de procesamiento de documentos subyacentes, los agentes de IA pueden cubrir potencialmente una amplia gama de operaciones de documentos que los desarrolladores tradicionalmente implementan con código explícito, solo que expresadas a través de la intención en lugar de la sintaxis. La tabla a continuación muestra categorías de operaciones representativas que muchas implementaciones admiten cuando sus herramientas subyacentes proporcionan dichas capacidades.
| Capacidad | Word (.docx/.doc) | Excel (.xlsx/.xls) | PowerPoint (.pptx/.ppt) | PDF (.pdf) |
|---|---|---|---|---|
| Crear desde cero o a partir de datos | Sí: párrafos, tablas, encabezados, estilos | Sí: hojas, celdas, fórmulas, gráficos | Sí: diapositivas, diseños, temas | Sí: secciones, bloques de texto, anotaciones |
| Editar documentos existentes | Sí: insertar, reemplazar, reestructurar contenido | Sí: actualizar celdas, reorganizar filas/columnas | Sí: modificar contenido de diapositivas, reordenar | Sí: agregar/eliminar páginas, anotar, redactar |
| Convertir entre formatos | Sí ↔ PDF, HTML, XPS, Markdown | Sí ↔ CSV, PDF, HTML | Sí ↔ PDF | Sí ↔ DOCX, HTML, formatos de imagen |
| Analizar / Resumir contenido | Sí: extraer cláusulas, identificar estructura | Sí: comparar conjuntos de datos, calcular estadísticas | Sí: revisar narrativas de diapositivas | Sí: clasificar páginas, extraer información clave |
| Extraer datos (estructurados) | Sí: extraer texto de párrafos y tablas | Sí: leer valores de celdas, rangos, rangos con nombre | Limitado: texto de diapositivas y notas | Sí: analizar formularios, tablas, texto incrustado |
Las capacidades reales dependen de las bibliotecas de procesamiento de documentos subyacentes y de la implementación específica del agente.
Los casos de uso comunes que se incluyen en estas capacidades incluyen:
- Revisión de contratos y acuerdos: Leer archivos PDF o Word entrantes, señalar cláusulas inusuales o disposiciones faltantes y producir un informe resumido en Markdown o Word.
- Consolidación de informes: Agregar hojas de cálculo disparejas de múltiples regiones, detectar anomalías y generar un informe en Word o PDF listo para la gerencia.
- Generación de presentaciones: Introducir un documento informativo o un conjunto de datos en una plantilla de presentación y producir una presentación terminada con gráficos y puntos de discusión.
- Procesamiento de facturas y formularios: Abrir facturas escaneadas o digitales, extraer elementos de línea y totales, verificar contra órdenes de compra y poblar sistemas posteriores.
- Mantenimiento de políticas y manuales: Actualizar documentos de empleados reemplazando nombres, fechas y lenguaje específico de departamentos en docenas de plantillas.
Para los equipos que ya construyen flujos de trabajo de documentos hoy en día, estas capacidades no reemplazan su lógica existente, sino que la amplían. Un agente maneja las partes de un flujo de trabajo que dependen de la comunicación humana (comprender qué hacer), mientras que las API de documentos subyacentes manejan las partes que dependen de la precisión (producir el archivo correcto con el diseño adecuado). Consulte los tutoriales oficiales sobre generación de contratos en lote y generación de presentaciones a partir de documentos para ver ejemplos de cómo encajan estas operaciones en aplicaciones reales.
5. Enfoques para la automatización de documentos
No todas las organizaciones recurren a un agente de IA cuando automatizan flujos de trabajo de documentos. La elección de la tecnología depende de los tipos de documentos que maneje, la frecuencia con la que cambien y el esfuerzo de ingeniería disponible. A continuación, se muestra una comparación de los enfoques principales que encontrará en la práctica.
| Enfoque | Fortalezas | Limitaciones | Más adecuado para |
|---|---|---|---|
| Agente de lenguaje natural | Interacción amigable para el usuario; código repetitivo mínimo; se adapta a variados formatos de entrada | Requiere integración con una capa de procesamiento de documentos; depende de la precisión del modelo para instrucciones complejas | Equipos que reciben documentos con estructuras inconsistentes y desean una iteración rápida sin recompilar |
| API de LLM + código personalizado | Altamente personalizable; permite elegir los mejores modelos para cada tarea; control total sobre la orquestación | Esfuerzo de ingeniería significativo para E/S de archivos, manejo de errores, formato y validación | Organizaciones que ya ejecutan una arquitectura de LLM y desean la máxima flexibilidad con capacidad de ingeniería disponible |
| SDK / API de documentos tradicional | Completamente determinista; control preciso sobre el diseño, el estilo y la coherencia del resultado; sin dependencia de modelos en tiempo de ejecución | Requiere instrucciones programáticas explícitas para cada escenario; rígido cuando las plantillas o estructuras de entrada cambian con frecuencia | Documentos de formato fijo con estructura predecible que rara vez cambian, como formularios estandarizados o informes de cumplimiento |
| RPA / motor de flujo de trabajo | Bueno para automatizar procesos repetibles y basados en reglas entre sistemas; aprovecha la infraestructura existente | Menos flexible para tareas ambiguas o abiertas; se dificulta cuando los formatos de los documentos varían ampliamente | Procesos de oficina posterior (back-office) con alto volumen y baja varianza, como la entrada de facturas en sistemas ERP |
Ninguno de estos enfoques es universalmente superior. Una estrategia madura de automatización de documentos a menudo combina más de uno. Por ejemplo, una organización podría utilizar código SDK tradicional para generar informes de cumplimiento fijos y reservar un agente de IA para tareas de análisis ad hoc que varían de una semana a otra.
Donde una solución como Spire.Agent.Office se diferencia es al ofrecer un único SDK que proporciona tanto la interfaz en lenguaje natural como las capacidades deterministas de procesamiento de documentos requeridas para convertir instrucciones en archivos reales. En lugar de conectar servicios de LLM independientes, bibliotecas de formato personalizadas y lógica de orquestación, los desarrolladores agregan un procesador de IA a sus objetos de documentos existentes (una sola llamada a AI(options) en cualquier instancia de Document, Workbook, Presentation o PdfDocument) y luego emiten instrucciones en lenguaje sencillo que devuelven resultados formateados conservando el diseño, las fuentes, las tablas y los estilos.
Si ya utiliza una biblioteca de documentos tradicional para operaciones deterministas, agregar una capa de agente generalmente significa envolver el mismo objeto Document o Spreadsheet con un procesador de IA y reemplazar la lógica de sustitución campo por campo con instrucciones declarativas. La curva de aprendizaje se centra en escribir prompts eficaces en lugar de aprender un nuevo formato de archivo.
6. Procesamiento de documentos con IA vs. Procesamiento inteligente de documentos (IDP)
Si ha investigado la automatización de documentos de manera profesional, se encontrará con varios términos superpuestos: procesamiento de documentos con IA, procesamiento inteligente de documentos (o IDP), inteligencia documental, automatización de documentos con IA y agente de documentos con IA. Comprender su relación ayuda a delimitar lo que realmente está buscando y evita la confusión causada por la terminología de proveedores que varía según el mercado.
En el uso común:
- El procesamiento de documentos con IA se utiliza a menudo como un término general amplio: se refiere a cualquier enfoque que aplique técnicas de inteligencia artificial para comprender, crear, editar, convertir o analizar documentos. Sin embargo, la amplitud con la que se define este término varía según a quién se le pregunte.
- El Procesamiento Inteligente de Documentos (IDP) se originó en la gestión documental empresarial con un énfasis en la fase de captura y extracción: escanear o ingerir documentos, clasificarlos por tipo (factura, recibo, contrato), aplicar OCR, extraer campos, validar contra reglas de negocio y enrutar a sistemas posteriores. Con el tiempo, los límites de lo que se considera IDP han cambiado a medida que los proveedores incorporan IA generativa en sus productos.
- La inteligencia documental se utiliza a veces de manera indistinta con IDP, pero a menudo tiene un mayor énfasis en la extracción y la comprensión por encima de la generación. Los proveedores en los sectores legal y de servicios financieros prefieren esta terminología.
- La automatización de documentos con IA destaca el lado de la ejecución: el uso de IA para desencadenar flujos de trabajo que producen, envían o modifican documentos según activadores o solicitudes de usuarios.
- El agente de documentos con IA se centra en el aspecto del orquestador: un sistema que recibe una intención en lenguaje natural, planifica las operaciones necesarias y delega en las herramientas que se requieran para completar el trabajo.
Estas definiciones son convencionales en lugar de formales. Encontrará diferentes proveedores marcando límites en diferentes puntos, y muchos productos abarcan múltiples categorías simultáneamente. La conclusión principal no es qué etiqueta lleva la herramienta elegida, sino si la herramienta puede hacer lo que usted realmente necesita: comprender una solicitud, seleccionar las operaciones correctas, ejecutarlas en archivos reales y devolver un resultado estructurado.
Por ejemplo, un sistema etiquetado como "plataforma de inteligencia documental" podría destacar en la clasificación y extracción, pero carecer de capacidades sólidas de generación. Un "agente de documentos con IA" puede admitir la generación además de la extracción, clasificación y enrutamiento, según sus herramientas y el flujo de trabajo previsto. En la práctica, las mejores soluciones combinan extracción, razonamiento y generación bajo un mismo techo, razón por la cual marcos como Spire.Agent.Office se posicionan como agentes de extremo a extremo en lugar de soluciones puntuales para una sola etapa del flujo de trabajo.
7. Por qué son útiles los agentes de IA para el procesamiento de documentos
La razón fundamental por la que los agentes de IA son importantes para el trabajo con documentos es simple: la mayoría de las tareas significativas con documentos implican tres requisitos de manera simultánea.
Primero, el sistema necesita comprender lo que quiere el usuario. "Preparar un resumen trimestral a partir de estos informes" no es una consulta estructurada: deja sin especificar qué archivos leer, qué métricas extraer, cómo estructurar el resultado y qué tono utilizar. Un modelo de lenguaje destaca en resolver esa ambigüedad.
Segundo, el sistema necesita ejecutar acciones sobre archivos reales. Generar texto coherente en una ventana de chat es diferente de producir un archivo .docx con estilos de párrafo, márgenes de página, bordes de tabla y gráficos incrustados correctos. Un modelo de lenguaje por sí solo no proporciona un control determinista y consciente del formato sobre las estructuras de archivos de Office.
Tercero, el sistema debe garantizar que el resultado conserve la estructura y el formato. Los documentos comerciales conllevan restricciones que van más allá del texto legible: numeración de cláusulas, jerarquías de secciones, encabezados y pies de página, campos de combinación, reglas de formato condicional. Estas son propiedades estructurales que pertenecen al propio formato del archivo, no al texto plano.
Un SDK tradicional está diseñado para abordar los puntos n.º 2 y n.º 3 de manera determinista, pero no proporciona la comprensión de la intención a nivel de lenguaje descrita en el n.º 1. Una API de LLM básica puede abordar el n.º 1 de manera eficaz, pero no proporciona por sí sola un control determinista sobre los puntos n.º 2 y n.º 3. Combinar ambos (colocar un modelo de lenguaje detrás de una capa determinista de procesamiento de documentos) es lo que hace que un agente sea útil para el trabajo de documentos en el mundo real.
Las organizaciones que procesan grandes volúmenes de documentos a menudo enfrentan la misma tensión fundamental: los documentos requieren tanto comprensión semántica (para determinar qué hacer) como manipulación determinista de archivos (para producir resultados con el formato correcto). Los agentes de IA abordan esta tensión combinando ambas capacidades bajo una sola interfaz.
Los analistas de la industria esperan que esta combinación se convierta en la norma en lugar de la excepción. Gartner predice que para 2028, el 33% de las aplicaciones de software empresarial incluirán IA agéntica, frente a menos del 1% en 2024, y que el 15% de las decisiones de trabajo diarias se tomarán de forma autónoma, un cambio con implicaciones directas para los flujos de trabajo empresariales basados intensivamente en documentos.
8. Preguntas frecuentes
¿Cuál es la diferencia entre un agente de documentos con IA y un LLM regular?
Un LLM (modelo de lenguaje de gran tamaño) es una red neuronal entrenada para generar y comprender texto. Funciona con secuencias de tokens. Por sí solo, no proporciona un control determinista y consciente del formato sobre las estructuras de archivos de Office o PDF, aunque los sistemas impulsados por LLM pueden acceder a estos formatos a través de herramientas y API independientes. Un agente de documentos con IA se sitúa sobre un LLM (o un modelo similar) y lo conecta con herramientas de procesamiento de documentos que pueden abrir archivos .docx, .xlsx, .pptx y .pdf, ejecutar operaciones en ellos y producir un resultado bien formado. El LLM aporta la comprensión; el agente proporciona el puente hacia los archivos reales.
¿Necesito enviar documentos a la nube para usar un agente de documentos con IA?
No necesariamente. Muchos agentes de documentos con IA pueden ejecutarse por completo dentro de su propia infraestructura: el SDK o el servicio se ejecuta de forma local (on-premise) o en una nube privada, y los documentos permanecen dentro de su entorno. Para analizar el contenido, las capas de texto relevantes se transmiten al modelo subyacente, el cual puede residir en una API alojada o localmente según la configuración. Si la privacidad de los datos es una preocupación, busque soluciones que admitan el despliegue de modelos locales o le permitan configurar el origen de las llamadas al modelo.
¿Qué formatos de documentos admiten los agentes de IA?
Los agentes de documentos con IA pueden admitir una amplia gama de formatos, pero el conjunto exacto varía considerablemente según la implementación. Algunos agentes se centran principalmente en flujos de trabajo de PDF u OCR basados en imágenes, mientras que otros manejan formatos completos de Microsoft Office, incluidos Word (.docx, .doc), Excel (.xlsx, .xls) y PowerPoint (.pptx, .ppt). Muchos también admiten formatos intermedios como HTML, Markdown, XPS, CSV y tipos de imágenes comunes para fines de conversión. Consulte la documentación para conocer cualquier limitación específica del producto sobre archivos encriptados, formatos binarios heredados o plantillas especializadas.
¿Puedo usar mi propio modelo de IA con un SDK de agente de documentos?
Algunos SDK de agentes de documentos admiten una integración flexible de modelos, lo que permite a los desarrolladores configurar el proveedor o el punto de enlace utilizado por el agente. A menudo, puede elegir entre servicios alojados como OpenAI o Azure OpenAI, modelos de código abierto ejecutados en su entorno o puntos de enlace propietarios proporcionados por el proveedor del SDK. Los proveedores admitidos varían según la implementación, por lo que debe consultar la guía de integración del producto específico que evalúe.
¿En qué se diferencia un agente de documentos con IA de las herramientas de RPA u OCR?
La RPA (Automatización Robótica de Procesos) automatiza principalmente flujos de trabajo e interacciones predefinidos, mientras que los agentes de IA pueden interpretar instrucciones de mayor nivel y seleccionar dinámicamente herramientas o acciones en función del contexto. Los sistemas de RPA modernos a veces incorporan OCR, PLN (procesamiento del lenguaje natural) o incluso modelos LLM, pero su paradigma central sigue siendo la automatización de procesos basada en reglas.
El OCR (Reconocimiento Óptico de Caracteres) convierte principalmente contenido visual de documentos en texto legible por máquina, mientras que un agente de documentos con IA puede usar el OCR como un componente dentro de un flujo de trabajo más amplio que incluye interpretación y operaciones con documentos. En la práctica, los agentes invocan con frecuencia el OCR de forma interna al tratar con documentos escaneados, pero van mucho más allá de la extracción de texto para generar, formatear y estructurar nuevos archivos a partir de lo que encuentran.
¿Es adecuado el procesamiento de documentos con IA para flujos de trabajo empresariales?
El procesamiento de documentos con IA es cada vez más adecuado para el uso empresarial, pero la preparación depende de varios factores prácticos. Por el lado positivo, los agentes de documentos modernos proporcionan una manipulación determinista de archivos que garantiza que los resultados coincidan con las plantillas corporativas y las pautas de marca. Se ejecutan dentro de las arquitecturas de aplicaciones existentes sin requerir que los usuarios aprendan nuevas interfaces.
Las consideraciones clave antes del despliegue incluyen la privacidad de los datos (cómo y dónde se transmite el texto del documento), la confiabilidad del modelo (manejo de casos límite donde las instrucciones son ambiguas), procesos de revisión con intervención humana para documentos sensibles y la capacidad de configurar comportamientos alternativos cuando falla una llamada al modelo. Las empresas que realizan pruebas piloto de un agente primero para tareas de bajo riesgo (memorandos internos, borradores de resúmenes, plantillas no conformes) suelen alcanzar el despliegue en producción más rápido que aquellas que intentan una implementación a escala empresarial desde el primer día.
¿Cuál es la diferencia entre el procesamiento de documentos con IA y el Procesamiento Inteligente de Documentos (IDP)?
El Procesamiento Inteligente de Documentos (IDP) se refiere típicamente a sistemas orientados a empresas que se especializan en la fase de captura y extracción de los flujos de trabajo de documentos: ingesta de documentos, clasificación por tipo, aplicación de OCR, extracción de campos estructurados, validación contra reglas de negocio y enrutamiento a sistemas posteriores. El procesamiento de documentos con IA es un término general más amplio que abarca el IDP, pero que también incluye la generación, transformación, flujos de trabajo multiformato y automatización interactiva basada en agentes.
Una forma útil de pensar en la distinción es que el IDP enfatiza tradicionalmente la ingesta, clasificación, extracción, validación y orquestación del flujo de trabajo posterior de los documentos, mientras que el procesamiento de documentos con IA se utiliza a menudo de manera más amplia para incluir análisis, generación, transformación y razonamiento basado en agentes. Las dos categorías se superponen cada vez más a medida que los proveedores incorporan capacidades generativas en las plataformas de IDP y los agentes adoptan flujos de extracción estructurada.
¿Listo para probar el procesamiento de documentos con IA?
El procesamiento de documentos impulsado por IA abarca una amplia gama de casos de uso, desde la generación simple de informes hasta complejos flujos de trabajo multiformato que combinan análisis de datos, resumen y resultados estructurados. Si está evaluando opciones para integrar agentes de IA en una aplicación .NET, comience con el tutorial oficial de Primeros Pasos y luego explore guías sobre temas específicos como la generación de contratos y la automatización de presentaciones.
Lecturas adicionales
- Descripción general del producto Spire.Agent.Office — SDK de agente de IA para el procesamiento de documentos Word, Excel, PowerPoint y PDF
- Tutorial de generación de contratos en lote — generación de contratos a partir de plantillas y fuentes de datos
- Generar PPT a partir de documentos — convertir Word, PDF y otros formatos en presentaciones
- Automatizar el análisis de calificaciones de estudiantes en Excel — análisis de datos y clasificación con agentes de IA
- Generar varias plantillas de Word — creación de plantillas que el agente puede rellenar
KI-Agent für die Dokumentenverarbeitung: Was er ist und wie er funktioniert
Inhaltsverzeichnis
Ein KI-Agent für die Dokumentenverarbeitung ist ein Softwaresystem, das Modelle und Werkzeuge der künstlichen Intelligenz nutzt, um Anweisungen in natürlicher Sprache zu verstehen und Aufgaben wie das Erstellen, Bearbeiten, Konvertieren, Analysieren oder Extrahieren von Inhalten aus Dokumenten auszuführen – ohne Zeile für Zeile Code schreiben zu müssen. Ein KI-Agent kann mit Word-, Excel-, PowerPoint- und PDF-Dateien arbeiten, indem er die Absicht des Benutzers interpretiert, geeignete Dokumentenverarbeitungsfunktionen auswählt und Ausgaben erzeugt, die die erforderliche Dateistruktur und Formatierung beibehalten.
KI-Agenten sind ein Ansatz zur Automatisierung dokumentenbezogener Arbeiten. Weitere Ansätze umfassen traditionelle programmgesteuerte APIs, reine Sprachmodell-Endpunkte in Kombination mit benutzerdefiniertem Code sowie Workflow-Engines, die vordefinierte Schritte automatisieren. Dieser Artikel erklärt, was KI-gestützte Dokumentenverarbeitung ist, wie sie sich von früheren Methoden unterscheidet und wann ihr Einsatz zusammen mit anderen Technologien sinnvoll ist.
1. Was ist KI-Dokumentenverarbeitung?
Dokumentenverarbeitung – das Lesen, Erstellen, Bearbeiten, Konvertieren, Extrahieren von Informationen aus oder Analysieren von digitalen Dokumenten – gehört seit jeher zu den häufigsten Softwareaufgaben in allen Branchen. E-Mail-Rechnungen kommen als PDF an. Verkaufsberichte befinden sich in Excel-Arbeitsmappen mit uneinheitlichem Layout. Mitarbeiterhandbücher liegen in Word-Vorlagen vor, die sich jedes Jahr ändern. Rechtliche Vereinbarungen gehen als gescannte PDFs von externen Parteien ein. Seit Jahrzehnten schreiben Unternehmen Code, um diese Vielfalt zu bewältigen.
Traditionelle Ansätze zur Dokumentenverarbeitung folgen einem gemeinsamen Muster: Jemand definiert anhand expliziter Regeln, was mit welchen Dokumenten geschehen soll. Ein Skript zum Ausfüllen von Vorlagen liest eine CSV-Datei und befüllt eine Word-.docx-Datei, indem es vordefinierte Platzhalter ersetzt. Ein Python-Skript iteriert über Excel-Spalten und ruft Layout-Funktionen auf, um einen gestalteten Bericht zu erstellen. Eine C#-Routine öffnet ein PDF, sucht nach bestimmten Feldern anhand von Positionen oder Regex-Mustern und schreibt die Ergebnisse zurück in eine Datenbank. Diese Methoden funktionieren gut für stabile, genau spezifizierte Workflows – erfordern jedoch programmgesteuerte Anweisungen für jede einzelne Variation. Wenn sich die Vorlage ändert, das Eingabeformat verschiebt oder neue Dokumenttypen in die Pipeline gelangen, muss der Code umgeschrieben, getestet und neu bereitgestellt werden.
Die KI-gestützte Dokumentenverarbeitung erweitert dieselben Operationen um eine Ebene des Sprachverständnisses. Anstatt der Software genau zu sagen, welcher Platzhalter ersetzt oder welcher Zellenbereich gelesen werden soll, beschreiben Sie das gewünschte Ergebnis in natürlicher Sprache: "Fasse diesen Vertrag zusammen und extrahiere die Zahlungsbedingungen" oder "Vergleiche die Verkaufstabelle des letzten Monats mit der dieses Monats und speichere die Analyse als formatierten Bericht." Das System nutzt ein KI-Modell, um diese Anweisung zu interpretieren, bestimmt die erforderlichen Dokumentenoperationen, führt sie an echten Dateiformaten aus und gibt eine ordnungsgemäß strukturierte Ausgabe zurück.
In der Praxis ersetzt die KI-Dokumentenverarbeitung traditionelle Ansätze nicht – sie ergänzt sie. Einfache, vorhersehbare Aufgaben lassen sich nach wie vor besser durch regelbasierte Skripte erledigen, da sie schneller und vollständig deterministisch sind. Wenn Dokumente jedoch in ihrer Struktur variieren, Eingaben in unvorhersehbaren Formaten eintreffen oder sich die an ein Dokument gestellte Frage häufig ändert, spart ein KI-gestützter Ansatz Entwicklungsaufwand und passt sich natürlicher an sich ändernde Anforderungen an.
2. Was ist ein KI-Agent für die Dokumentenverarbeitung?
Ein KI-Agent für die Dokumentenverarbeitung ist ein System, das das logische Denken von Sprachmodellen mit dokumentenorientierten Werkzeugen kombiniert. Dadurch kann eine Person eine Aufgabe in natürlicher Sprache beschreiben und erhält als Ergebnis ein echtes, korrekt formatiertes Dokument.
Das entscheidende Merkmal eines Agenten – in diesem Kontext – ist, dass er zwei Fähigkeiten verbindet, die den meisten einzelnen Komponenten für sich genommen fehlen:
- Verständnis. Das System interpretiert offene, hochrangige Anweisungen dazu, was mit einem Dokument geschehen soll. "Überprüfe diese Vereinbarung auf risikoreiche Klauseln" oder "Verwandle diese Quartalszahlen in ein Präsentations-Foliendeck" sind keine strukturierten Abfragen; sie erfordern semantisches Verständnis.
- Aktion. Nach dem Verstehen der Absicht wählt das System konkrete Dokumentenoperationen aus und führt diese aus – Datei lesen, Text oder Tabellen extrahieren, Inhalte einfügen, Layout ändern, neue Datei generieren – in Formaten wie
.docx,.xlsx,.pptxoder.pdf.
Verschiedene Anbieter und Forschungsgruppen verwenden leicht unterschiedliche Begriffe für diese Konzepte. Einige nennen diese Systeme "KI-Assistenten", andere sprechen von "agentischen Workflows", "autonomen Dokumenten-Pipelines" oder "Document Intelligence-Plattformen". Die Unterschiede sind subtil und oft marketingbedingt. Für die Bewertung zählt nicht die Bezeichnung, sondern die Fähigkeit: Kann das System sowohl unstrukturierte Anweisungen interpretieren als auch Dokumentdateien über echte APIs manipulieren?
In der Praxis deckt der Begriff "Dokumenten-Agent" verschiedene Arten von Systemen ab – darunter extraktionsfokussierte Agenten, die Dokumente erfassen, klassifizieren und weiterleiten, sowie Agenten, die Anweisungen in natürlicher Sprache direkt interpretieren und Dokumente manipulieren oder generieren. In diesem Artikel bezieht sich der Begriff speziell auf Agenten, die das logische Denken von Sprachmodellen mit APIs zur Dokumentenverarbeitung kombinieren. Nachfolgend finden Sie einen funktionalen Vergleich, der einen KI-Dokumenten-Agenten von verwandten Technologien unterscheidet. Diese Kategorien überschneiden sich überschneidend stark – viele Produkte kombinieren mehrere davon –, aber das Verständnis der jeweiligen Stärken hilft zu klären, was ein Agent tatsächlich hinzufügt.
| Ansatz | Hauptstärke | Umgang mit Anweisungen | Typische Einschränkung |
|---|---|---|---|
| Nur LLM-Endpunkt | Tiefes Sprachverständnis | Interpretiert natürliche Sprache sehr effektiv | Bietet von sich aus keine deterministische, formatbewusste Kontrolle über Office- und PDF-Dateistrukturen; erzeugt rohen Text oder HTML, sofern nicht mit Dokumentenverarbeitungstools kombiniert |
| Agent für natürliche Sprache | Verbindet Verständnis mit Werkzeugausführung | Nimmt hochrangige Anfragen entgegen und verkettet passende Werkzeuge | Hängt von der Qualität der verfügbaren Werkzeuge und der Orchestrierungslogik ab |
| Traditionelles SDK / API | Deterministische, präzise Dateimanipulation | Erfordert explizite programmatische Befehle; kein Sprachverständnis | Starr – jede Änderung der Vorlage oder des Eingabeformats erfordert Code-Updates |
| RPA (Robotic Process Automation) | Automatisiert Interaktionen auf UI-Ebene über Anwendungen hinweg | Folgt skriptbasierten Workflows; einige moderne RPA-Lösungen enthalten Vision und OCR | Tut sich schwer mit mehrdeutigen Anweisungen, die eine semantische Interpretation erfordern – RPA (Robotic Process Automation) basiert auf Softwareroboten, die Daten anwendungsübergreifend nach vordefinierten Regeln verarbeiten, während Agenten offene Anfragen in natürlicher Sprache interpretieren |
| OCR (Optische Zeichenerkennung) | Konvertiert Bilder / Scans in maschinenlesbaren Text | Arbeitet auf visuellen Inhalten; extrahiert Zeichen und grundlegendes Layout | Führt keine Dokumentengenerierung, -analyse oder mehrstufige Workflows aus |
Diese Fähigkeiten treten in Produktionssystemen häufig gemeinsam auf. Eine Unternehmens-Dokumentenpipeline könnte OCR nutzen, um gescannte Rechnungen zu digitalisieren, den extrahierten Text zur semantischen Klassifizierung an ein LLM übergeben, das Ergebnis zur Dateneingabe in einen RPA-Workflow leiten und schließlich über eine Dokumenten-API einen Bericht im Corporate Design erstellen. Ein KI-Dokumenten-Agent steht im Zentrum einer solchen Pipeline als die Komponente, die die menschliche Anfrage versteht und die erforderlichen Werkzeuge zur Erfüllung koordiniert.
Wenn Menschen nach "Was ist KI-Dokumentenverarbeitung" oder "Wie funktionieren KI-Dokumenten-Agenten" suchen, versuchen sie meist zu verstehen, ob sich der Kauf oder Aufbau eines solchen Systems vom manuellen Kombinieren von Standardwerkzeugen unterscheidet. Die kurze Antwort: Ja – wenn Dokumentenvielfalt, Anweisungsvariabilität und Formatierungstreue wichtig genug sind, um eine dedizierte Orchestrierungsschicht zwischen Sprachverständnis und Dateimanipulation zu rechtfertigen.
3. Wie funktioniert ein KI-Dokumenten-Agent?
Auf hoher Ebene folgt ein KI-Dokumenten-Agent fünf konzeptionellen Phasen:
Benutzer gibt Anweisung in natürlicher Sprache ein
     ↓
KI-Modell interpretiert Absicht und identifiziert erforderliche Operationen
     ↓
Agent wählt geeignete Dokumentenverarbeitungstools oder -APIs aus
     ↓
Dokumenten-APIs führen Operationen auf Dateiebene aus (lesen, ändern, generieren)
     ↓
Ausgabedokument wird mittels deterministischer Dokumentenverarbeitungsoperationen generiert
Jede Phase bringt Entscheidungen mit sich, die bestimmen, wie genau, zuverlässig und gut formatiert die finale Ausgabe sein wird. Das Verständnis dieser Entscheidungen macht deutlich, warum ein reines LLM allein nicht zuverlässig echte Word- oder Excel-Dateien erstellen kann – und warum ein traditionelles SDK allein eine vage oder offene Anfrage nicht verstehen kann.
Architektur: Von der Absicht zur Datei
Eine typische Implementierung verkettet fünf Schichten und leitet das Dokument von der Absicht bis zur Ausgabe durch jede Stufe:
Beispiel: Von einer Anfrage in natürlicher Sprache zum fertigen Dokument
Betrachten wir ein Szenario, dem viele Finanzteams jeden Monat begegnen: Ein Manager sendet einen Ordner mit regionalen Verkaufs-Arbeitsmappen und bittet um einen konsolidierten Zusammenfassungsbericht im Word-Format.
Die Anfrage des Benutzers in natürlicher Sprache könnte etwa so lauten:
"Lies alle Q3-Verkaufsdateien in diesem Ordner, vergleiche jede Region mit dem Vorquartal, fasse die wichtigsten Trends und Ausreißer zusammen und speichere die Ergebnisse als formatiertes Word-Dokument."
Hinter den Kulissen zerlegt der Agent diesen einzelnen Satz in eine Sequenz von Operationen:
- Suchen und Öffnen aller
.xlsx-Dateien im angegebenen Verzeichnis. - Lesen von Zusammenfassungszeilen oder wesentlichen Blättern aus jeder Arbeitsmappe.
- Berechnen der Veränderungen im Vergleich zur Vorperiode.
- Identifizieren der Regionen mit der besten und der schwächsten Performance.
- Verfassen einer textlichen Zusammenfassung, die die Trends beschreibt.
- Erstellen eines neuen Word-Dokuments, Einfügen der Zusammenfassung, Hinzufügen von Tabellen mit regionalen Vergleichen und Anwenden einer Formatierung, die den Unternehmensvorlagen entspricht.
Das fertige Ergebnis – der konsolidierte Word-Bericht mit der textlichen Zusammenfassung und den regionalen Vergleichstabellen:
Ohne einen Agenten müsste ein Entwickler normalerweise jeden dieser sechs Schritte selbst bauen und orchestrieren – Code für die Dateisuche schreiben, Daten lesen, Änderungen berechnen, ein LLM zur Textgenerierung aufrufen, dessen Antwort parsen und sie in ein strukturiertes Dokumentenlayout überführen. Mit einem Agenten können die Schritte 4–6 in einer einzigen Anweisung ausgedrückt werden, während die Schritte 1–3 weiterhin dieselben Dateiparsing-Fähigkeiten nutzen, die Ihre Anwendung bereits besitzt.
Genau bei dieser Art von formatübergreifenden Workflows – wo das Lesen von Daten aus einem Dateityp und das Erzeugen der Ausgabe in einem anderen sowohl semantisches Denken als auch präzise Dateimanipulation erfordert – bieten KI-Agenten den größten Mehrwert. Werkzeuge wie Spire.Agent.Office bündeln die Orchestrierungsschicht zusammen mit deterministischen Dokumenten-APIs, sodass Entwickler eine Schnittstelle für natürliche Sprache erhalten, ohne die Kontrolle über Formatierung, Layout oder Ausgabetreue zu verlieren.
4. Was können KI-Agenten mit Dokumenten tun?
Abhängig von den Fähigkeiten der zugrunde liegenden Dokumentenverarbeitungstools können KI-Agenten ein breites Spektrum an Dokumentenoperationen abdecken, die Entwickler traditionell mit explizitem Code implementieren – nur dass sie hier durch Intention statt durch Syntax ausgedrückt werden. Die folgende Tabelle zeigt repräsentative Funktionskategorien, die viele Implementierungen unterstützen, wenn die zugrunde liegenden Tools diese zur Verfügung stellen.
| Funktion | Word (.docx/.doc) | Excel (.xlsx/.xls) | PowerPoint (.pptx/.ppt) | PDF (.pdf) |
|---|---|---|---|---|
| Erstellen aus dem Nichts oder aus Daten | Ja — Absätze, Tabellen, Überschriften, Formatvorlagen | Ja — Tabellenblätter, Zellen, Formeln, Diagramme | Ja — Folien, Layouts, Designs | Ja — Abschnitte, Textblöcke, Anmerkungen |
| Bearbeiten bestehender Dokumente | Ja — Inhalte einfügen, ersetzen, neu anordnen | Ja — Zellen aktualisieren, Zeilen/Spalten umorganisieren | Ja — Folieninhalte ändern, neu sortieren | Ja — Seiten hinzufügen/entfernen, anmerken, schwärzen |
| Konvertieren zwischen Formaten | Ja ↔ PDF, HTML, XPS, Markdown | Ja ↔ CSV, PDF, HTML | Ja ↔ PDF | Ja ↔ DOCX, HTML, Bildformate |
| Analysieren / Zusammenfassen von Inhalten | Ja — Klauseln extrahieren, Struktur identifizieren | Ja — Datensätze vergleichen, Statistiken berechnen | Ja — Folieninhalte prüfen | Ja — Seiten klassifizieren, Schlüsselinformationen extrahieren |
| Daten extrahieren (strukturiert) | Ja — Text aus Absätzen und Tabellen auslesen | Ja — Zellwerte, Bereiche, benannte Bereiche lesen | Eingeschränkt — Folientext und Notizen | Ja — Formulare, Tabellen, eingebetteten Text parsen |
Die tatsächlichen Fähigkeiten hängen von den verwendeten Dokumentenverarbeitungsbibliotheken und der spezifischen Agenten-Implementierung ab.
Typische Anwendungsfälle, die unter diese Fähigkeiten fallen, sind unter anderem:
- Vertrags- und Vereinbarungsprüfung: Eingehende PDFs oder Word-Dateien lesen, ungewöhnliche Klauseln oder fehlende Bestimmungen kennzeichnen und ein Zusammenfassungsdokument in Markdown oder Word erstellen.
- Berichtskonsolidierung: Unterschiedliche Tabellenkalkulationen aus mehreren Regionen zusammenführen, Anomalien erkennen und einen küchenfertigen Managementbericht in Word oder PDF generieren.
- Präsentationserstellung: Ein Briefing-Dokument oder einen Datensatz in eine Präsentationsvorlage einspeisen und ein fertiges Foliendeck mit Diagrammen und Sprechpunkten erzeugen.
- Rechnungs- und Formularverarbeitung: Gescannte oder digitale Rechnungen öffnen, Einzelpositionen und Summen extrahieren, mit Bestellungen abgleichen und nachgelagerte Systeme befüllen.
- Richtlinien- und Handbuchpflege: Mitarbeiterdokumente aktualisieren, indem Namen, Datumsangaben und abteilungsspezifische Formulierungen über Dutzende von Vorlagen hinweg ersetzt werden.
Für Teams, die bereits Dokumenten-Workflows entwickeln, ersetzen diese Fähigkeiten nicht ihre bestehende Logik – sie erweitern sie. Ein Agent übernimmt die Teile eines Workflows, die von menschlicher Kommunikation abhängen (verstehen, was zu tun ist), während die zugrunde liegenden Dokumenten-APIs die Teile übernehmen, die Präzision erfordern (die richtige Datei mit dem richtigen Layout erstellen). Siehe die offiziellen Tutorials zu Stapel-Vertragserstellung und Erstellung von Präsentationen aus Dokumenten für Beispiele, wie diese Operationen in reale Anwendungen passen.
5. Ansätze zur Dokumentenautomatisierung
Nicht jedes Unternehmen greift bei der Automatisierung von Dokumenten-Workflows sofort zu einem KI-Agenten. Die Wahl der Technologie hängt davon ab, welche Arten von Dokumenten Sie verarbeiten, wie häufig sich diese ändern und wie viel Entwicklungsaufwand Ihnen zur Verfügung steht. Nachfolgend finden Sie einen Vergleich der primären Ansätze, denen Sie in der Praxis begegnen werden.
| Ansatz | Stärken | Einschränkungen | Am besten geeignet für |
|---|---|---|---|
| Agent für natürliche Sprache | Benutzerfreundliche Interaktion; minimaler Boilerplate-Code; passt sich an unterschiedliche Eingabeformate an | Erfordert die Integration mit einer Dokumentenverarbeitungsschicht; hängt bei komplexen Anweisungen von der Modellgenauigkeit ab | Teams, die Dokumente mit uneinheitlichen Strukturen erhalten und schnelle Iterationen ohne Neukompilierung wünschen |
| LLM-API + benutzerdefinierter Code | Hochgradig anpassbar; Auswahl der besten Modelle für jede Aufgabe; volle Kontrolle über die Orchestrierung | Erheblicher Entwicklungsaufwand für Datei-I/O, Fehlerbehandlung, Formatierung und Validierung | Organisationen, die bereits einen LLM-Stack betreiben, maximale Flexibilität suchen und über freie Entwicklungskapazitäten verfügen |
| Traditionelles Dokumenten-SDK / API | Vollständig deterministisch; präzise Kontrolle über Layout, Styling und Ausgabekonsistenz; keine Modellabhängigkeit zur Laufzeit | Erfordert explizite programmatische Anweisungen für jedes Szenario; starr, wenn sich Vorlagen oder Eingabestrukturen häufig ändern | |
| RPA / Workflow-Engine | Gut geeignet zur Automatisierung wiederholbarer, regelbasierter Prozesse über Systeme hinweg; nutzt bestehende Infrastruktur | Weniger flexibel bei mehrdeutigen oder offenen Aufgaben; stößt an Grenzen, wenn Dokumentenformate stark variieren | Back-Office-Prozesse mit hohem Volumen und geringer Varianz, wie z. B. die Rechnungsverbuchung in ERP-Systemen |
Keiner dieser Ansätze ist universell überlegen. Eine ausgereifte Strategie zur Dokumentenautomatisierung kombiniert häufig mehrere Ansätze. Beispielsweise könnte eine Organisation traditionellen SDK-Code zur Generierung fester Compliance-Berichte verwenden und einen KI-Agenten für Ad-hoc-Analyseaufgaben reservieren, die von Woche zu Woche variieren.
Eine Lösung wie Spire.Agent.Office zeichnet sich dadurch aus, dass sie ein einzelnes SDK bietet, das sowohl die Schnittstelle für natürliche Sprache als auch die deterministischen Dokumentenverarbeitungsfunktionen bereitstellt, die erforderlich sind, um Anweisungen in echte Dateien umzusetzen. Anstatt separate LLM-Dienste, benutzerdefinierte Formatierungsbibliotheken und Orchestrierungslogik miteinander zu verdrahten, fügen Entwickler ihren bestehenden Dokumentenobjekten einen KI-Prozessor hinzu – ein einziger AI(options)-Aufruf auf einer beliebigen Document-, Workbook-, Presentation- oder PdfDocument-Instanz – und erteilen dann Anweisungen in einfacher Sprache, die formatierte Ausgaben zurückgeben, während Layouts, Schriftarten, Tabellen und Stile erhalten bleiben.
Wenn Sie bereits eine traditionelle Dokumentenbibliothek für deterministische Operationen verwenden, bedeutet das Hinzufügen einer Agentenschicht in der Regel, dass dasselbe Document- oder Spreadsheet-Objekt mit einem KI-Prozessor umschlossen wird und die felderweise Ersetzungslogik durch deklarative Anweisungen ersetzt wird. Die Lernkurve konzentriert sich dann auf das Schreiben effektiver Prompts statt auf das Erlernen eines neuen Dateiformats.
6. KI-Dokumentenverarbeitung vs. Intelligent Document Processing (IDP)
Wenn Sie sich professionell mit Dokumentenautomatisierung beschäftigen, werden Sie auf mehrere sich überschneidende Begriffe stoßen: KI-Dokumentenverarbeitung, Intelligent Document Processing (oder IDP), Document Intelligence, KI-Dokumentenautomatisierung und KI-Dokumenten-Agent. Das Verständnis ihrer Beziehung hilft dabei, genau das einzugrenzen, wonach Sie suchen – und vermeidet Verwirrung durch Anbieterterminologie, die je nach Markt variiert.
Im allgemeinen Sprachgebrauch gilt:
- KI-Dokumentenverarbeitung wird oft als breiter Oberbegriff verwendet – er bezieht sich auf jeden Ansatz, der Techniken der künstlichen Intelligenz anwendet, um Dokumente zu verstehen, zu erstellen, zu bearbeiten, zu konvertieren oder zu analysieren. Wie breit oder eng dieser Begriff definiert wird, hängt jedoch davon ab, wen Sie fragen.
- Intelligent Document Processing (IDP) stammt aus dem Bereich des Unternehmens-Dokumentenmanagements mit Schwerpunkt auf der Erfassungs- und Extraktionsphase: Scannen oder Erfassen von Dokumenten, Klassifizieren nach Typ (Rechnung, Quittung, Vertrag), Anwenden von OCR, Extrahieren von Feldern, Validieren gegen Geschäftsregeln und Weiterleiten an nachgelagerte Systeme. Im Laufe der Zeit haben sich die Grenzen dessen, was als IDP gilt, verschoben, da Anbieter generative KI in ihre Produkte integrieren.
- Document Intelligence wird manchmal synonym mit IDP verwendet, legt jedoch oft einen stärkeren Schwerpunkt auf Extraktion und Verständnis im Vergleich zur Generierung. Anbieter im Legal-Tech- und Finanzdienstleistungssektor bevorzugen diese Terminologie.
- KI-Dokumentenautomatisierung hebt die Ausführungsseite hervor – die Nutzung von KI zum Auslösen von Workflows, die Dokumente basierend auf Triggern oder Benutzeranfragen erstellen, senden oder ändern.
- KI-Dokumenten-Agent konzentriert sich auf den Orchestrierungsaspekt: ein System, das Absichten in natürlicher Sprache empfängt, die notwendigen Operationen plant und an die Werkzeuge delegiert, die zur Erledigung der Aufgabe erforderlich sind.
Diese Definitionen sind eher konventionell als formal. Sie werden feststellen, dass verschiedene Anbieter die Grenzen an unterschiedlichen Punkten ziehen und viele Produkte mehrere Kategorien gleichzeitig abdecken. Die wichtigste Erkenntnis ist nicht, welches Label Ihr gewähltes Werkzeug trägt, sondern ob das Werkzeug das tun kann, was Sie tatsächlich benötigen: eine Anfrage verstehen, die richtigen Operationen auswählen, sie an echten Dateien ausführen und eine strukturierte Ausgabe zurückgeben.
Beispielsweise könnte ein System mit der Bezeichnung "Document Intelligence-Plattform" hervorragend in der Klassifizierung und Extraktion sein, aber keine starken Generierungsfunktionen bieten. Ein "KI-Dokumenten-Agent" kann je nach seinen Werkzeugen und dem vorgesehenen Workflow neben Extraktion, Klassifizierung und Routing auch die Generierung unterstützen. In der Praxis kombinieren die besten Lösungen Extraktion, logisches Denken und Generierung unter einem Dach – weshalb sich Frameworks wie Spire.Agent.Office als End-to-End-Agenten und nicht als Punktlösungen für eine einzelne Phase der Pipeline positionieren.
7. Warum KI-Agenten für die Dokumentenverarbeitung nützlich sind
Der Hauptgrund, warum KI-Agenten für die Dokumentenarbeit wichtig sind, ist einfach: Die meisten sinnvollen Dokumentenaufgaben erfordern drei Dinge gleichzeitig.
Erstens muss das System verstehen, was der Benutzer will. "Erschaffe eine Quartalszusammenfassung aus diesen Berichten" ist keine strukturierte Abfrage – sie lässt offen, welche Dateien gelesen werden sollen, welche Metriken extrahiert werden müssen, wie die Ausgabe zu strukturieren ist und welcher Tonfall verwendet werden soll. Ein Sprachmodell ist hervorragend darin, diese Mehrdeutigkeit aufzulösen.
Zweitens muss das System Aktionen an tatsächlichen Dateien ausführen. Das Generieren von kohärentem Text in einem Chat-Fenster unterscheidet sich völlig vom Erstellen einer .docx-Datei mit korrekten Absatzstilen, Seitenrändern, Tabellenrändern und eingebetteten Diagrammen. Ein Sprachmodell allein bietet keine deterministische, formatbewusste Kontrolle über Office-Dateistrukturen.
Drittens muss das System sicherstellen, dass die Ausgabe Struktur und Formatierung beibehält. Geschäftsdokumente unterliegen Einschränkungen, die über lesbaren Text hinausgehen: Klauselnummerierung, Hierarchien von Abschnitten, Kopf- und Fußzeilen, Seriendruckfelder, Regeln für bedingte Formatierungen. Dies sind strukturelle Eigenschaften, die zum Dateiformat selbst gehören und nicht zum reinen Text.
Ein traditionelles SDK ist darauf ausgelegt, Punkt #2 und #3 deterministisch zu lösen, bietet aber nicht das in Punkt #1 beschriebene Absichtsverständnis auf Sprachebene. Eine reine LLM-API kann Punkt #1 effektiv abdecken, bietet aber von sich aus keine deterministische Kontrolle über Punkt #2 und #3. Die Kombination aus beidem – das Platzieren eines Sprachmodells hinter einer deterministischen Dokumentenverarbeitungsschicht – macht einen Agenten für reale Dokumentenarbeiten so nützlich.
Organisationen, die hohe Dokumentenvolumen verarbeiten, stehen oft vor demselben grundlegenden Dilemma: Dokumente erfordern sowohl semantisches Verständnis (um herauszufinden, was zu tun ist) als auch deterministische Dateimanipulation (um korrekt formatierte Ausgaben zu erzeugen). KI-Agenten lösen dieses Dilemma, indem sie beide Fähigkeiten unter einer Schnittstelle vereinen.
Branchenanalysten erwarten, dass diese Kombination eher zur Norm als zur Ausnahme wird. Gartner prognostiziert, dass bis 2028 33 % der Unternehmenssoftwareanwendungen agentische KI enthalten werden (gegenüber weniger als 1 % im Jahr 2024) und dass 15 % der täglichen Arbeitsentscheidungen autonom getroffen werden – ein Wandel mit direkten Auswirkungen auf dokumentenintensive Geschäftsprozesse.
8. Häufig gestellte Fragen (FAQ)
Was ist der Unterschied zwischen einem KI-Dokumenten-Agenten und einem normalen LLM?
Ein LLM (Large Language Model) ist ein neuronales Netzwerk, das darauf trainiert ist, Text zu generieren und zu verstehen. Es arbeitet auf Sequenzen von Token. Für sich genommen bietet es keine deterministische, formatbewusste Kontrolle über Office- oder PDF-Dateistrukturen – obwohl LLM-gestützte Systeme über separate Tools und APIs auf diese Formate zugreifen können. Ein KI-Dokumenten-Agent setzt auf einem LLM (oder einem ähnlichen Modell) auf und verbindet es mit Dokumentenverarbeitungstools, die .docx-, .xlsx-, .pptx- und .pdf-Dateien öffnen, Operationen an ihnen ausführen und ordnungsgemäß formatierte Ausgaben erzeugen können. Das LLM liefert das Verständnis; der Agent baut die Brücke zu den realen Dateien.
Muss ich Dokumente in die Cloud senden, um einen KI-Dokumenten-Agenten zu nutzen?
Nicht notwendigerweise. Viele KI-Dokumenten-Agenten können vollständig innerhalb Ihrer eigenen Infrastruktur ausgeführt werden – das SDK oder der Dienst läuft On-Premise oder in einer privaten Cloud, und die Dokumente verbleiben in Ihrer Umgebung. Zur Inhaltsanalyse werden die relevanten Textschichten an das zugrunde liegende Modell übermittelt, das sich je nach Konfiguration auf einer gehosteten API oder lokal befinden kann. Wenn Datenschutz ein Anliegen ist, suchen Sie nach Lösungen, die eine lokale Modellbereitstellung unterstützen oder es Ihnen ermöglichen, zu konfigurieren, woher Modellaufrufe stammen.
Welche Dokumentenformate unterstützen KI-Agenten?
KI-Dokumenten-Agenten können eine breite Palette von Formaten unterstützen, die genaue Auswahl variiert jedoch erheblich je nach Implementierung. Einige Agenten konzentrieren sich hauptsächlich auf PDF- und bildbasierte OCR-Workflows, während andere vollständige Microsoft Office-Dateiformate wie Word (.docx, .doc), Excel (.xlsx, .xls) und PowerPoint (.pptx, .ppt) verarbeiten. Viele unterstützen auch Zwischenformate wie HTML, Markdown, XPS, CSV und gängige Bildtypen zu Konvertierungszwecken. Prüfen Sie die Dokumentation auf produktspezifische Einschränkungen bezüglich verschlüsselter Dateien, älterer Binärformate oder spezialisierter Vorlagen.
Kann ich mein eigenes KI-Modell mit einem Dokumenten-Agenten-SDK verwenden?
Einige Dokumenten-Agenten-SDKs unterstützen eine flexible Modellintegration, sodass Entwickler den vom Agenten verwendeten Anbieter oder Endpunkt konfigurieren können. Sie können oft zwischen gehosteten Diensten wie OpenAI oder Azure OpenAI, Open-Source-Modellen, die in Ihrer Umgebung laufen, oder proprietären Endpunkten des SDK-Anbieters wählen. Die unterstützten Anbieter variieren je nach Implementierung, konsultieren Sie daher den Integrationsleitfaden für das spezifische Produkt, das Sie evaluieren.
Wie unterscheidet sich ein KI-Dokumenten-Agent von RPA- oder OCR-Tools?
RPA (Robotic Process Automation) automatisiert in erster Linie vordefinierte Workflows und Interaktionen, während KI-Agenten höherrangige Anweisungen interpretieren und Werkzeuge oder Aktionen dynamisch basierend auf dem Kontext auswählen können. Moderne RPA-Systeme enthalten manchmal OCR, NLP oder sogar eigene LLMs, ihr Kernparadigma bleibt jedoch die regelbasierte Prozessautomatisierung.
OCR (Optische Zeichenerkennung) wandelt visuelle Dokumenteninhalte hauptsächlich in maschinenlesbaren Text um, während ein KI-Dokumenten-Agent OCR als eine Komponente in einem umfassenderen Workflow nutzen kann, der Interpretation und Dokumentenoperationen umfasst. In der Praxis rufen Agenten bei gescannten Dokumenten intern häufig OCR auf, gehen aber weit über die Textfunktion hinaus, um aus den gefundenen Daten neue Dateien zu generieren, zu formatieren und zu strukturieren.
Ist KI-Dokumentenverarbeitung für Unternehmens-Workflows geeignet?
Die KI-Dokumentenverarbeitung eignet sich zunehmend für den Unternehmenseinsatz, die Einsatzbereitschaft hängt jedoch von mehreren praktischen Faktoren ab. Positiv ist, dass moderne Dokumenten-Agenten eine deterministische Dateimanipulation bieten, die sicherstellt, dass die Ausgabe den Unternehmensvorlagen und Markenrichtlinien entspricht. Sie laufen innerhalb bestehender Anwendungsstacks, ohne dass Benutzer neue Schnittstellen erlernen müssen.
Wichtige Überlegungen vor dem Einsatz sind der Datenschutz (wie und wohin Dokumententext übermittelt wird), die Modellverlässlichkeit (Umgang mit Grenzfällen bei mehrdeutigen Anweisungen), Human-in-the-Loop-Überprüfungsprozesse für sensible Dokumente und die Möglichkeit, Fallback-Verhalten zu konfigurieren, wenn ein Modellaufruf fehlschlägt. Unternehmen, die einen Agenten zuerst für Aufgaben mit geringem Risiko testen – interne Memos, Entwurfssammlungen, nicht-kritische Vorlagen –, erreichen Produktionsbereitstellungen in der Regel schneller als solche, die vom ersten Tag an einen unternehmensweiten Rollout versuchen.
Was ist der Unterschied zwischen KI-Dokumentenverarbeitung und Intelligent Document Processing (IDP)?
Intelligent Document Processing (IDP) bezieht sich in der Regel auf unternehmensfokussierte Systeme, die auf die Erfassungs- und Extraktionsphase von Dokumenten-Workflows spezialisiert sind: Erfassen von Dokumenten, Klassifizieren nach Typ, Anwenden von OCR, Extrahieren strukturierter Felder, Validieren gegen Geschäftsregeln und Weiterleiten an nachgelagerte Systeme. KI-Dokumentenverarbeitung ist ein breiterer Oberbegriff, der IDP umfasst, aber auch Generierung, Transformation, formatübergreifende Workflows und interaktive agentenbasierte Automatisierung beinhaltet.
Eine nützliche Denkweise zur Unterscheidung ist: IDP betont traditionell die Dokumentenerfassung, -klassifizierung, -extraktion, -validierung und die nachgelagerte Workflow-Orchestrierung, während die KI-Dokumentenverarbeitung oft breiter verwendet wird und Analyse, Generierung, Transformation und agentenbasierte Logik einschließt. Die beiden Kategorien überschneiden sich zunehmend, da Anbieter generative Funktionen in IDP-Plattformen integrieren und Agenten strukturierte Extraktions-Pipelines übernehmen.
Bereit, die KI-Dokumentenverarbeitung auszuprobieren?
Die KI-gestützte Dokumentenverarbeitung deckt ein breites Spektrum von Anwendungsfällen ab, von der einfachen Berichtserstellung bis hin zu komplexen, formatübergreifenden Workflows, die Datenanalyse, Zusammenfassung und strukturierte Ausgabe kombinieren. Wenn Sie Optionen für die Integration von KI-Agenten in eine .NET-Anwendung evaluieren, beginnen Sie mit dem offiziellen Erste Schritte-Tutorial und erkunden Sie anschließend themenspezifische Anleitungen zur Vertragserstellung und Präsentationsautomatisierung.
Weitere Informationen
- Spire.Agent.Office Produktübersicht — KI-Agenten-SDK für Word-, Excel-, PowerPoint- und PDF-Dokumentenverarbeitung
- Tutorial zur Stapel-Vertragserstellung — Erstellen von Verträgen aus Vorlagen und Datenquellen
- PPT aus Dokumenten generieren — Umwandeln von Word-, PDF- und anderen Formaten in Präsentationen
- Automatisierung der Analyse von Schülerleistungen in Excel — Datenanalyse und Ranking mit KI-Agenten
- Verschiedene Word-Vorlagen generieren — Erstellen von Vorlagen, die der Agent ausfüllen kann
AI-агент для обработки документов: что это такое и как это работает
AI-агент для обработки документов — это программная система, использующая модели искусственного интеллекта и инструменты для понимания инструкций на естественном языке и выполнения таких задач, как создание, редактирование, преобразование, анализ или извлечение контента из документов, без написания кода строка за строкой. AI-агент может работать с файлами Word, Excel, PowerPoint и PDF, интерпретируя намерения пользователя, выбирая соответствующие операции обработки документов и создавая выходные данные, сохраняющие требуемую структуру и форматирование файла.
AI-агенты — это один из подходов к автоматизации работы с документами. Другие подходы включают традиционные программные API, использование конечных точек языковых моделей с пользовательским кодом и системы управления рабочими процессами (workflow engines), автоматизирующие предопределенные шаги. В этой статье объясняется, что такое AI-обработка документов, чем она отличается от предыдущих методов и когда ее целесообразно использовать вместе с другими технологиями.
1. Что такое AI-обработка документов?
Обработка документов — чтение, создание, редактирование, преобразование, извлечение информации или анализ цифровых документов — всегда была одной из самых распространенных задач в программном обеспечении во всех отраслях. Счета приходят в виде PDF-файлов. Отчеты о продажах хранятся в книгах Excel с непоследовательной версткой. Руководства для сотрудников живут в шаблонах Word, которые меняются каждый год. Юридические соглашения приходят в виде отсканированных PDF-файлов от сторонних лиц. Десятилетиями организации писали код для управления этим разнообразием.
Традиционные подходы к обработке документов имеют общую закономерность: кто-то определяет, что должно произойти с конкретными документами, используя явные правила. Скрипт заполнения шаблона считывает CSV и заполняет Word .docx, заменяя предопределенные заполнители. Скрипт на Python перебирает столбцы Excel и вызывает функции компоновки для создания отформатированного отчета. Процедура на C# открывает PDF, ищет определенные поля по позиции или регулярному выражению и записывает результаты обратно в базу данных. Эти методы хорошо работают для стабильных, четко определенных рабочих процессов, но требуют программных инструкций для каждого изменения. Когда меняется шаблон, формат ввода или появляются новые типы документов, код нужно переписывать, тестировать и развертывать заново.
AI-обработка документов расширяет эти же операции, добавляя уровень понимания языка. Вместо того чтобы указывать программе, какой именно заполнитель заменить или какой диапазон ячеек прочитать, вы описываете желаемый результат на естественном языке: «Обобщи этот контракт и извлеки условия оплаты» или «Сравни таблицу продаж за прошлый месяц с текущим и сохрани анализ в виде отформатированного отчета». Система использует AI-модель для интерпретации этой инструкции, определяет, какие операции с документами необходимы, выполняет их с реальными форматами файлов и возвращает правильно структурированный результат.
На практике AI-обработка документов не заменяет традиционные подходы, а дополняет их. Простые, предсказуемые задачи по-прежнему лучше решаются с помощью скриптов на основе правил, поскольку они быстрее и полностью детерминированы. Но когда структура документов варьируется, входные данные приходят в непредсказуемых форматах или вопросы к документу часто меняются, подход с использованием AI экономит инженерные усилия и более естественно адаптируется к меняющимся требованиям.
2. Что такое AI-агент для обработки документов?
AI-агент для обработки документов — это система, объединяющая рассуждения языковой модели с инструментами для работы с документами, чтобы человек мог описать задачу в разговорной форме и получить на выходе готовый, правильно оформленный документ.
Определяющей характеристикой агента в этом контексте является то, что он объединяет две возможности, которыми большинство отдельных компонентов не обладают сами по себе:
- Понимание. Система интерпретирует открытые, высокоуровневые инструкции о том, что делать с документом. «Проверь это соглашение на наличие рискованных пунктов» или «Преврати эти квартальные цифры в презентацию» — это не структурированные запросы; они требуют семантического понимания.
- Действие. После понимания намерения система выбирает и выполняет конкретные операции с документами — чтение файла, извлечение текста или таблиц, вставка контента, изменение макета, создание нового файла — в форматах, таких как
.docx,.xlsx,.pptxили.pdf.
Разные поставщики и исследовательские группы используют немного разную терминологию. Некоторые называют эти системы «AI-ассистентами», другие — «агентными рабочими процессами», «автономными конвейерами документов» или «платформами интеллектуальной обработки документов». Различия часто носят маркетинговый характер. Для оценки важна не метка, а функциональность: может ли система одновременно интерпретировать неструктурированные инструкции и манипулировать файлами документов через реальные API?
На практике термин «агент документов» охватывает несколько типов систем, включая агенты, ориентированные на извлечение данных, которые принимают, классифицируют и маршрутизируют документы, а также агенты, которые напрямую интерпретируют инструкции на естественном языке и манипулируют документами или создают их. В этой статье термин относится именно к агентам, объединяющим рассуждения языковой модели с API обработки документов. Ниже приведено функциональное сравнение, которое отличает AI-агента документов от связанных технологий.
| Подход | Основная сильная сторона | Как обрабатывает инструкции | Типичное ограничение |
|---|---|---|---|
| Только LLM-эндпоинт | Глубокое понимание языка | Очень эффективно интерпретирует естественный язык | Сам по себе не обеспечивает детерминированный, учитывающий формат контроль над структурами файлов Office и PDF; создает «сырой» текст или HTML, если не объединен с инструментами обработки документов |
| Агент на естественном языке | Связывает понимание с выполнением инструментов | Принимает высокоуровневые запросы и связывает соответствующие инструменты | Зависит от качества доступных инструментов и логики оркестрации |
| Традиционный SDK / API | Детерминированная, точная манипуляция файлами | Требует явных программных команд; нет понимания языка | Жесткость — каждое изменение шаблона или формата ввода требует обновления кода |
| RPA (Robotic Process Automation) | Автоматизирует взаимодействия на уровне UI | Следует скриптовым рабочим процессам; некоторые современные RPA включают зрение и OCR | Трудности с неоднозначными инструкциями, требующими семантической интерпретации |
| OCR (оптическое распознавание символов) | Преобразует изображения/сканы в машиночитаемый текст | Работает с визуальным контентом; извлекает символы и базовую верстку | Не выполняет создание документов, анализ или многошаговые рабочие процессы |
Эти возможности часто встречаются вместе в производственных системах. Корпоративный конвейер документов может использовать OCR для оцифровки отсканированных счетов, передавать извлеченный текст через LLM для семантической классификации, направлять результат в рабочий процесс RPA для ввода данных и, наконец, создавать фирменный отчет с помощью API документов. AI-агент документов находится в центре такого конвейера как компонент, который понимает запрос человека и координирует любые инструменты, необходимые для его выполнения.
3. Как работает AI-агент для обработки документов?
На верхнем уровне AI-агент документов проходит пять концептуальных этапов:
Пользователь предоставляет инструкцию на естественном языке
     ↓
AI-модель интерпретирует намерение и определяет необходимые операции
     ↓
Агент выбирает соответствующие инструменты или API для обработки документов
     ↓
API документов выполняют файловые операции (чтение, изменение, создание)
     ↓
Выходной документ создается с использованием детерминированных операций обработки
Каждый этап включает решения, определяющие, насколько точным, надежным и хорошо отформатированным будет итоговый результат.
Пример: от запроса на естественном языке до готового документа
Рассмотрим сценарий: менеджер отправляет папку с рабочими книгами региональных продаж и просит консолидированный сводный отчет в формате Word.
«Прочитай все файлы продаж за 3-й квартал в этой папке, сравни каждый регион с предыдущим кварталом, обобщи ключевые тенденции и выбросы, и сохрани результаты в виде отформатированного документа Word».
За кулисами агент декомпозирует это предложение в последовательность операций:
- Обнаружить и открыть каждый файл
.xlsxв указанной директории. - Прочитать сводные строки или ключевые листы из каждой книги.
- Вычислить изменения за период.
- Определить регионы с наилучшими и наихудшими показателями.
- Составить повествовательное резюме, описывающее тенденции.
- Создать новый документ Word, вставить резюме, добавить таблицы с региональными сравнениями и применить форматирование в соответствии с корпоративными шаблонами.
Такой рабочий процесс, где чтение данных из одного типа файла и создание вывода в другом требует как семантического рассуждения, так и точной манипуляции файлами, — это именно то, где AI-агенты приносят наибольшую пользу. Инструменты, такие как Spire.Agent.Office, объединяют уровень оркестрации с детерминированными API документов.
4. Что могут делать AI-агенты с документами?
В зависимости от возможностей базовых инструментов, AI-агенты могут охватывать широкий спектр операций, которые разработчики традиционно реализуют с помощью явного кода — только теперь они выражаются через намерения, а не синтаксис.
| Возможность | Word | Excel | PowerPoint | |
|---|---|---|---|---|
| Создание | Да | Да | Да | Да |
| Редактирование | Да | Да | Да | Да |
| Преобразование | Да | Да | Да | Да |
| Анализ / Резюмирование | Да | Да | Да | Да |
5. Подходы к автоматизации документов
Выбор технологии зависит от того, с какими документами вы работаете, как часто они меняются и сколько инженерных ресурсов у вас есть.
- Агент на естественном языке: Дружелюбное взаимодействие, минимальный шаблонный код, адаптация к разным форматам.
- LLM API + пользовательский код: Высокая настраиваемость, полный контроль над оркестрацией.
- Традиционный SDK / API: Полная детерминированность, точный контроль над версткой и стилем.
- RPA / Workflow engine: Хорошо для повторяющихся процессов, основанных на правилах.
6. AI-обработка документов vs Интеллектуальная обработка документов (IDP)
Термины часто пересекаются. IDP традиционно фокусируется на этапе захвата и извлечения (сканирование, классификация, OCR, извлечение полей). AI-обработка документов — это более широкий зонтичный термин, который включает в себя не только извлечение, но и генерацию, трансформацию и агентное рассуждение.
7. Почему AI-агенты полезны для обработки документов?
Основная причина заключается в том, что большинство задач требуют одновременного выполнения трех условий: понимания намерения пользователя, выполнения действий над файлами и сохранения структуры и форматирования. AI-агенты объединяют эти возможности, позволяя разработчикам использовать мощь LLM для понимания и надежность API документов для точного вывода.
8. Часто задаваемые вопросы
В чем разница между AI-агентом и обычной LLM?
LLM — это нейронная сеть для генерации текста. Она не имеет встроенного контроля над форматами файлов. AI-агент — это надстройка, которая связывает LLM с инструментами обработки файлов (Word, Excel, PDF), позволяя выполнять реальные операции с документами.
Нужно ли отправлять документы в облако?
Не обязательно. Многие решения позволяют развертывать модели локально или в частном облаке, обеспечивая конфиденциальность данных.
Какие форматы поддерживаются?
Обычно поддерживаются все основные офисные форматы: Word (docx), Excel (xlsx), PowerPoint (pptx) и PDF, а также промежуточные форматы (HTML, Markdown, CSV).
Готовы попробовать AI-обработку документов?
Если вы оцениваете варианты интеграции AI-агентов в .NET-приложение, начните с официального руководства Getting Started.
Дополнительное чтение
Limpar ou remover filtros no Excel: 6 maneiras (manuais e automatizadas)
Índice
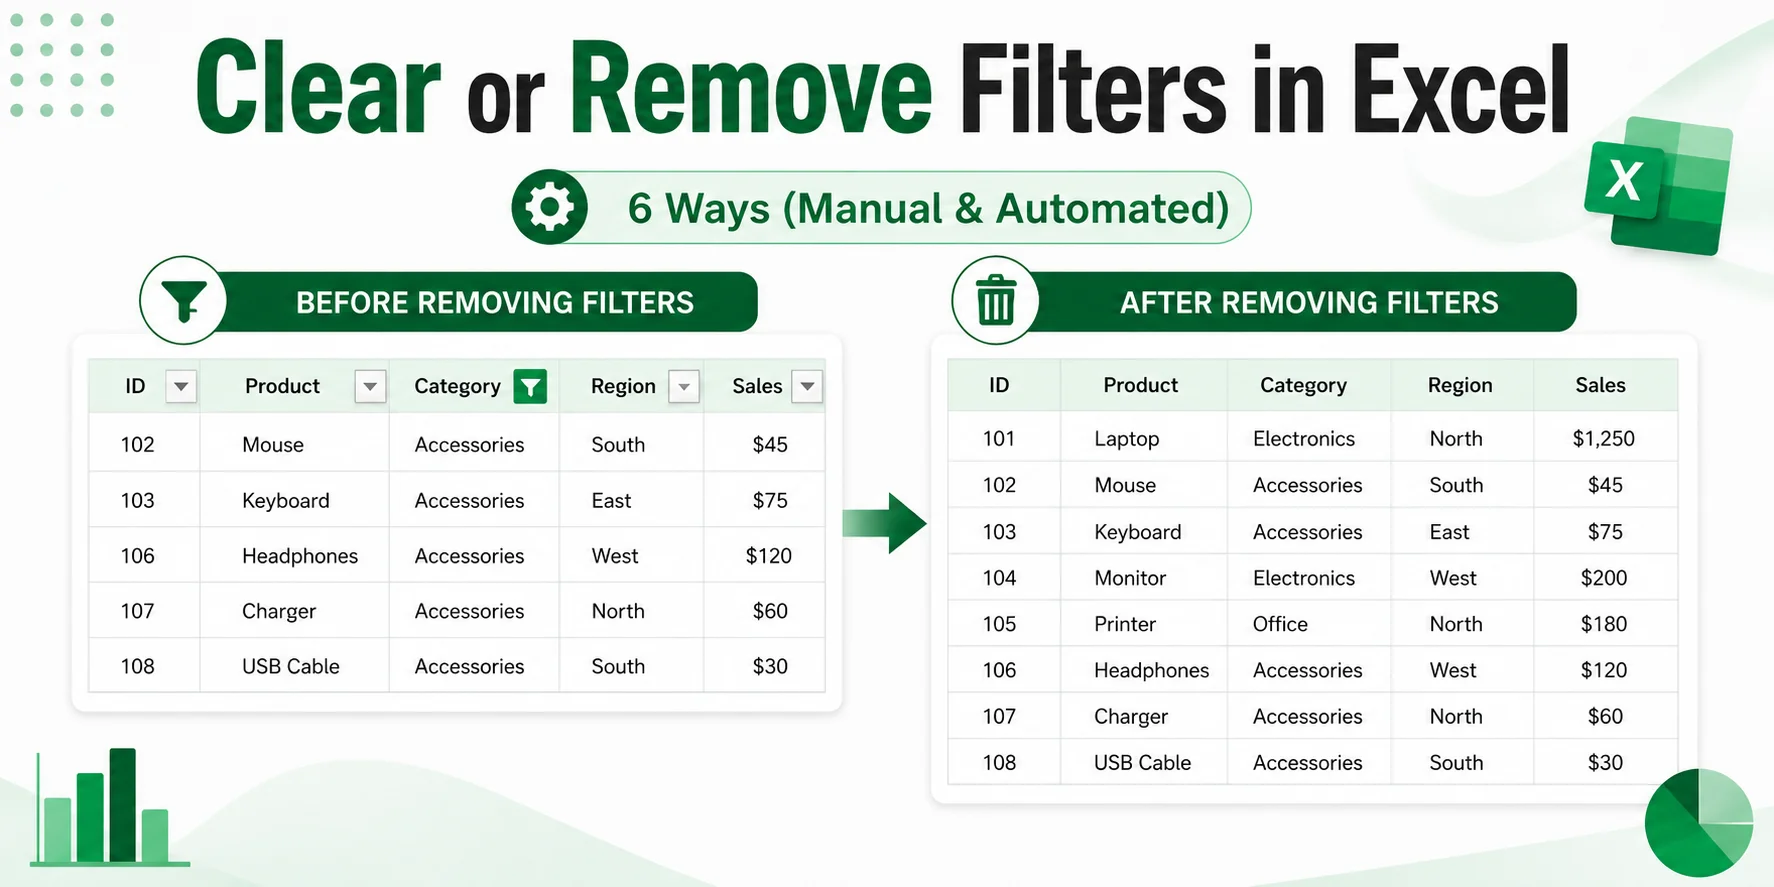
- Limpar vs. Remover Filtros no Excel
- Parte 1: Soluções Rápidas para Usuários Diários do Excel (Desktop e Web)
- Parte 2: Soluções de Automação para Usuários Avançados e Desenvolvedores
- Resumo: Qual Método Você Deve Escolher?
- Perguntas Frequentes
Os filtros no Excel facilitam o foco em registros específicos em uma planilha grande. Mas, quando um relatório está pronto para ser compartilhado, uma pasta de trabalho filtrada é reutilizada ou você precisa revisar o conjunto de dados completo, os filtros ativos podem ocultar linhas importantes ou deixar setas de filtro desnecessárias no lugar.
Limpar ou remover filtros no Excel é simples, mas o método correto depende do que você deseja manter. Você pode precisar apenas redefinir uma coluna, limpar todos os filtros ativos mantendo os controles de filtro, remover as setas de filtro completamente ou limpar filtros de várias pastas de trabalho de uma só vez. Este guia aborda seis métodos práticos para realizar isso usando o Excel para desktop, Excel para a web, VBA e C#.
Limpar vs. Remover Filtros no Excel
Limpar filtros e remover filtros no Excel não são a mesma ação. Entender a diferença ajuda você a redefinir suas visualizações de dados de forma eficiente sem interromper seu fluxo de trabalho:
| Ação | O que faz | Setas de Filtro |
|---|---|---|
| Limpar Filtro | Remove os critérios de filtro ativos e mostra os dados ocultos por esses filtros | Permanecem |
| Remover Filtro | Desativa a filtragem e remove os controles de filtro completamente | Removidas |
Quando usar cada um
- Use Limpar quando quiser redefinir sua visualização atual e continuar filtrando.
- Use Remover quando não precisar mais de filtragem no intervalo e quiser uma visualização limpa.
Parte 1: Soluções Rápidas para Usuários Diários do Excel (Desktop e Web)
Se você está trabalhando atualmente na versão desktop ou web do Excel, use os métodos manuais abaixo para limpar ou remover filtros.
Nota Importante: As operações descritas abaixo aplicam-se a intervalos de células padrão e Tabelas.
Método 1: Limpar um Filtro de uma Única Coluna
Use este método quando tiver filtros ativos em várias colunas (por exemplo, País e Ano), mas quiser redefinir os critérios apenas para uma coluna sem alterar os filtros aplicados às outras.
Instruções Passo a Passo
- Clique no ícone de filtro no cabeçalho da coluna filtrada.
- Selecione Limpar Filtro de "[Nome da Coluna]".
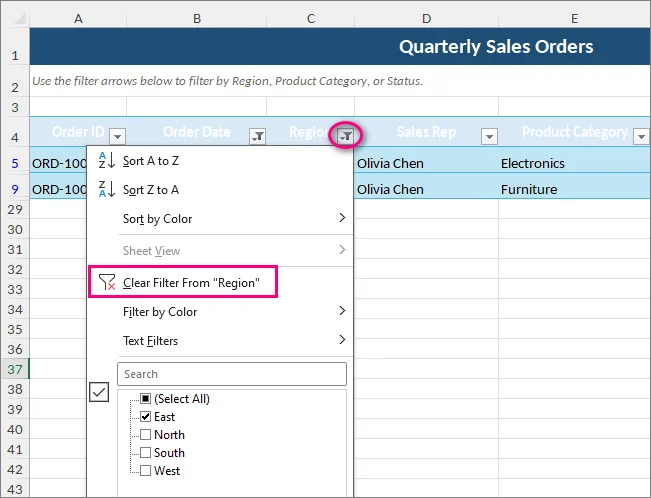
Atalhos de Teclado
- Windows: Clique na célula de cabeçalho da coluna filtrada, pressione Alt + Seta para Baixo para abrir o menu de filtro e, em seguida, pressione C.
- Mac: Selecione a célula de cabeçalho, pressione Option + Seta para Baixo para abrir o menu de filtro e selecione Limpar Filtro.
Resultado: O Excel exibe novamente as linhas ocultas pelo filtro daquela coluna, enquanto os filtros em outras colunas permanecem ativos.
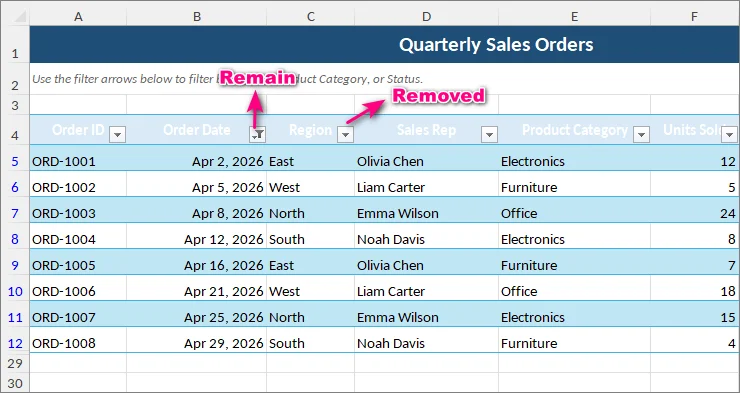
Dica: Se você não conseguir selecionar o ícone de filtro, verifique se sua planilha está protegida. A proteção da planilha pode bloquear ações de redefinição de filtro.
Método 2: Limpar Todos os Filtros em uma Planilha
Use este método quando várias colunas estiverem filtradas e você precisar restaurar o conjunto de dados completo de uma vez, sem desativar o recurso de filtragem.
Instruções Passo a Passo
- Vá para a guia Dados na Faixa de Opções (Ribbon) do Excel.
- No grupo Classificar e Filtrar, clique no botão Limpar.
(Alternativamente, vá para a guia Página Inicial > Classificar e Filtrar (no grupo Edição) > Limpar).
Atalhos de Teclado
- Windows: Pressione Alt + A + C em sequência.
- Mac: O Excel para Mac não possui um atalho nativo para limpar filtros. Use o método da faixa de opções acima.
Resultado: O Excel exibe novamente as linhas ocultas por filtros ativos em toda a planilha, mantendo as setas suspensas de filtro na linha de cabeçalho.
Método 3: Remover Filtros e Setas de Filtro Completamente
Se você deseja desativar o recurso de filtragem inteiramente e remover as setas suspensas dos cabeçalhos do seu conjunto de dados, este é o método para você.
Instruções Passo a Passo
- Clique em qualquer célula dentro do seu intervalo de dados.
- Vá para a guia Dados na Faixa de Opções do Excel.
- No grupo Classificar e Filtrar, clique no botão Filtro (o ícone de funil grande) para desativá-lo.
(Alternativamente, vá para a guia Página Inicial > Classificar e Filtrar > Filtro).
Atalhos de Teclado
- Windows: Pressione Ctrl + Shift + L (ou Alt + A + T) em sequência.
- Mac: Pressione Cmd + Shift + F.
Resultado: O Excel remove todos os critérios de filtro ativos, exibe novamente as linhas ocultas por esses filtros e remove as setas suspensas de filtro da linha de cabeçalho.
Notas:
- Remover filtros afeta apenas a configuração de filtragem; não remove a formatação de células ou formatação condicional. Se você também quiser limpar regras visuais na planilha, veja como remover formatação condicional no Excel.
- Remover filtros apenas alterna o recurso AutoFiltro. Ele não excluirá, ocultará ou modificará os dados das células de origem. Linhas ocultas criadas manualmente (não por filtros) permanecerão ocultas.
Método 4: Limpar ou Remover Filtros no Excel para a Web
Se você não tem o aplicativo Excel instalado ou está trabalhando em um navegador da web, pode limpar os critérios de filtro ou desativar a filtragem usando o Excel para a Web.
Instruções Passo a Passo
- Clique em qualquer célula dentro do seu conjunto de dados filtrado.
- Vá para a guia Dados na faixa de opções.
- Escolha sua ação:
- Para limpar critérios: Clique em Limpar.
- Para remover filtros inteiramente: Clique no botão Filtro para desativar o recurso.
Nota de Colaboração:
Se você estiver trabalhando em uma pasta de trabalho compartilhada armazenada no OneDrive ou SharePoint, o Excel pode perguntar se você deseja que a alteração de filtragem se aplique apenas a você ou a todos. Selecione "Ver apenas as minhas" para trabalhar em uma Exibição de Planilha separada sem alterar o que outros usuários veem.
Parte 2: Soluções de Automação para Usuários Avançados e Desenvolvedores
Os métodos manuais funcionam bem para pastas de trabalho individuais. Se você precisar limpar filtros repetidamente em várias planilhas ou arquivos, as soluções automatizadas de VBA e C# abaixo podem reduzir drasticamente seu trabalho repetitivo.
Método 5: Limpar Filtros em Todas as Planilhas (Macro VBA)
Esta macro VBA verifica cada planilha na pasta de trabalho e limpa os critérios de filtro ativos de intervalos de células e tabelas, mantendo os controles de AutoFiltro existentes no lugar:
Sub ClearFiltersFromAllWorksheets()
    Dim ws As Worksheet
    Dim tbl As ListObject

    For Each ws In ThisWorkbook.Worksheets
        ' Limpar filtros de um intervalo de células padrão
        If ws.FilterMode Then
            ws.ShowAllData
        End If

        ' Limpar filtros de Tabelas do Excel
        For Each tbl In ws.ListObjects
            If Not tbl.AutoFilter Is Nothing Then
                tbl.AutoFilter.ShowAllData
            End If
        Next tbl
    Next ws
End Sub
Como Implementar
- Pressione Alt + F11 (Windows) ou Option + F11 (Mac) para abrir o Editor VBA.
- Clique em Inserir > Módulo no menu superior.
- Cole o código da macro acima na janela.
- Pressione F5 para executar, ou feche o editor e pressione Alt + F8 (Windows) / Option + F8 (Mac) para executá-la diretamente do Excel.
⚠️ Aviso Importante
Executar uma macro VBA limpa o histórico de Desfazer do Excel, portanto, as alterações feitas pela macro geralmente não podem ser revertidas com Ctrl + Z. Sempre teste a macro em uma cópia de backup dos seus dados primeiro. Se você quiser manter o código VBA na pasta de trabalho, salve-a como uma Pasta de Trabalho Habilitada para Macro do Excel (.xlsm).
Se você não precisar mais do código VBA após executar a macro, você também pode remover macros da pasta de trabalho do Excel antes de compartilhá-la.
Método 6: Remover Filtros em Lote de Vários Arquivos Excel com C#
O VBA é útil quando você já está trabalhando no Excel, mas ainda requer um ambiente de desktop Excel e execução manual.
Para processamento em lote ou fluxos de trabalho do lado do servidor, abrir cada pasta de trabalho manualmente é impraticável. O exemplo C# a seguir usa o Spire.XLS for .NET para remover AutoFiltros de cada planilha em vários arquivos Excel sem iniciar o Microsoft Excel ou usar o Office Interop.
Passo 1: Instalar a Biblioteca Excel
Integre o pacote ao seu projeto via Gerenciador de Pacotes NuGet:
Install-Package Spire.XLS
Ou via CLI do .NET:
dotnet add package Spire.XLS
Passo 2: Código C# para Remover Filtros em Lote Automaticamente
O programa C# a seguir lê todos os arquivos Excel de um diretório de entrada, percorre cada planilha, remove AutoFiltros e setas de filtro de intervalos de células padrão e Tabelas do Excel, e salva as pastas de trabalho processadas em uma pasta de destino.
using System;
using System.IO;
using Spire.Xls;

class Program
{
    static void Main(string[] args)
    {
        // Definir caminhos dos diretórios de entrada e saída
        string inputFolder = @"C:\ExcelFiles\Input";
        string outputFolder = @"C:\ExcelFiles\Output";

        // Garantir que o diretório de saída exista
        if (!Directory.Exists(outputFolder))
        {
            Directory.CreateDirectory(outputFolder);
        }

        // Obter arquivos Excel da pasta de entrada
        string[] excelFiles = Directory.GetFiles(inputFolder, "*.xl*");

        Console.WriteLine($"Encontrados {excelFiles.Length} arquivos para processar.");

        foreach (string file in excelFiles)
        {
            Workbook workbook = new Workbook();

            try
            {
                // Carregar o arquivo Excel
                workbook.LoadFromFile(file);

                // Percorrer cada planilha
                foreach (Worksheet sheet in workbook.Worksheets)
                {
                    // Remover AutoFiltros de intervalos de células padrão
                    sheet.AutoFilters.Clear();

                    // Remover AutoFiltros de Tabelas do Excel
                    for (int i = 0; i < sheet.ListObjects.Count; i++)
                    {
                        var table = sheet.ListObjects[i];
                        table.AutoFilters.Clear();
                    }
                }

                // Construir o caminho de saída e salvar o arquivo
                string fileName = Path.GetFileName(file);
                string outputPath = Path.Combine(outputFolder, fileName);

                workbook.SaveToFile(outputPath);

                Console.WriteLine(
                    $"Filtros removidos com sucesso de: {fileName}");
            }
            catch (Exception ex)
            {
                Console.WriteLine(
                    $"Erro ao processar o arquivo {Path.GetFileName(file)}: {ex.Message}");
            }
            finally
            {
                workbook.Dispose();
            }
        }

        Console.WriteLine("Processamento em lote concluído.");
    }
}
Solução de problemas:
- Arquivos Excel protegidos por senha/criptografados gerarão exceções de carregamento; você precisa fornecer as senhas da pasta de trabalho durante o
LoadFromFile.
Nota de Licença: A versão de avaliação da biblioteca pode adicionar uma planilha de Aviso de Avaliação às pastas de trabalho geradas. Você pode obter uma licença temporária para removê-la.
Resumo: Qual Método Você Deve Escolher?
O método correto depende do que você precisa limpar, se deseja manter os controles de filtragem e quantas planilhas ou arquivos você precisa processar.
| Método | Melhor usado para | Mantém Setas Suspensas? | Nível de Habilidade |
|---|---|---|---|
| 1. Limpar Filtro de Coluna Única | Ajustes específicos de coluna sem perturbar outros filtros | ✅ Sim | Iniciante |
| 2. Limpar Todos os Filtros | Retornar a planilha para uma visualização completa dos dados | ✅ Sim | Iniciante |
| 3. Remover Filtros Completamente | Preparar um relatório limpo sem controles de filtro | ❌ Não | Iniciante |
| 4. Excel para a Web | Trabalhar em um navegador ou colaborar em pastas compartilhadas | Depende da ação | Iniciante |
| 5. Macro VBA | Limpeza repetitiva de filtros dentro de uma pasta ativa | ✅ Sim | Intermediário |
| 6. Processamento em Lote C# | Processamento de Excel em lote ou no lado do servidor | ❌ Não | Avançado |
Para a maioria das tarefas diárias do Excel, os Métodos 1–4 geralmente são suficientes. VBA e C# são mais adequados para operações repetitivas em várias planilhas ou arquivos, especialmente quando o processamento manual se torna ineficiente.
Perguntas Frequentes
P: Por que meu botão "Dados > Limpar" está esmaecido?
R: O comando Dados > Limpar não está disponível quando não há critérios de filtro ativos a serem limpos. As setas de filtro ainda podem estar visíveis porque a filtragem em si ainda está ativada.
P: Posso ocultar setas de filtro em uma Tabela do Excel?
R: Sim. Clique dentro da tabela, vá para a guia Design da Tabela na parte superior e desmarque Botão de Filtro. Isso apenas oculta a seta suspensa. Os critérios de filtro existentes permanecem ativos e as linhas filtradas permanecem ocultas. Use Dados > Limpar antes se precisar mostrar todas as linhas da tabela.
P: Limpar um filtro excluirá minhas linhas ocultas?
R: Não. A filtragem oculta linhas que não correspondem aos critérios ativos; ela não as exclui. Limpar ou remover filtros exibe essas linhas novamente. Linhas ocultas manualmente permanecem ocultas.
P: Posso remover a filtragem de apenas uma coluna no Excel?
R: Não. Você pode limpar os critérios de filtro de uma coluna individual, mas não pode desativar a filtragem para apenas uma coluna dentro de um intervalo filtrado. Os filtros são aplicados a todo o intervalo. Se você não quiser que uma coluna específica esteja disponível para filtragem, considere ocultá-la.