Criar marcadores em PDF para uma navegação fácil
Índice
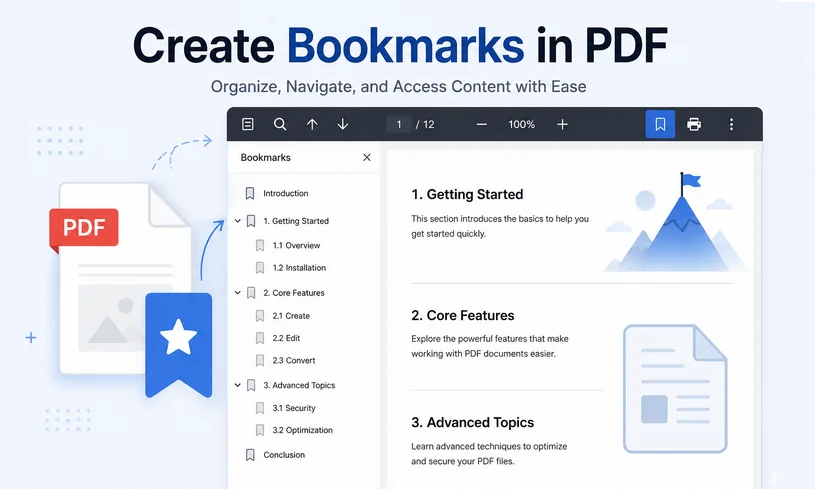
Arquivos PDF longos, como e-books, manuais técnicos, relatórios e whitepapers, podem se tornar difíceis de navegar. Rolar centenas de páginas para encontrar capítulos específicos desperdiça seu tempo e o de seus leitores. É exatamente por isso que os marcadores de PDF são importantes.
Os marcadores de PDF funcionam como pontos de navegação interativos e clicáveis. Eles permitem que os usuários saltem instantaneamente para capítulos, seções, figuras ou páginas importantes sem a necessidade de rolagem infinita. Quer você trabalhe com relatórios de negócios, artigos acadêmicos ou documentação técnica, saber como criar marcadores em PDF melhorará significativamente a experiência com seus documentos.
Neste artigo, abordaremos fluxos de trabalho manuais para usuários comuns e abordagens baseadas em código para desenvolvedores adicionarem marcadores de PDF de forma eficaz.
- O que são exatamente os marcadores de PDF?
- Criar marcadores de PDF manualmente no Adobe Acrobat Pro
- Criar marcadores em PDF programaticamente para desenvolvedores
- Gerar marcadores de PDF diretamente do Microsoft Word
- Perguntas Frequentes (FAQs)
O que são exatamente os marcadores de PDF?
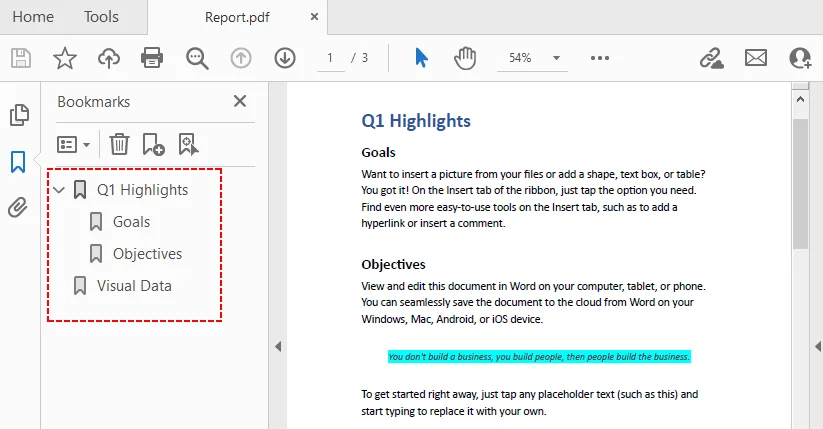
Os marcadores de PDF (também chamados de contornos ou outlines) são uma árvore de tópicos interativa armazenada dentro do próprio arquivo PDF. Cada marcador aponta para uma página, posição ou configuração de visualização de destino. Os marcadores suportam aninhamento hierárquico, permitindo que capítulos principais contenham vários submarcadores.
Benefícios dos marcadores de PDF:
- Navegação rápida com um clique em documentos extensos
- Estrutura do documento visível no painel lateral
- Suporte a contornos aninhados de vários níveis para conteúdo complexo
- Funcionam na maioria dos leitores de PDF em desktop e dispositivos móveis
- Não requerem arquivos externos extras; todos os dados residem dentro do PDF
Criar marcadores de PDF manualmente no Adobe Acrobat Pro
O Adobe Acrobat Pro é o padrão da indústria para edição de PDF e oferece recursos robustos de marcação.
Como adicionar marcadores no Adobe:
- Abra seu PDF no Adobe Acrobat Pro.
- Exiba o painel de Marcadores clicando no ícone “Marcador” (parece uma fita) no lado direito.
- Navegue até a página ou seção que deseja marcar.
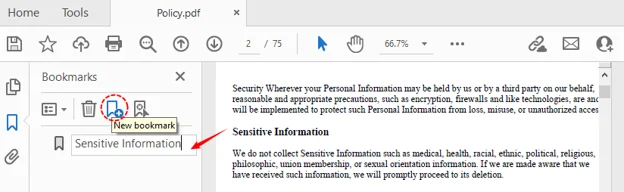
- Crie um novo marcador clicando no ícone “Novo Marcador” (página com um sinal de mais) na parte superior do painel.
- Digite um nome claro e descritivo para o marcador e pressione Enter.
Dica profissional para usuários do Acrobat:
Se você selecionar um texto antes de criar um marcador, o Acrobat usará automaticamente as palavras selecionadas como o título do marcador. Isso economiza tempo e garante consistência com os títulos do seu documento.
Embora os marcadores sirvam como uma espinha dorsal de navegação oculta para a barra lateral, gerar um Índice visível permite extrair os títulos dos seus marcadores e os números de página correspondentes para uma página dedicada dentro do texto.
Criar marcadores em PDF programaticamente para desenvolvedores
Adicionar marcadores manualmente a PDFs torna-se ineficiente se você precisar processar centenas de arquivos PDF ou automatizar pipelines de geração de documentos. Desenvolvedores podem inserir marcadores via código ao criar ou processar documentos PDF.
Solução recomendada: Free Spire.PDF for .NET
O Free Spire.PDF for .NET é uma biblioteca .NET independente que permite aos desenvolvedores criar, escrever, editar, converter e ler arquivos PDF em qualquer aplicação .NET. Ele suporta adicionar e modificar marcadores programaticamente.
Veja como inserir marcadores em PDF usando C#:
1. Instalar o Free Spire.PDF for .NET
Primeiro, adicione a biblioteca gratuita ao seu projeto .NET via Gerenciador de Pacotes NuGet
PM> Install-Package FreeSpire.PDF
2. Adicionar os Namespaces necessários
Essas importações dão acesso a primitivas gráficas, gatilhos de ação e objetos de coleção de marcadores.
using System.Drawing;
using Spire.Pdf;
using Spire.Pdf.Graphics;
using Spire.Pdf.Actions;
using Spire.Pdf.Bookmarks;
using Spire.Pdf.General;
3. Escrever o código para adicionar marcadores
Vamos expandir o exemplo. O código a seguir demonstra como:
- Carregar um PDF existente
- Adicionar marcadores pai de nível superior
- Adicionar submarcadores filhos aninhados
- Definir posições de página de destino, cor do texto do marcador e estilos de fonte
- Exportar o PDF modificado
namespace AddBookmark
{
    class Program
    {
        static void Main(string[] args)
        {
            // Criar um objeto PdfDocument
            PdfDocument pdf = new PdfDocument();

            // Carregar o arquivo PDF de origem
            pdf.LoadFromFile("template.pdf");

            // Obter a primeira página
            PdfPageBase page1 = pdf.Pages[0];

            // Adicionar um marcador pai em (290, 70)
            PdfBookmark execSummary = pdf.Bookmarks.Add("Resumo Executivo");
            PdfDestination dest1 = new PdfDestination(page1, new PointF(290, 70));
            execSummary.Action = new PdfGoToAction(dest1);
            execSummary.Color = new PdfRGBColor(Color.Black);
            execSummary.DisplayStyle = PdfTextStyle.Bold;

            // Adiciona dois marcadores filhos na localização especificada
            PdfBookmark problem = execSummary.Add("O Problema");
            PdfDestination destProb = new PdfDestination(page1, new PointF(70, 465));
            problem.Action = new PdfGoToAction(destProb);
            problem.Color = new PdfRGBColor(Color.Brown);
            problem.DisplayStyle = PdfTextStyle.Italic;

            PdfBookmark solution = execSummary.Add("A Solução");
            PdfDestination destSol = new PdfDestination(page1, new PointF(345, 480));
            solution.Action = new PdfGoToAction(destSol);
            solution.Color = new PdfRGBColor(Color.Brown);
            solution.DisplayStyle = PdfTextStyle.Italic;

            // Obter a segunda página
            PdfPageBase page2 = pdf.Pages[1];

            // Adicionar um marcador pai em (70, 75)
            PdfBookmark deliverables = pdf.Bookmarks.Add("Entregáveis do Projeto");
            PdfDestination dest2 = new PdfDestination(page2, new PointF(60, 75));
            deliverables.Action = new PdfGoToAction(dest2);
            deliverables.Color = new PdfRGBColor(Color.Black);
            deliverables.DisplayStyle = PdfTextStyle.Bold;

            // Salvar o documento atualizado
            pdf.SaveToFile("AddPdfBookmarks.pdf");
            pdf.Dispose();
        }
    }
}
Referência chave da API:
pdf.Bookmarks.Add(): Adiciona um marcador pai ao documentobookmark.Add(): Adiciona um submarcador a um marcador pai existentenew PdfDestination(page, location): Define a página e a posição de destinonew PdfGoToAction(destination): Cria uma ação de "ir para" que salta para o destino especificado
Dica profissional: Para determinar posições exatas de texto em um PDF, o Free Spire.PDF permite que você obtenha coordenadas de texto ou imagens dentro do documento.
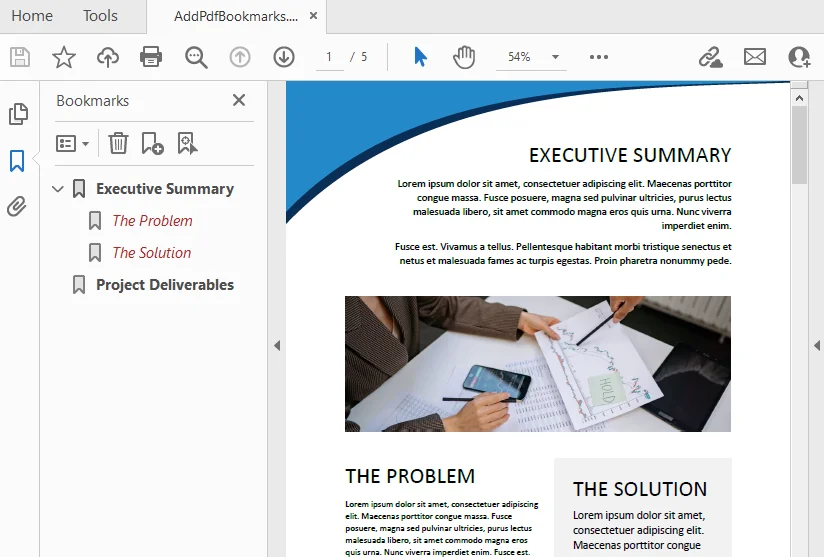
Os marcadores de PDF adicionados:
Por que escolher o Free Spire.PDF para marcação programática?
- Automação: Perfeito para processamento em lote de centenas de PDFs
- Flexibilidade: Adicione marcadores a documentos existentes ou crie novos PDFs do zero com marcadores
- Controle Total: Defina destinos, cores, estilos e hierarquias aninhadas programaticamente
- Gratuito para uso comercial: Sem taxas de licenciamento, mesmo para aplicações empresariais
- Multiplataforma: Funciona em qualquer aplicação .NET, incluindo ASP.NET e .NET Core
Gerar marcadores de PDF diretamente do Microsoft Word
Se você estiver criando um documento do zero, pode gerar marcadores automaticamente durante o processo de exportação para PDF.
Como funciona
Quando o Word gera um PDF, ele analisa as definições de estilo do seu documento. Ele mapeia os Estilos de Título integrados (Título 1, Título 2, Título 3) para marcadores hierárquicos:
- Título 1 → Marcadores de nível superior (Nível 1).
- Título 2 → Marcadores filhos aninhados (Nível 2).
- Título 3 → Marcadores netos (Nível 3).
Passos:
- Formate seu conteúdo no Word com estilos de título integrados.
- Vá em “Arquivo > Salvar Como” e selecione PDF.
- Antes de salvar, clique em “Opções” e marque “Criar marcadores usando títulos”.
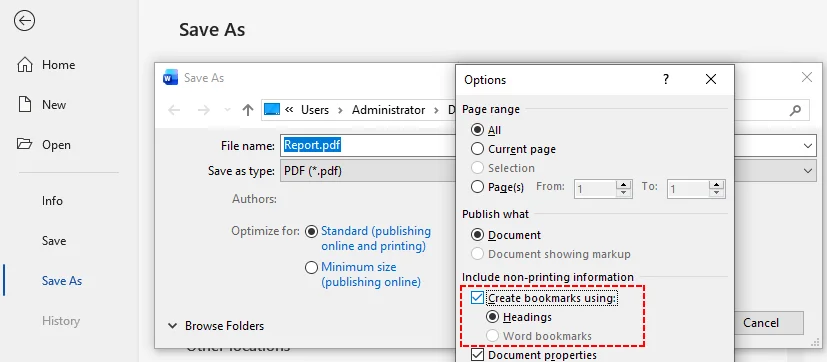
- Salve o arquivo. Seu PDF exportado conterá marcadores gerados automaticamente mapeados para seus títulos do Word.
Conclusão
Os marcadores de PDF transformam documentos pesados em recursos polidos e facilmente navegáveis. Escolha a abordagem que se adapta ao seu fluxo de trabalho:
- Adobe Acrobat Pro para controle manual e visual
- Abordagens programáticas (como o Free Spire.PDF for .NET) para automação e processamento em lote
- Microsoft Word para geração automática durante a exportação
Qualquer que seja a sua escolha, você aumentará significativamente a usabilidade do documento e a satisfação do leitor. Marcadores bem estruturados sinalizam profissionalismo e atenção aos detalhes. Invista tempo para adicioná-los, e seu público apreciará a diferença.
Perguntas Frequentes (FAQs)
P: Marcadores são a mesma coisa que hiperlinks?
R: Não. Hiperlinks em PDF são geralmente incorporados diretamente no corpo do texto (inline) e frequentemente sublinhados. Os marcadores residem em uma árvore de contorno no painel lateral dedicado. Embora ambos naveguem pelo usuário, os marcadores fornecem um mapa estrutural persistente, enquanto os hiperlinks oferecem saltos contextuais no texto.
P: Os marcadores funcionam em todos os leitores de PDF?
R: Com certeza. Os marcadores de PDF são um recurso padrão suportado por todos os principais leitores, incluindo Adobe Acrobat, Foxit, Preview (Mac) e visualizadores de PDF móveis.
P: Os marcadores aumentam significativamente o tamanho do arquivo do meu PDF?
R: Não. Os marcadores são extremamente leves. Eles são essencialmente um pequeno índice baseado em texto contendo títulos, ponteiros de página e atributos de ação. Mesmo com milhares de entradas aninhadas, o impacto no tamanho total do arquivo é insignificante em comparação com imagens ou fontes incorporadas.
P: Posso editar ou excluir marcadores existentes de um PDF sem o Adobe Acrobat?
R: Sim. A biblioteca Free Spire.PDF permite acessar a coleção pdf.Bookmarks. Você pode chamar bookmarks.RemoveAt(index) ou bookmarks.Clear() para excluí-los programaticamente sem comprar softwares de desktop caros.
Veja Também
간편한 탐색을 위한 PDF 책갈피 만들기
전자책, 기술 매뉴얼, 보고서, 백서와 같은 긴 형식의 PDF 파일은 탐색하기 어려울 수 있습니다. 특정 챕터를 찾기 위해 수백 페이지를 스크롤하는 것은 사용자와 독자 모두에게 시간 낭비입니다. 이것이 바로 PDF 북마크가 중요한 이유입니다.
PDF 북마크는 대화형 클릭 가능 탐색 지점 역할을 합니다. 사용자는 끝없이 스크롤할 필요 없이 챕터, 섹션, 그림 또는 중요한 페이지로 즉시 이동할 수 있습니다. 비즈니스 보고서, 학술 논문, 기술 문서를 다루든 상관없이 PDF 북마크를 만드는 방법을 알면 문서 경험이 크게 향상됩니다.
이 기사에서는 일반 사용자를 위한 수동 워크플로와 개발자가 PDF 북마크를 효과적으로 추가할 수 있는 코드 기반 접근 방식을 다룹니다.
- PDF 북마크란 정확히 무엇인가요?
- Adobe Acrobat Pro에서 수동으로 PDF 북마크 만들기
- 개발자를 위한 프로그래밍 방식의 PDF 북마크 생성
- Microsoft Word에서 직접 PDF 북마크 생성하기
- 자주 묻는 질문(FAQ)
PDF 북마크란 정확히 무엇인가요?
PDF 북마크(개요라고도 함)는 PDF 파일 자체에 저장된 대화형 개요 트리입니다. 각 북마크는 대상 페이지, 위치 또는 보기 설정에 연결됩니다. 북마크는 계층적 중첩을 지원하므로 주요 챕터에 여러 하위 섹션 자식 북마크를 포함할 수 있습니다.
PDF 북마크의 이점:
- 대규모 문서에서 클릭 한 번으로 빠른 탐색 가능
- 사이드바 패널에 문서 구조를 항상 표시
- 복잡한 콘텐츠를 위한 중첩된 다단계 개요 지원
- 데스크톱 및 모바일의 대부분 PDF 리더에서 작동
- 추가 외부 파일이 필요 없으며, 모든 데이터가 PDF 내부에 존재
Adobe Acrobat Pro에서 수동으로 PDF 북마크 만들기
Adobe Acrobat Pro는 PDF 편집의 업계 표준이며 강력한 북마크 기능을 제공합니다.
Adobe에서 북마크 추가하는 방법:
- Adobe Acrobat Pro에서 PDF를 엽니다.
- 오른쪽에 있는 "북마크" 아이콘(리본 모양)을 클릭하여 북마크 패널을 표시합니다.
- 북마크를 지정하려는 페이지나 섹션으로 이동합니다.
- 패널 상단에 있는 "새 북마크" 아이콘(더하기 기호가 있는 페이지)을 클릭하여 새 북마크를 만듭니다.
- 북마크에 명확하고 설명적인 이름을 입력하고 Enter 키를 누릅니다.
Acrobat 사용자를 위한 전문가 팁:
북마크를 만들기 전에 텍스트를 강조 표시하면 Acrobat이 자동으로 강조 표시된 단어를 북마크 제목으로 사용합니다. 이는 시간을 절약하고 문서 제목과의 일관성을 보장합니다.
북마크는 사이드바를 위한 숨겨진 탐색 뼈대 역할을 하지만, 눈에 보이는 목차를 생성하면 북마크 제목과 해당 페이지 번호를 전용 텍스트 페이지로 추출할 수 있습니다.
개발자를 위한 프로그래밍 방식의 PDF 북마크 생성
수백 개의 PDF 파일을 처리하거나 문서 생성 파이프라인을 자동화해야 하는 경우 수동으로 북마크를 추가하는 것은 비효율적입니다. 개발자는 PDF 문서를 빌드하거나 처리할 때 코드를 통해 북마크를 삽입할 수 있습니다.
권장 솔루션: Free Spire.PDF for .NET
Free Spire.PDF for .NET은 개발자가 모든 .NET 애플리케이션에서 PDF 파일을 생성, 작성, 편집, 변환 및 읽을 수 있게 해주는 독립형 .NET 라이브러리입니다. 이 라이브러리는 프로그래밍 방식으로 북마크를 추가하고 수정하는 기능을 지원합니다.
C#을 사용하여 PDF에 북마크를 삽입하는 방법은 다음과 같습니다:
1. Free Spire.PDF for .NET 설치
먼저 NuGet 패키지 관리자를 통해 .NET 프로젝트에 무료 라이브러리를 추가합니다.
PM> Install-Package FreeSpire.PDF
2. 필수 네임스페이스 추가
이러한 가져오기를 통해 그래픽 기본 요소, 작업 트리거 및 북마크 컬렉션 개체에 액세스할 수 있습니다.
using System.Drawing;
using Spire.Pdf;
using Spire.Pdf.Graphics;
using Spire.Pdf.Actions;
using Spire.Pdf.Bookmarks;
using Spire.Pdf.General;
3. 북마크 추가 코드 작성
예제를 확장해 보겠습니다. 다음 코드는 다음 작업을 수행하는 방법을 보여줍니다:
- 기존 PDF 로드
- 최상위 부모 북마크 추가
- 중첩된 자식 하위 북마크 추가
- 대상 페이지 위치, 북마크 텍스트 색상 및 글꼴 스타일 정의
- 수정된 PDF 출력물 내보내기
namespace AddBookmark
{
    class Program
    {
        static void Main(string[] args)
        {
            // PdfDocument 개체 생성
            PdfDocument pdf = new PdfDocument();

            // 소스 PDF 파일 로드
            pdf.LoadFromFile("template.pdf");

            // 첫 번째 페이지 가져오기
            PdfPageBase page1 = pdf.Pages[0];

            // (290, 70) 위치에 부모 북마크 추가
            PdfBookmark execSummary = pdf.Bookmarks.Add("Executive Summary");
            PdfDestination dest1 = new PdfDestination(page1, new PointF(290, 70));
            execSummary.Action = new PdfGoToAction(dest1);
            execSummary.Color = new PdfRGBColor(Color.Black);
            execSummary.DisplayStyle = PdfTextStyle.Bold;

            // 지정된 위치에 두 개의 자식 북마크 추가
            PdfBookmark problem = execSummary.Add("The Problem");
            PdfDestination destProb = new PdfDestination(page1, new PointF(70, 465));
            problem.Action = new PdfGoToAction(destProb);
            problem.Color = new PdfRGBColor(Color.Brown);
            problem.DisplayStyle = PdfTextStyle.Italic;

            PdfBookmark solution = execSummary.Add("The Solution");
            PdfDestination destSol = new PdfDestination(page1, new PointF(345, 480));
            solution.Action = new PdfGoToAction(destSol);
            solution.Color = new PdfRGBColor(Color.Brown);
            solution.DisplayStyle = PdfTextStyle.Italic;

            // 두 번째 페이지 가져오기
            PdfPageBase page2 = pdf.Pages[1];

            // (70, 75) 위치에 부모 북마크 추가
            PdfBookmark deliverables = pdf.Bookmarks.Add("Project Deliverables");
            PdfDestination dest2 = new PdfDestination(page2, new PointF(60, 75));
            deliverables.Action = new PdfGoToAction(dest2);
            deliverables.Color = new PdfRGBColor(Color.Black);
            deliverables.DisplayStyle = PdfTextStyle.Bold;

            // 업데이트된 문서 저장
            pdf.SaveToFile("AddPdfBookmarks.pdf");
            pdf.Dispose();
        }
    }
}
주요 API 참조:
pdf.Bookmarks.Add(): 문서에 부모 북마크 추가bookmark.Add(): 기존 부모 북마크에 하위 북마크 추가new PdfDestination(page, location): 대상 페이지 및 위치 정의new PdfGoToAction(destination): 지정된 대상으로 이동하는 "이동" 작업 생성
전문가 팁: PDF의 정확한 텍스트 위치를 확인하려면 Free Spire.PDF를 사용하여 문서 내 텍스트 또는 이미지의 좌표를 가져올 수 있습니다.
추가된 PDF 북마크:
프로그래밍 방식의 북마크 생성을 위해 Free Spire.PDF를 선택하는 이유?
- 자동화: 수백 개의 PDF를 일괄 처리하는 데 적합
- 유연성: 기존 문서에 북마크를 추가하거나 북마크가 포함된 새 PDF를 처음부터 생성 가능
- 완벽한 제어: 프로그래밍 방식으로 대상, 색상, 스타일 및 중첩 계층 구조 설정 가능
- 상업적 사용 무료: 비즈니스 애플리케이션에서도 라이선스 비용 없음
- 크로스 플랫폼: ASP.NET 및 .NET Core를 포함한 모든 .NET 애플리케이션에서 작동
Microsoft Word에서 직접 PDF 북마크 생성하기
문서를 처음부터 만드는 경우 PDF 내보내기 과정에서 자동으로 북마크를 생성할 수 있습니다.
작동 방식
Word가 PDF를 생성할 때 문서의 스타일 정의를 분석합니다. 내장된 제목 스타일(제목 1, 제목 2, 제목 3)을 계층적 북마크에 매핑합니다:
- 제목 1 → 최상위(레벨 1) 북마크.
- 제목 2 → 중첩된 자식(레벨 2) 북마크.
- 제목 3 → 손자(레벨 3) 북마크.
단계:
- 내장된 제목 스타일로 Word 콘텐츠 서식을 지정합니다.
- "파일 > 다른 이름으로 저장"으로 이동하여 PDF를 선택합니다.
- 저장하기 전에 "옵션"을 클릭하고 "제목을 사용하여 북마크 만들기"를 선택합니다.
- 파일을 저장합니다. 내보낸 PDF에는 Word 제목에 매핑된 자동 생성 북마크가 포함됩니다.
결론
PDF 북마크는 번거로운 문서를 세련되고 탐색하기 쉬운 리소스로 변환합니다. 워크플로에 맞는 접근 방식을 선택하세요:
- 수동 및 시각적 제어를 위한 Adobe Acrobat Pro
- 자동화 및 일괄 처리를 위한 프로그래밍 방식(Free Spire.PDF for .NET 등)
- 내보내기 중 자동 생성을 위한 Microsoft Word
어떤 방식을 선택하든 문서의 사용성과 독자의 만족도를 크게 높일 수 있습니다. 잘 구성된 북마크는 전문성과 세부 사항에 대한 주의를 나타냅니다. 시간을 투자하여 북마크를 추가하면 독자들이 그 차이를 높이 평가할 것입니다.
자주 묻는 질문(FAQ)
Q: 북마크와 하이퍼링크는 같은 것인가요?
A: 아니요. PDF의 하이퍼링크는 일반적으로 텍스트 본문 내(인라인)에 직접 삽입되며 밑줄이 그어져 있는 경우가 많습니다. 북마크는 전용 사이드 패널 개요 트리에 상주합니다. 둘 다 사용자를 탐색하게 하지만, 북마크는 지속적인 구조적 지도를 제공하는 반면 하이퍼링크는 상황에 맞는 인라인 점프를 제공합니다.
Q: 북마크는 모든 PDF 리더에서 작동하나요?
A: 물론입니다. PDF 북마크는 Adobe Acrobat, Foxit, Preview(Mac) 및 모바일 PDF 뷰어를 포함한 모든 주요 리더에서 지원되는 표준 PDF 기능입니다.
Q: 북마크가 PDF 파일 크기를 크게 증가시키나요?
A: 아니요. 북마크는 매우 가볍습니다. 본질적으로 제목, 페이지 포인터 및 작업 속성을 포함하는 작은 텍스트 기반 인덱스입니다. 수천 개의 중첩된 항목이 있더라도 전체 파일 크기에 미치는 영향은 이미지나 포함된 글꼴에 비해 무시할 수 있는 수준입니다.
Q: Adobe Acrobat 없이 PDF에서 기존 북마크를 편집하거나 삭제할 수 있나요?
A: 네. Free Spire.PDF 라이브러리를 사용하면 pdf.Bookmarks 컬렉션에 액세스할 수 있습니다. 비싼 데스크톱 소프트웨어를 구매하지 않고도 bookmarks.RemoveAt(index) 또는 bookmarks.Clear()를 호출하여 프로그래밍 방식으로 삭제할 수 있습니다.
참고 항목
Creare segnalibri in PDF per una facile navigazione
Indice
I file PDF lunghi, come e-book, manuali tecnici, report e whitepaper, possono diventare difficili da consultare. Scorrere centinaia di pagine per trovare capitoli specifici è una perdita di tempo per te e per i tuoi lettori. È esattamente per questo che i segnalibri PDF sono importanti.
I segnalibri PDF fungono da punti di navigazione interattivi cliccabili. Consentono agli utenti di passare istantaneamente a capitoli, sezioni, figure o pagine importanti senza dover scorrere all'infinito. Che tu lavori con report aziendali, documenti accademici o documentazione tecnica, sapere come creare segnalibri in PDF migliorerà notevolmente l'esperienza con i tuoi documenti.
In questo articolo, tratteremo i flussi di lavoro manuali per gli utenti comuni e gli approcci basati sul codice per gli sviluppatori per aggiungere segnalibri PDF in modo efficace.
- Cosa sono esattamente i segnalibri PDF?
- Creare manualmente segnalibri PDF in Adobe Acrobat Pro
- Creare segnalibri in PDF a livello di programmazione per sviluppatori
- Generare segnalibri PDF direttamente da Microsoft Word
- Domande frequenti (FAQ)
Cosa sono esattamente i segnalibri PDF?
I segnalibri PDF (chiamati anche strutture o "outlines") sono un indice interattivo memorizzato all'interno del file PDF stesso. Ogni segnalibro rimanda a una pagina, una posizione o un'impostazione di visualizzazione specifica. I segnalibri supportano l'annidamento gerarchico, consentendo ai capitoli principali di contenere più segnalibri secondari.
Vantaggi dei segnalibri PDF:
- Navigazione rapida con un clic in documenti di grandi dimensioni
- Struttura del documento visibile nel pannello laterale
- Supporto per indici annidati a più livelli per contenuti complessi
- Funzionano sulla maggior parte dei lettori PDF su desktop e dispositivi mobili
- Nessun file esterno richiesto; tutti i dati risiedono all'interno del PDF
Creare manualmente segnalibri PDF in Adobe Acrobat Pro
Adobe Acrobat Pro è lo standard del settore per l'editing PDF e offre robuste funzionalità di creazione di segnalibri.
Come aggiungere segnalibri in Adobe:
- Apri il tuo PDF in Adobe Acrobat Pro.
- Visualizza il pannello Segnalibri facendo clic sull'icona "Segnalibro" (che sembra un nastro) sul lato destro.
- Vai alla pagina o alla sezione che desideri aggiungere ai segnalibri.
- Crea un nuovo segnalibro facendo clic sull'icona "Nuovo segnalibro" (pagina con un segno più) nella parte superiore del pannello.
- Digita un nome chiaro e descrittivo per il segnalibro e premi Invio.
Suggerimento per gli utenti Acrobat:
Se evidenzi il testo prima di creare un segnalibro, Acrobat utilizzerà automaticamente le parole evidenziate come titolo del segnalibro. Questo fa risparmiare tempo e garantisce coerenza con le intestazioni del documento.
Mentre i segnalibri fungono da struttura di navigazione nascosta per la barra laterale, generare un indice visibile ti consente di estrarre i titoli dei segnalibri e i relativi numeri di pagina in una pagina dedicata all'interno del testo.
Creare segnalibri in PDF a livello di programmazione per sviluppatori
L'aggiunta manuale di segnalibri ai PDF diventa inefficiente se devi elaborare centinaia di file PDF o automatizzare pipeline di generazione documenti. Gli sviluppatori possono inserire segnalibri tramite codice durante la creazione o l'elaborazione di documenti PDF.
Soluzione consigliata: Free Spire.PDF for .NET
Free Spire.PDF for .NET è una libreria .NET autonoma che consente agli sviluppatori di creare, scrivere, modificare, convertire e leggere file PDF in qualsiasi applicazione .NET. Supporta l'aggiunta e la modifica dei segnalibri a livello di programmazione.
Ecco come inserire segnalibri in un PDF usando C#:
1. Installa Free Spire.PDF for .NET
Innanzitutto, aggiungi la libreria gratuita al tuo progetto .NET tramite NuGet Package Manager
PM> Install-Package FreeSpire.PDF
2. Aggiungi i namespace richiesti
Queste importazioni ti danno accesso alle primitive grafiche, ai trigger di azione e agli oggetti della raccolta di segnalibri.
using System.Drawing;
using Spire.Pdf;
using Spire.Pdf.Graphics;
using Spire.Pdf.Actions;
using Spire.Pdf.Bookmarks;
using Spire.Pdf.General;
3. Scrivi il codice per aggiungere segnalibri
Approfondiamo l'esempio. Il seguente codice mostra come:
- Caricare un PDF esistente
- Aggiungere segnalibri principali di primo livello
- Aggiungere segnalibri secondari annidati
- Definire le posizioni della pagina di destinazione, il colore del testo del segnalibro e gli stili dei caratteri
- Esportare il PDF modificato
namespace AddBookmark
{
    class Program
    {
        static void Main(string[] args)
        {
            // Crea un oggetto PdfDocument
            PdfDocument pdf = new PdfDocument();

            // Carica il file PDF sorgente
            pdf.LoadFromFile("template.pdf");

            // Ottieni la prima pagina
            PdfPageBase page1 = pdf.Pages[0];

            // Aggiungi un segnalibro principale a (290, 70)
            PdfBookmark execSummary = pdf.Bookmarks.Add("Executive Summary");
            PdfDestination dest1 = new PdfDestination(page1, new PointF(290, 70));
            execSummary.Action = new PdfGoToAction(dest1);
            execSummary.Color = new PdfRGBColor(Color.Black);
            execSummary.DisplayStyle = PdfTextStyle.Bold;

            // Aggiunge due segnalibri secondari nella posizione specificata
            PdfBookmark problem = execSummary.Add("The Problem");
            PdfDestination destProb = new PdfDestination(page1, new PointF(70, 465));
            problem.Action = new PdfGoToAction(destProb);
            problem.Color = new PdfRGBColor(Color.Brown);
            problem.DisplayStyle = PdfTextStyle.Italic;

            PdfBookmark solution = execSummary.Add("The Solution");
            PdfDestination destSol = new PdfDestination(page1, new PointF(345, 480));
            solution.Action = new PdfGoToAction(destSol);
            solution.Color = new PdfRGBColor(Color.Brown);
            solution.DisplayStyle = PdfTextStyle.Italic;

            // Ottieni la seconda pagina
            PdfPageBase page2 = pdf.Pages[1];

            // Aggiungi un segnalibro principale a (70, 75)
            PdfBookmark deliverables = pdf.Bookmarks.Add("Project Deliverables");
            PdfDestination dest2 = new PdfDestination(page2, new PointF(60, 75));
            deliverables.Action = new PdfGoToAction(dest2);
            deliverables.Color = new PdfRGBColor(Color.Black);
            deliverables.DisplayStyle = PdfTextStyle.Bold;

            // Salva il documento aggiornato
            pdf.SaveToFile("AddPdfBookmarks.pdf");
            pdf.Dispose();
        }
    }
}
Riferimento API chiave:
pdf.Bookmarks.Add(): Aggiunge un segnalibro principale al documentobookmark.Add(): Aggiunge un segnalibro secondario a un segnalibro principale esistentenew PdfDestination(page, location): Definisce la pagina e la posizione di destinazionenew PdfGoToAction(destination): Crea un'azione "vai a" che salta alla destinazione specificata
Suggerimento: Per determinare le posizioni esatte del testo nel PDF, Free Spire.PDF ti consente di ottenere le coordinate di testo o immagini all'interno del documento.
I segnalibri PDF aggiunti:
Perché scegliere Free Spire.PDF per la creazione di segnalibri programmatica?
- Automazione: Perfetto per l'elaborazione in batch di centinaia di PDF
- Flessibilità: Aggiungi segnalibri a documenti esistenti o crea nuovi PDF da zero con segnalibri
- Controllo totale: Imposta destinazioni, colori, stili e gerarchie annidate a livello di programmazione
- Gratuito per uso commerciale: Nessuna commissione di licenza, anche per applicazioni aziendali
- Multipiattaforma: Funziona su qualsiasi applicazione .NET, inclusi ASP.NET e .NET Core
Generare segnalibri PDF direttamente da Microsoft Word
Se stai creando un documento da zero, puoi generare segnalibri automaticamente durante il processo di esportazione in PDF.
Come funziona
Quando Word genera un PDF, analizza le definizioni di stile del tuo documento. Mappa gli Stili di intestazione integrati (Intestazione 1, Intestazione 2, Intestazione 3) in segnalibri gerarchici:
- Intestazione 1 → Segnalibri di primo livello.
- Intestazione 2 → Segnalibri secondari (Livello 2).
- Intestazione 3 → Segnalibri di terzo livello.
Passaggi:
- Formatta il tuo contenuto Word con gli stili di intestazione integrati.
- Vai su "File > Salva con nome" e seleziona PDF.
- Prima di salvare, fai clic su "Opzioni" e seleziona "Crea segnalibri utilizzando le intestazioni".
- Salva il file. Il tuo PDF esportato conterrà segnalibri generati automaticamente mappati sulle tue intestazioni di Word.
Conclusione
I segnalibri PDF trasformano documenti ingombranti in risorse raffinate e facilmente navigabili. Scegli l'approccio più adatto al tuo flusso di lavoro:
- Adobe Acrobat Pro per un controllo manuale e visivo
- Approcci programmatici (come Free Spire.PDF for .NET) per l'automazione e l'elaborazione in batch
- Microsoft Word per la generazione automatica durante l'esportazione
Qualunque cosa tu scelga, migliorerai significativamente l'usabilità del documento e la soddisfazione del lettore. Segnalibri ben strutturati segnalano professionalità e attenzione ai dettagli. Dedica il tempo necessario per aggiungerli e il tuo pubblico apprezzerà la differenza.
Domande frequenti (FAQ)
D: I segnalibri sono uguali ai collegamenti ipertestuali?
R: No. I collegamenti ipertestuali in PDF sono solitamente incorporati direttamente nel corpo del testo (inline) e sono spesso sottolineati. I segnalibri risiedono in un albero di struttura dedicato nel pannello laterale. Sebbene entrambi aiutino l'utente a navigare, i segnalibri forniscono una mappa strutturale persistente, mentre i collegamenti ipertestuali offrono salti contestuali nel testo.
D: I segnalibri funzionano su tutti i lettori PDF?
R: Assolutamente sì. I segnalibri PDF sono una funzionalità PDF standard supportata da tutti i principali lettori, inclusi Adobe Acrobat, Foxit, Anteprima (Mac) e i visualizzatori PDF mobili.
D: I segnalibri aumentano significativamente le dimensioni del mio file PDF?
R: No. I segnalibri sono estremamente leggeri. Sono essenzialmente un piccolo indice basato su testo contenente titoli, puntatori di pagina e attributi di azione. Anche con migliaia di voci annidate, l'impatto sulla dimensione complessiva del file è trascurabile rispetto a immagini o font incorporati.
D: Posso modificare o eliminare i segnalibri esistenti da un PDF senza Adobe Acrobat?
R: Sì. La libreria Free Spire.PDF ti consente di accedere alla raccolta pdf.Bookmarks. Puoi chiamare bookmarks.RemoveAt(index) o bookmarks.Clear() per eliminarli a livello di programmazione senza acquistare costosi software desktop.
Vedi anche
Créer des signets dans un PDF pour une navigation facile
Table des matières
Les fichiers PDF longs tels que les livres électroniques, les manuels techniques, les rapports et les livres blancs peuvent devenir difficiles à parcourir. Faire défiler des centaines de pages pour trouver des chapitres spécifiques est une perte de temps pour vous et vos lecteurs. C'est exactement pour cela que les signets PDF sont importants.
Les signets PDF agissent comme des points de navigation interactifs cliquables. Ils permettent aux utilisateurs d'accéder instantanément aux chapitres, sections, figures ou pages importantes sans défilement interminable. Que vous travailliez sur des rapports professionnels, des documents académiques ou de la documentation technique, savoir comment créer des signets dans un PDF améliorera considérablement l'expérience de lecture de votre document.
Dans cet article, nous aborderons les méthodes manuelles pour les utilisateurs réguliers et les approches basées sur le code pour les développeurs afin d'ajouter efficacement des signets PDF.
- Que sont exactement les signets PDF ?
- Créer manuellement des signets PDF dans Adobe Acrobat Pro
- Créer par programmation des signets dans un PDF pour les développeurs
- Générer des signets PDF directement depuis Microsoft Word
- Foire aux questions (FAQ)
Que sont exactement les signets PDF ?
Les signets PDF (également appelés plans ou signets de navigation) sont une structure hiérarchique interactive stockée dans le fichier PDF lui-même. Chaque signet renvoie à une page, une position ou un paramètre d'affichage cible. Les signets prennent en charge l'imbrication hiérarchique, permettant aux chapitres principaux de contenir plusieurs sous-sections.
Avantages des signets PDF :
- Navigation rapide en un clic dans les documents volumineux
- Structure du document visible dans le panneau latéral
- Prise en charge de plans imbriqués à plusieurs niveaux pour les contenus complexes
- Fonctionne sur la plupart des lecteurs PDF sur ordinateur et mobile
- Aucun fichier externe supplémentaire requis ; toutes les données résident dans le PDF
Créer manuellement des signets PDF dans Adobe Acrobat Pro
Adobe Acrobat Pro est la référence du secteur pour l'édition de PDF et offre des fonctionnalités de création de signets robustes.
Comment ajouter des signets dans Adobe :
- Ouvrez votre PDF dans Adobe Acrobat Pro.
- Affichez le panneau Signets en cliquant sur l'icône « Signet » (ressemblant à un ruban) sur le côté droit.
- Accédez à la page ou à la section que vous souhaitez marquer.
- Créez un nouveau signet en cliquant sur l'icône « Nouveau signet » (page avec un signe plus) en haut du panneau.
- Tapez un nom clair et descriptif pour le signet et appuyez sur Entrée.
Conseil d'expert pour les utilisateurs d'Acrobat :
Si vous surlignez du texte avant de créer un signet, Acrobat utilisera automatiquement les mots surlignés comme titre du signet. Cela permet de gagner du temps et d'assurer la cohérence avec les titres de votre document.
Alors que les signets servent de colonne vertébrale de navigation cachée pour la barre latérale, générer une table des matières visible vous permet d'extraire vos titres de signets et les numéros de page correspondants dans une page dédiée au sein du texte.
Créer par programmation des signets dans un PDF pour les développeurs
L'ajout manuel de signets aux PDF devient inefficace si vous devez traiter des centaines de fichiers PDF ou automatiser des pipelines de génération de documents. Les développeurs peuvent insérer des signets via du code lors de la création ou du traitement de documents PDF.
Solution recommandée : Free Spire.PDF for .NET
Free Spire.PDF for .NET est une bibliothèque .NET autonome qui permet aux développeurs de créer, écrire, modifier, convertir et lire des fichiers PDF dans n'importe quelle application .NET. Elle prend en charge l'ajout et la modification de signets par programmation.
Voici comment insérer des signets dans un PDF en utilisant C# :
1. Installer Free Spire.PDF for .NET
Tout d'abord, ajoutez la bibliothèque gratuite à votre projet .NET via le gestionnaire de paquets NuGet
PM> Install-Package FreeSpire.PDF
2. Ajouter les espaces de noms requis
Ces importations vous donnent accès aux primitives graphiques, aux déclencheurs d'action et aux objets de collection de signets.
using System.Drawing;
using Spire.Pdf;
using Spire.Pdf.Graphics;
using Spire.Pdf.Actions;
using Spire.Pdf.Bookmarks;
using Spire.Pdf.General;
3. Écrire le code pour ajouter des signets
Développons l'exemple. Le code suivant montre comment :
- Charger un PDF existant
- Ajouter des signets parents de premier niveau
- Ajouter des sous-signets enfants imbriqués
- Définir les positions de page cibles, la couleur du texte du signet et les styles de police
- Exporter le PDF modifié
namespace AddBookmark
{
    class Program
    {
        static void Main(string[] args)
        {
            // Créer un objet PdfDocument
            PdfDocument pdf = new PdfDocument();

            // Charger le fichier PDF source
            pdf.LoadFromFile("template.pdf");

            // Obtenir la première page
            PdfPageBase page1 = pdf.Pages[0];

            // Ajouter un signet parent à (290, 70)
            PdfBookmark execSummary = pdf.Bookmarks.Add("Résumé exécutif");
            PdfDestination dest1 = new PdfDestination(page1, new PointF(290, 70));
            execSummary.Action = new PdfGoToAction(dest1);
            execSummary.Color = new PdfRGBColor(Color.Black);
            execSummary.DisplayStyle = PdfTextStyle.Bold;

            // Ajouter deux sous-signets enfants à l'emplacement spécifié
            PdfBookmark problem = execSummary.Add("Le problème");
            PdfDestination destProb = new PdfDestination(page1, new PointF(70, 465));
            problem.Action = new PdfGoToAction(destProb);
            problem.Color = new PdfRGBColor(Color.Brown);
            problem.DisplayStyle = PdfTextStyle.Italic;

            PdfBookmark solution = execSummary.Add("La solution");
            PdfDestination destSol = new PdfDestination(page1, new PointF(345, 480));
            solution.Action = new PdfGoToAction(destSol);
            solution.Color = new PdfRGBColor(Color.Brown);
            solution.DisplayStyle = PdfTextStyle.Italic;

            // Obtenir la deuxième page
            PdfPageBase page2 = pdf.Pages[1];

            // Ajouter un signet parent à (70, 75)
            PdfBookmark deliverables = pdf.Bookmarks.Add("Livrables du projet");
            PdfDestination dest2 = new PdfDestination(page2, new PointF(60, 75));
            deliverables.Action = new PdfGoToAction(dest2);
            deliverables.Color = new PdfRGBColor(Color.Black);
            deliverables.DisplayStyle = PdfTextStyle.Bold;

            // Enregistrer le document mis à jour
            pdf.SaveToFile("AddPdfBookmarks.pdf");
            pdf.Dispose();
        }
    }
}
Référence API clé :
pdf.Bookmarks.Add(): Ajoute un signet parent au documentbookmark.Add(): Ajoute un sous-signet à un signet parent existantnew PdfDestination(page, location): Définit la page et la position ciblesnew PdfGoToAction(destination): Crée une action « aller à » qui saute vers la destination spécifiée
Conseil d'expert : Pour déterminer les positions exactes du texte dans un PDF, Free Spire.PDF vous permet d' obtenir les coordonnées du texte ou des images dans le document.
Les signets PDF ajoutés :
Pourquoi choisir Free Spire.PDF pour la création de signets par programmation ?
- Automatisation : Parfait pour le traitement par lots de centaines de PDF
- Flexibilité : Ajoutez des signets à des documents existants ou créez de nouveaux PDF à partir de zéro avec des signets
- Contrôle total : Définissez les destinations, les couleurs, les styles et les hiérarchies imbriquées par programmation
- Gratuit pour un usage commercial : Pas de frais de licence, même pour les applications professionnelles
- Multiplateforme : Fonctionne sur toute application .NET, y compris ASP.NET et .NET Core
Générer des signets PDF directement depuis Microsoft Word
Si vous créez un document à partir de zéro, vous pouvez générer des signets automatiquement pendant le processus d'exportation PDF.
Comment ça fonctionne
Lorsque Word génère un PDF, il analyse les définitions de style de votre document. Il mappe les styles de titre intégrés (Titre 1, Titre 2, Titre 3) aux signets hiérarchiques :
- Titre 1 → Signets de premier niveau (Niveau 1).
- Titre 2 → Signets enfants imbriqués (Niveau 2).
- Titre 3 → Signets petits-enfants (Niveau 3).
Étapes :
- Formatez votre contenu Word avec les styles de titre intégrés.
- Allez dans « Fichier > Enregistrer sous » et sélectionnez PDF.
- Avant d'enregistrer, cliquez sur « Options » et cochez « Créer des signets à l'aide des titres ».
- Enregistrez le fichier. Votre PDF exporté contiendra des signets générés automatiquement mappés sur vos titres Word.
Conclusion
Les signets PDF transforment les documents encombrants en ressources soignées et facilement navigables. Choisissez l'approche qui correspond à votre flux de travail :
- Adobe Acrobat Pro pour un contrôle manuel et visuel
- Approches programmatiques (comme Free Spire.PDF for .NET) pour l'automatisation et le traitement par lots
- Microsoft Word pour une génération automatique lors de l'exportation
Quelle que soit votre sélection, vous améliorerez considérablement la convivialité du document et la satisfaction du lecteur. Des signets bien structurés témoignent de professionnalisme et d'attention aux détails. Prenez le temps de les ajouter, et votre public appréciera la différence.
Foire aux questions (FAQ)
Q : Les signets sont-ils identiques aux hyperliens ?
R : Non. Les hyperliens dans un PDF sont généralement intégrés directement dans le corps du texte (en ligne) et sont souvent soulignés. Les signets résident dans une arborescence de panneau latéral dédiée. Bien que les deux permettent de naviguer, les signets fournissent une carte structurelle persistante, tandis que les hyperliens offrent des sauts contextuels en ligne.
Q : Les signets fonctionnent-ils sur tous les lecteurs PDF ?
R : Absolument. Les signets PDF sont une fonctionnalité PDF standard prise en charge par tous les principaux lecteurs, notamment Adobe Acrobat, Foxit, Aperçu (Mac) et les visionneuses PDF mobiles.
Q : Les signets augmentent-ils considérablement la taille de mon fichier PDF ?
R : Non. Les signets sont extrêmement légers. Il s'agit essentiellement d'un petit index textuel contenant des titres, des pointeurs de page et des attributs d'action. Même avec des milliers d'entrées imbriquées, l'impact sur la taille globale du fichier est négligeable par rapport aux images ou aux polices intégrées.
Q : Puis-je modifier ou supprimer des signets existants d'un PDF sans Adobe Acrobat ?
R : Oui. La bibliothèque Free Spire.PDF vous permet d'accéder à la collection pdf.Bookmarks. Vous pouvez appeler bookmarks.RemoveAt(index) ou bookmarks.Clear() pour les supprimer par programmation sans acheter de logiciel de bureau coûteux.
Voir aussi
- Comment ajouter un filigrane à un PDF : 4 méthodes efficaces
- 4 méthodes éprouvées pour extraire des métadonnées d'un PDF
- 3 façons de réorganiser les pages PDF : en ligne, sur ordinateur et Python
- C#/VB.NET : Obtenir les signets de documents PDF
- C#/VB.NET : Créer une table des matières (TOC) dans un PDF
Crear marcadores en PDF para una navegación sencilla
Tabla de contenidos
Los archivos PDF extensos, como libros electrónicos, manuales técnicos, informes y documentos técnicos, pueden resultar difíciles de navegar. Desplazarse por cientos de páginas para encontrar capítulos específicos es una pérdida de tiempo tanto para usted como para sus lectores. Es precisamente por eso que los marcadores (bookmarks) de PDF son importantes.
Los marcadores PDF actúan como puntos de navegación interactivos en los que se puede hacer clic. Permiten a los usuarios saltar instantáneamente a capítulos, secciones, figuras o páginas importantes sin necesidad de desplazarse interminablemente. Ya sea que trabaje con informes comerciales, documentos académicos o documentación técnica, saber cómo crear marcadores en un PDF mejorará enormemente la experiencia con sus documentos.
En este artículo, cubriremos los flujos de trabajo manuales para usuarios habituales y los enfoques basados en código para que los desarrolladores añadan marcadores PDF de forma eficaz.
- ¿Qué son exactamente los marcadores PDF?
- Crear marcadores PDF manualmente en Adobe Acrobat Pro
- Crear marcadores en PDF mediante programación para desarrolladores
- Generar marcadores PDF directamente desde Microsoft Word
- Preguntas frecuentes (FAQ)
¿Qué son exactamente los marcadores PDF?
Los marcadores PDF (también llamados esquemas) son un árbol de esquema interactivo almacenado dentro del propio archivo PDF. Cada marcador enlaza a una página, posición o configuración de vista de destino. Los marcadores admiten anidamiento jerárquico, lo que permite que los capítulos principales contengan múltiples marcadores secundarios de subsecciones.
Beneficios de los marcadores PDF:
- Navegación rápida con un solo clic a través de documentos grandes
- Mantienen la estructura del documento visible en el panel lateral
- Admiten esquemas anidados de varios niveles para contenido complejo
- Funcionan en la mayoría de los lectores de PDF en escritorio y dispositivos móviles
- No requieren archivos externos adicionales; todos los datos residen dentro del PDF
Crear marcadores PDF manualmente en Adobe Acrobat Pro
Adobe Acrobat Pro es el estándar de la industria para la edición de PDF y ofrece funciones sólidas de marcadores.
Cómo añadir marcadores en Adobe:
- Abra su PDF en Adobe Acrobat Pro.
- Muestre el panel de Marcadores haciendo clic en el icono de "Marcador" (parece una cinta) en el lado derecho.
- Navegue hasta la página o sección que desea marcar.
- Cree un nuevo marcador haciendo clic en el icono de "Nuevo marcador" (página con un signo más) en la parte superior del panel.
- Escriba un nombre claro y descriptivo para el marcador y presione Enter.
Consejo profesional para usuarios de Acrobat:
Si resalta texto antes de crear un marcador, Acrobat utilizará automáticamente las palabras resaltadas como título del marcador. Esto ahorra tiempo y garantiza la coherencia con los encabezados de su documento.
Aunque los marcadores sirven como una columna vertebral de navegación oculta para la barra lateral, generar una Tabla de contenidos visible le permite extraer los títulos de sus marcadores y los números de página correspondientes en una página dedicada dentro del texto.
Crear marcadores en PDF mediante programación para desarrolladores
Añadir marcadores a los PDF manualmente se vuelve ineficiente si necesita procesar cientos de archivos PDF o automatizar procesos de generación de documentos. Los desarrolladores pueden insertar marcadores mediante código al crear o procesar documentos PDF.
Solución recomendada: Free Spire.PDF for .NET
Free Spire.PDF for .NET es una biblioteca .NET independiente que permite a los desarrolladores crear, escribir, editar, convertir y leer archivos PDF en cualquier aplicación .NET. Admite añadir y modificar marcadores mediante programación.
A continuación, se explica cómo insertar marcadores en un PDF usando C#:
1. Instalar Free Spire.PDF for .NET
Primero, añada la biblioteca gratuita a su proyecto .NET a través del Administrador de paquetes NuGet
PM> Install-Package FreeSpire.PDF
2. Añadir los espacios de nombres (namespaces) requeridos
Estas importaciones le dan acceso a las primitivas gráficas, disparadores de acción y objetos de colección de marcadores.
using System.Drawing;
using Spire.Pdf;
using Spire.Pdf.Graphics;
using Spire.Pdf.Actions;
using Spire.Pdf.Bookmarks;
using Spire.Pdf.General;
3. Escribir el código para añadir marcadores
Ampliemos el ejemplo. El siguiente código demuestra cómo:
- Cargar un PDF existente
- Añadir marcadores principales de nivel superior
- Añadir marcadores secundarios anidados
- Definir posiciones de página de destino, color de texto del marcador y estilos de fuente
- Exportar el PDF modificado
namespace AddBookmark
{
    class Program
    {
        static void Main(string[] args)
        {
            // Crear un objeto PdfDocument
            PdfDocument pdf = new PdfDocument();

            // Cargar el archivo PDF de origen
            pdf.LoadFromFile("template.pdf");

            // Obtener la primera página
            PdfPageBase page1 = pdf.Pages[0];

            // Añadir un marcador principal en (290, 70)
            PdfBookmark execSummary = pdf.Bookmarks.Add("Resumen ejecutivo");
            PdfDestination dest1 = new PdfDestination(page1, new PointF(290, 70));
            execSummary.Action = new PdfGoToAction(dest1);
            execSummary.Color = new PdfRGBColor(Color.Black);
            execSummary.DisplayStyle = PdfTextStyle.Bold;

            // Añadir dos marcadores secundarios en la ubicación especificada
            PdfBookmark problem = execSummary.Add("El problema");
            PdfDestination destProb = new PdfDestination(page1, new PointF(70, 465));
            problem.Action = new PdfGoToAction(destProb);
            problem.Color = new PdfRGBColor(Color.Brown);
            problem.DisplayStyle = PdfTextStyle.Italic;

            PdfBookmark solution = execSummary.Add("La solución");
            PdfDestination destSol = new PdfDestination(page1, new PointF(345, 480));
            solution.Action = new PdfGoToAction(destSol);
            solution.Color = new PdfRGBColor(Color.Brown);
            solution.DisplayStyle = PdfTextStyle.Italic;

            // Obtener la segunda página
            PdfPageBase page2 = pdf.Pages[1];

            // Añadir un marcador principal en (70, 75)
            PdfBookmark deliverables = pdf.Bookmarks.Add("Entregables del proyecto");
            PdfDestination dest2 = new PdfDestination(page2, new PointF(60, 75));
            deliverables.Action = new PdfGoToAction(dest2);
            deliverables.Color = new PdfRGBColor(Color.Black);
            deliverables.DisplayStyle = PdfTextStyle.Bold;

            // Guardar el documento actualizado
            pdf.SaveToFile("AddPdfBookmarks.pdf");
            pdf.Dispose();
        }
    }
}
Referencia clave de la API:
pdf.Bookmarks.Add(): Añade un marcador principal al documentobookmark.Add(): Añade un sub-marcador a un marcador principal existentenew PdfDestination(page, location): Define la página y la posición de destinonew PdfGoToAction(destination): Crea una acción de "ir a" que salta al destino especificado
Consejo profesional: Para determinar las posiciones exactas del texto en un PDF, Free Spire.PDF le permite obtener las coordenadas de texto o imágenes dentro del documento.
Los marcadores PDF añadidos:
¿Por qué elegir Free Spire.PDF para la creación de marcadores mediante programación?
- Automatización: Perfecto para el procesamiento por lotes de cientos de PDF
- Flexibilidad: Añada marcadores a documentos existentes o cree nuevos PDF desde cero con marcadores
- Control total: Defina destinos, colores, estilos y jerarquías anidadas mediante programación
- Gratis para uso comercial: Sin tarifas de licencia, incluso para aplicaciones empresariales
- Multiplataforma: Funciona en cualquier aplicación .NET, incluyendo ASP.NET y .NET Core
Generar marcadores PDF directamente desde Microsoft Word
Si está creando un documento desde cero, puede generar marcadores automáticamente durante el proceso de exportación a PDF.
Cómo funciona
Cuando Word genera un PDF, analiza las definiciones de estilo de su documento. Asigna los Estilos de encabezado integrados (Título 1, Título 2, Título 3) a marcadores jerárquicos:
- Título 1 → Marcadores de nivel superior (Nivel 1).
- Título 2 → Marcadores secundarios anidados (Nivel 2).
- Título 3 → Marcadores de tercer nivel (Nivel 3).
Pasos:
- Formatee su contenido de Word con estilos de encabezado integrados.
- Vaya a "Archivo > Guardar como" y seleccione PDF.
- Antes de guardar, haga clic en "Opciones" y marque "Crear marcadores usando encabezados".
- Guarde el archivo. Su PDF exportado contendrá marcadores generados automáticamente asignados a sus encabezados de Word.
Conclusión
Los marcadores PDF convierten documentos voluminosos en recursos pulidos y fáciles de navegar. Elija el enfoque que se adapte a su flujo de trabajo:
- Adobe Acrobat Pro para un control manual y visual
- Enfoques programáticos (como Free Spire.PDF for .NET) para la automatización y el procesamiento por lotes
- Microsoft Word para la generación automática durante la exportación
Independientemente de lo que seleccione, mejorará significativamente la facilidad de uso del documento y la satisfacción del lector. Los marcadores bien estructurados indican profesionalismo y atención al detalle. Invierta tiempo en añadirlos y su audiencia apreciará la diferencia.
Preguntas frecuentes (FAQ)
P: ¿Son los marcadores lo mismo que los hipervínculos?
R: No. Los hipervínculos en PDF suelen estar incrustados directamente dentro del cuerpo del texto (en línea) y a menudo están subrayados. Los marcadores residen en un árbol de esquema dedicado en el panel lateral. Aunque ambos navegan por el usuario, los marcadores proporcionan un mapa estructural persistente, mientras que los hipervínculos ofrecen saltos en línea contextuales.
P: ¿Funcionan los marcadores en todos los lectores de PDF?
R: Absolutamente. Los marcadores PDF son una función estándar de PDF compatible con todos los lectores principales, incluidos Adobe Acrobat, Foxit, Vista previa (Mac) y visores de PDF móviles.
P: ¿Aumentan los marcadores el tamaño del archivo de mi PDF significativamente?
R: No. Los marcadores son extremadamente ligeros. Son esencialmente un pequeño índice basado en texto que contiene títulos, punteros de página y atributos de acción. Incluso con miles de entradas anidadas, el impacto en el tamaño total del archivo es insignificante en comparación con las imágenes o las fuentes incrustadas.
P: ¿Puedo editar o eliminar marcadores existentes de un PDF sin Adobe Acrobat?
R: Sí. La biblioteca Free Spire.PDF le permite acceder a la colección pdf.Bookmarks. Puede llamar a bookmarks.RemoveAt(index) o bookmarks.Clear() para eliminarlos mediante programación sin comprar costoso software de escritorio.
Ver también
Lesezeichen in PDF erstellen für eine einfache Navigation
Inhaltsverzeichnis
Umfangreiche PDF-Dateien wie E-Books, technische Handbücher, Berichte und Whitepapers können schwer zu navigieren sein. Das Durchblättern hunderter Seiten, um bestimmte Kapitel zu finden, verschwendet Ihre Zeit und die Ihrer Leser. Genau deshalb sind PDF-Lesezeichen so wichtig.
PDF-Lesezeichen fungieren als interaktive, anklickbare Navigationspunkte. Sie ermöglichen es Benutzern, ohne endloses Scrollen sofort zu Kapiteln, Abschnitten, Abbildungen oder wichtigen Seiten zu springen. Egal, ob Sie mit Geschäftsberichten, wissenschaftlichen Arbeiten oder technischer Dokumentation arbeiten, das Wissen, wie man Lesezeichen in PDFs erstellt, wird Ihre Dokumentenerfahrung erheblich verbessern.
In diesem Artikel behandeln wir manuelle Arbeitsabläufe für normale Benutzer sowie codebasierte Ansätze für Entwickler, um PDF-Lesezeichen effektiv hinzuzufügen.
- Was genau sind PDF-Lesezeichen?
- Manuelles Erstellen von PDF-Lesezeichen in Adobe Acrobat Pro
- Programmgesteuertes Erstellen von Lesezeichen in PDFs für Entwickler
- Generieren von PDF-Lesezeichen direkt aus Microsoft Word
- Häufig gestellte Fragen (FAQs)
Was genau sind PDF-Lesezeichen?
PDF-Lesezeichen (auch Gliederung genannt) sind ein interaktiver Gliederungsbaum, der in der PDF-Datei selbst gespeichert ist. Jedes Lesezeichen verlinkt auf eine Zielseite, eine Position oder eine Ansichtseinstellung. Lesezeichen unterstützen hierarchische Verschachtelungen, sodass Hauptkapitel mehrere untergeordnete Lesezeichen enthalten können.
Vorteile von PDF-Lesezeichen:
- Schnelle Navigation mit einem Klick durch große Dokumente
- Dokumentenstruktur bleibt im Seitenleisten-Panel sichtbar
- Unterstützung verschachtelter, mehrstufiger Gliederungen für komplexe Inhalte
- Funktionieren in den meisten PDF-Readern auf Desktop- und Mobilgeräten
- Keine zusätzlichen externen Dateien erforderlich; alle Daten befinden sich innerhalb der PDF
Manuelles Erstellen von PDF-Lesezeichen in Adobe Acrobat Pro
Adobe Acrobat Pro ist der Industriestandard für die PDF-Bearbeitung und bietet robuste Lesezeichenfunktionen.
So fügen Sie Lesezeichen in Adobe hinzu:
- Öffnen Sie Ihr PDF in Adobe Acrobat Pro.
- Blenden Sie das Lesezeichen-Panel ein, indem Sie auf das „Lesezeichen“-Symbol (sieht aus wie ein Lesezeichenband) auf der rechten Seite klicken.
- Navigieren Sie zu der Seite oder dem Abschnitt, den Sie mit einem Lesezeichen versehen möchten.
- Erstellen Sie ein neues Lesezeichen, indem Sie auf das Symbol „Neues Lesezeichen“ (Seite mit einem Pluszeichen) oben im Panel klicken.
- Geben Sie einen klaren, beschreibenden Namen für das Lesezeichen ein und drücken Sie die Eingabetaste.
Profi-Tipp für Acrobat-Benutzer:
Wenn Sie Text markieren, bevor Sie ein Lesezeichen erstellen, verwendet Acrobat die markierten Wörter automatisch als Titel für das Lesezeichen. Dies spart Zeit und sorgt für Konsistenz mit den Überschriften Ihres Dokuments.
Während Lesezeichen als verstecktes Navigationsrückgrat für die Seitenleiste dienen, ermöglicht das Erstellen eines sichtbaren Inhaltsverzeichnisses, dass Sie Ihre Lesezeichentitel und die entsprechenden Seitenzahlen auf einer eigenen Seite im Dokument extrahieren können.
Programmgesteuertes Erstellen von Lesezeichen in PDFs für Entwickler
Das manuelle Hinzufügen von Lesezeichen zu PDFs wird ineffizient, wenn Sie Hunderte von PDF-Dateien verarbeiten oder Dokumentenerstellungspipelines automatisieren müssen. Entwickler können beim Erstellen oder Verarbeiten von PDF-Dokumenten Lesezeichen per Code einfügen.
Empfohlene Lösung: Free Spire.PDF for .NET
Free Spire.PDF for .NET ist eine eigenständige .NET-Bibliothek, die es Entwicklern ermöglicht, PDF-Dateien in jeder .NET-Anwendung zu erstellen, zu schreiben, zu bearbeiten, zu konvertieren und zu lesen. Sie unterstützt das Hinzufügen und programmgesteuerte Ändern von Lesezeichen.
So fügen Sie mit C# Lesezeichen in eine PDF ein:
1. Installieren Sie Free Spire.PDF for .NET
Fügen Sie zunächst die kostenlose Bibliothek über den NuGet Package Manager zu Ihrem .NET-Projekt hinzu.
PM> Install-Package FreeSpire.PDF
2. Fügen Sie die erforderlichen Namespaces hinzu
Diese Importe geben Ihnen Zugriff auf Grafik-Primitive, Aktions-Trigger und Lesezeichen-Sammlungsobjekte.
using System.Drawing;
using Spire.Pdf;
using Spire.Pdf.Graphics;
using Spire.Pdf.Actions;
using Spire.Pdf.Bookmarks;
using Spire.Pdf.General;
3. Schreiben Sie den Code zum Hinzufügen von Lesezeichen
Lassen Sie uns das Beispiel erweitern. Der folgende Code zeigt, wie man:
- Eine vorhandene PDF lädt
- Übergeordnete Lesezeichen (Parent) hinzufügt
- Verschachtelte untergeordnete Lesezeichen (Child) hinzufügt
- Zielseitenpositionen, Textfarbe der Lesezeichen und Schriftstile definiert
- Die geänderte PDF-Ausgabe exportiert
namespace AddBookmark
{
    class Program
    {
        static void Main(string[] args)
        {
            // Erstellen eines PdfDocument-Objekts
            PdfDocument pdf = new PdfDocument();

            // Laden der Quell-PDF-Datei
            pdf.LoadFromFile("template.pdf");

            // Abrufen der ersten Seite
            PdfPageBase page1 = pdf.Pages[0];

            // Hinzufügen eines übergeordneten Lesezeichens bei (290, 70)
            PdfBookmark execSummary = pdf.Bookmarks.Add("Zusammenfassung");
            PdfDestination dest1 = new PdfDestination(page1, new PointF(290, 70));
            execSummary.Action = new PdfGoToAction(dest1);
            execSummary.Color = new PdfRGBColor(Color.Black);
            execSummary.DisplayStyle = PdfTextStyle.Bold;

            // Hinzufügen von zwei untergeordneten Lesezeichen an der angegebenen Position
            PdfBookmark problem = execSummary.Add("Das Problem");
            PdfDestination destProb = new PdfDestination(page1, new PointF(70, 465));
            problem.Action = new PdfGoToAction(destProb);
            problem.Color = new PdfRGBColor(Color.Brown);
            problem.DisplayStyle = PdfTextStyle.Italic;

            PdfBookmark solution = execSummary.Add("Die Lösung");
            PdfDestination destSol = new PdfDestination(page1, new PointF(345, 480));
            solution.Action = new PdfGoToAction(destSol);
            solution.Color = new PdfRGBColor(Color.Brown);
            solution.DisplayStyle = PdfTextStyle.Italic;

            // Abrufen der zweiten Seite
            PdfPageBase page2 = pdf.Pages[1];

            // Hinzufügen eines übergeordneten Lesezeichens bei (70, 75)
            PdfBookmark deliverables = pdf.Bookmarks.Add("Projektergebnisse");
            PdfDestination dest2 = new PdfDestination(page2, new PointF(60, 75));
            deliverables.Action = new PdfGoToAction(dest2);
            deliverables.Color = new PdfRGBColor(Color.Black);
            deliverables.DisplayStyle = PdfTextStyle.Bold;

            // Speichern des aktualisierten Dokuments
            pdf.SaveToFile("AddPdfBookmarks.pdf");
            pdf.Dispose();
        }
    }
}
Wichtige API-Referenz:
pdf.Bookmarks.Add(): Fügt ein übergeordnetes Lesezeichen zum Dokument hinzubookmark.Add(): Fügt ein untergeordnetes Lesezeichen zu einem bestehenden übergeordneten Lesezeichen hinzunew PdfDestination(page, location): Definiert die Zielseite und Positionnew PdfGoToAction(destination): Erstellt eine „Gehe zu“-Aktion, die zum angegebenen Ziel springt
Profi-Tipp: Um exakte Textpositionen in einer PDF zu bestimmen, ermöglicht Ihnen Free Spire.PDF, Koordinaten von Text oder Bildern innerhalb des Dokuments abzurufen.
Die hinzugefügten PDF-Lesezeichen:
Warum Free Spire.PDF für programmgesteuertes Lesezeichen-Erstellen wählen?
- Automatisierung: Perfekt für die Stapelverarbeitung von Hunderten von PDFs
- Flexibilität: Fügen Sie Lesezeichen zu bestehenden Dokumenten hinzu oder erstellen Sie neue PDFs von Grund auf mit Lesezeichen
- Volle Kontrolle: Legen Sie Ziele, Farben, Stile und verschachtelte Hierarchien programmgesteuert fest
- Kostenlos für die kommerzielle Nutzung: Keine Lizenzgebühren, auch für Geschäftsanwendungen
- Plattformübergreifend: Funktioniert in jeder .NET-Anwendung, einschließlich ASP.NET und .NET Core
Generieren von PDF-Lesezeichen direkt aus Microsoft Word
Wenn Sie ein Dokument von Grund auf neu erstellen, können Sie Lesezeichen automatisch während des PDF-Exportvorgangs generieren.
So funktioniert es
Wenn Word eine PDF generiert, analysiert es die Stildefinitionen Ihres Dokuments. Es ordnet die integrierten Überschriftenformate (Überschrift 1, Überschrift 2, Überschrift 3) hierarchischen Lesezeichen zu:
- Überschrift 1 → Übergeordnete (Ebene 1) Lesezeichen.
- Überschrift 2 → Verschachtelte untergeordnete (Ebene 2) Lesezeichen.
- Überschrift 3 → Enkel-Lesezeichen (Ebene 3).
Schritte:
- Formatieren Sie Ihren Word-Inhalt mit integrierten Überschriftenformaten.
- Gehen Sie auf „Datei > Speichern unter“ und wählen Sie PDF.
- Klicken Sie vor dem Speichern auf „Optionen“ und aktivieren Sie „Lesezeichen mit Überschriften erstellen“.
- Speichern Sie die Datei. Ihre exportierte PDF enthält automatisch generierte Lesezeichen, die Ihren Word-Überschriften zugeordnet sind.
Fazit
PDF-Lesezeichen verwandeln umständliche Dokumente in ausgefeilte, leicht navigierbare Ressourcen. Wählen Sie den Ansatz, der zu Ihrem Arbeitsablauf passt:
- Adobe Acrobat Pro für manuelle, visuelle Kontrolle
- Programmgesteuerte Ansätze (wie Free Spire.PDF for .NET) für Automatisierung und Stapelverarbeitung
- Microsoft Word für die automatische Generierung beim Export
Egal, wofür Sie sich entscheiden, Sie werden die Benutzerfreundlichkeit des Dokuments und die Zufriedenheit der Leser erheblich steigern. Gut strukturierte Lesezeichen signalisieren Professionalität und Liebe zum Detail. Investieren Sie die Zeit, sie hinzuzufügen, und Ihr Publikum wird den Unterschied zu schätzen wissen.
Häufig gestellte Fragen (FAQs)
F: Sind Lesezeichen dasselbe wie Hyperlinks?
A: Nein. Hyperlinks in PDFs sind normalerweise direkt in den Textkörper (inline) eingebettet und oft unterstrichen. Lesezeichen befinden sich in einem dedizierten Gliederungsbaum in der Seitenleiste. Während beide den Benutzer navigieren, bieten Lesezeichen eine dauerhafte Strukturkarte, wohingegen Hyperlinks kontextbezogene Inline-Sprünge bieten.
F: Funktionieren Lesezeichen in allen PDF-Readern?
A: Absolut. PDF-Lesezeichen sind eine Standard-PDF-Funktion, die von allen gängigen Readern unterstützt wird, einschließlich Adobe Acrobat, Foxit, Vorschau (Mac) und mobilen PDF-Viewern.
F: Erhöhen Lesezeichen die Dateigröße meiner PDF erheblich?
A: Nein. Lesezeichen sind extrem leicht. Sie sind im Wesentlichen ein kleiner textbasierter Index, der Titel, Seitenzeiger und Aktionsattribute enthält. Selbst bei Tausenden von verschachtelten Einträgen ist die Auswirkung auf die Gesamtdateigröße im Vergleich zu Bildern oder eingebetteten Schriftarten vernachlässigbar.
F: Kann ich vorhandene Lesezeichen aus einer PDF bearbeiten oder löschen, ohne Adobe Acrobat zu verwenden?
A: Ja. Die Bibliothek Free Spire.PDF ermöglicht Ihnen den Zugriff auf die Sammlung pdf.Bookmarks. Sie können bookmarks.RemoveAt(index) oder bookmarks.Clear() aufrufen, um sie programmgesteuert zu löschen, ohne teure Desktop-Software kaufen zu müssen.
Siehe auch
- So fügen Sie ein Wasserzeichen zu einer PDF hinzu: 4 effektive Wege
- 4 bewährte Methoden zum Extrahieren von Metadaten aus PDFs
- 3 Wege zum Neuanordnen von PDF-Seiten: Online, Desktop & Python
- C#/VB.NET: Lesezeichen von PDF-Dokumenten abrufen
- C#/VB.NET: Erstellen eines Inhaltsverzeichnisses (TOC) in einer PDF
Создание закладок в PDF для удобной навигации
Длинные PDF-файлы, такие как электронные книги, технические руководства, отчеты и технические задания, могут быть сложными для навигации. Прокрутка сотен страниц в поисках нужных глав — пустая трата времени для вас и ваших читателей. Именно поэтому закладки в PDF так важны.
Закладки в PDF служат интерактивными кликабельными точками навигации. Они позволяют пользователям мгновенно переходить к главам, разделам, рисункам или важным страницам без бесконечной прокрутки. Независимо от того, работаете ли вы с бизнес-отчетами, научными статьями или технической документацией, знание того, как создавать закладки в PDF, значительно улучшит работу с документами.
В этой статье мы рассмотрим как ручные методы для обычных пользователей, так и подходы на основе кода для разработчиков, чтобы эффективно добавлять закладки в PDF.
- Что такое закладки в PDF?
- Создание закладок в PDF вручную в Adobe Acrobat Pro
- Программное создание закладок в PDF для разработчиков
- Создание закладок в PDF напрямую из Microsoft Word
- Часто задаваемые вопросы (FAQ)
Что такое закладки в PDF?
Закладки в PDF (также называемые структурой) — это интерактивное дерево оглавления, хранящееся внутри самого PDF-файла. Каждая закладка ведет на целевую страницу, позицию или настройку отображения. Закладки поддерживают иерархическую вложенность, позволяя основным главам содержать несколько дочерних закладок подразделов.
Преимущества закладок в PDF:
- Быстрая навигация по большим документам в один клик
- Структура документа всегда видна на боковой панели
- Поддержка вложенных многоуровневых структур для сложного контента
- Работают в большинстве PDF-ридеров на компьютерах и мобильных устройствах
- Не требуются дополнительные внешние файлы; все данные находятся внутри PDF
Создание закладок в PDF вручную в Adobe Acrobat Pro
Adobe Acrobat Pro является отраслевым стандартом для редактирования PDF и предлагает надежные функции для работы с закладками.
Как добавить закладки в Adobe:
- Откройте ваш PDF в Adobe Acrobat Pro.
- Отобразите панель закладок, нажав на значок «Закладки» (выглядит как ленточка) в правой части экрана.
- Перейдите на страницу или к разделу, который вы хотите добавить в закладки.
- Создайте новую закладку, нажав на значок «Новая закладка» (страница со знаком плюса) в верхней части панели.
- Введите понятное, описательное название для закладки и нажмите Enter.
Совет для пользователей Acrobat:
Если вы выделите текст перед созданием закладки, Acrobat автоматически использует выделенные слова в качестве названия закладки. Это экономит время и обеспечивает единообразие с заголовками вашего документа.
В то время как закладки служат скрытым навигационным каркасом для боковой панели, создание видимого оглавления позволяет извлечь названия закладок и соответствующие номера страниц на отдельную страницу внутри текста.
Программное создание закладок в PDF для разработчиков
Ручное добавление закладок в PDF становится неэффективным, если вам нужно обработать сотни PDF-файлов или автоматизировать процессы создания документов. Разработчики могут вставлять закладки программно при создании или обработке PDF-документов.
Рекомендуемое решение: Free Spire.PDF for .NET
Free Spire.PDF for .NET — это автономная библиотека .NET, которая позволяет разработчикам создавать, записывать, редактировать, конвертировать и читать PDF-файлы в любом приложении .NET. Она поддерживает добавление и программное изменение закладок.
Вот как вставить закладки в PDF с помощью C#:
1. Установите Free Spire.PDF for .NET
Сначала добавьте бесплатную библиотеку в ваш проект .NET через NuGet Package Manager
PM> Install-Package FreeSpire.PDF
2. Добавьте необходимые пространства имен
Эти импорты дают вам доступ к графическим примитивам, триггерам действий и объектам коллекции закладок.
using System.Drawing;
using Spire.Pdf;
using Spire.Pdf.Graphics;
using Spire.Pdf.Actions;
using Spire.Pdf.Bookmarks;
using Spire.Pdf.General;
3. Напишите код для добавления закладок
Давайте расширим пример. Следующий код демонстрирует, как:
- Загрузить существующий PDF
- Добавить родительские закладки верхнего уровня
- Добавить вложенные дочерние закладки
- Определить целевые позиции страниц, цвет текста закладки и стили шрифта
- Экспортировать измененный PDF-файл
namespace AddBookmark
{
    class Program
    {
        static void Main(string[] args)
        {
            // Создать объект PdfDocument
            PdfDocument pdf = new PdfDocument();

            // Загрузить исходный PDF-файл
            pdf.LoadFromFile("template.pdf");

            // Получить первую страницу
            PdfPageBase page1 = pdf.Pages[0];

            // Добавить родительскую закладку в (290, 70)
            PdfBookmark execSummary = pdf.Bookmarks.Add("Executive Summary");
            PdfDestination dest1 = new PdfDestination(page1, new PointF(290, 70));
            execSummary.Action = new PdfGoToAction(dest1);
            execSummary.Color = new PdfRGBColor(Color.Black);
            execSummary.DisplayStyle = PdfTextStyle.Bold;

            // Добавить две дочерние закладки в указанном месте
            PdfBookmark problem = execSummary.Add("The Problem");
            PdfDestination destProb = new PdfDestination(page1, new PointF(70, 465));
            problem.Action = new PdfGoToAction(destProb);
            problem.Color = new PdfRGBColor(Color.Brown);
            problem.DisplayStyle = PdfTextStyle.Italic;

            PdfBookmark solution = execSummary.Add("The Solution");
            PdfDestination destSol = new PdfDestination(page1, new PointF(345, 480));
            solution.Action = new PdfGoToAction(destSol);
            solution.Color = new PdfRGBColor(Color.Brown);
            solution.DisplayStyle = PdfTextStyle.Italic;

            // Получить вторую страницу
            PdfPageBase page2 = pdf.Pages[1];

            // Добавить родительскую закладку в (70, 75)
            PdfBookmark deliverables = pdf.Bookmarks.Add("Project Deliverables");
            PdfDestination dest2 = new PdfDestination(page2, new PointF(60, 75));
            deliverables.Action = new PdfGoToAction(dest2);
            deliverables.Color = new PdfRGBColor(Color.Black);
            deliverables.DisplayStyle = PdfTextStyle.Bold;

            // Сохранить обновленный документ
            pdf.SaveToFile("AddPdfBookmarks.pdf");
            pdf.Dispose();
        }
    }
}
Ключевой API:
pdf.Bookmarks.Add(): Добавляет родительскую закладку в документbookmark.Add(): Добавляет дочернюю закладку к существующей родительскойnew PdfDestination(page, location): Определяет целевую страницу и позициюnew PdfGoToAction(destination): Создает действие перехода к указанному месту
Совет: Чтобы определить точные позиции текста в PDF, Free Spire.PDF позволяет вам получить координаты текста или изображений внутри документа.
Добавленные закладки в PDF:
Почему стоит выбрать Free Spire.PDF для программной работы с закладками?
- Автоматизация: Идеально подходит для пакетной обработки сотен PDF-файлов
- Гибкость: Добавляйте закладки в существующие документы или создавайте новые PDF с нуля
- Полный контроль: Программно задавайте цели, цвета, стили и вложенные иерархии
- Бесплатно для коммерческого использования: Никаких лицензионных сборов, даже для бизнес-приложений
- Кроссплатформенность: Работает в любом приложении .NET, включая ASP.NET и .NET Core
Создание закладок в PDF напрямую из Microsoft Word
Если вы создаете документ с нуля, вы можете автоматически генерировать закладки в процессе экспорта в PDF.
Как это работает
Когда Word создает PDF, он анализирует определения стилей вашего документа. Он сопоставляет встроенные стили заголовков (Заголовок 1, Заголовок 2, Заголовок 3) с иерархическими закладками:
- Заголовок 1 → Закладки верхнего уровня (Уровень 1).
- Заголовок 2 → Вложенные дочерние (Уровень 2) закладки.
- Заголовок 3 → Вложенные дочерние (Уровень 3) закладки.
Шаги:
- Отформатируйте содержимое Word с помощью встроенных стилей заголовков.
- Перейдите в «Файл > Сохранить как» и выберите PDF.
- Перед сохранением нажмите «Параметры» и установите флажок «Создать закладки с помощью заголовков».
- Сохраните файл. Ваш экспортированный PDF будет содержать автоматически созданные закладки, соответствующие вашим заголовкам в Word.
Заключение
Закладки в PDF превращают громоздкие документы в удобные и легко навигационные ресурсы. Выберите подход, который соответствует вашему рабочему процессу:
- Adobe Acrobat Pro для ручного визуального контроля
- Программные методы (например, Free Spire.PDF for .NET) для автоматизации и пакетной обработки
- Microsoft Word для автоматической генерации при экспорте
Что бы вы ни выбрали, вы значительно улучшите удобство использования документа и удовлетворенность читателей. Хорошо структурированные закладки свидетельствуют о профессионализме и внимании к деталям. Потратьте время на их добавление, и ваша аудитория оценит разницу.
Часто задаваемые вопросы (FAQ)
В: Закладки — это то же самое, что гиперссылки?
О: Нет. Гиперссылки в PDF обычно встроены непосредственно в основной текст и часто подчеркнуты. Закладки находятся в специальном дереве оглавления на боковой панели. Хотя и то, и другое помогает пользователю в навигации, закладки предоставляют постоянную структурную карту, тогда как гиперссылки предлагают контекстные внутритекстовые переходы.
В: Работают ли закладки во всех PDF-ридерах?
О: Безусловно. Закладки в PDF — это стандартная функция PDF, поддерживаемая всеми основными программами для чтения, включая Adobe Acrobat, Foxit, Preview (Mac) и мобильные PDF-просмотрщики.
В: Значительно ли увеличивают закладки размер моего PDF-файла?
О: Нет. Закладки очень легкие. По сути, это небольшой текстовый индекс, содержащий заголовки, указатели страниц и атрибуты действий. Даже при наличии тысяч вложенных записей влияние на общий размер файла ничтожно по сравнению с изображениями или встроенными шрифтами.
В: Могу ли я редактировать или удалять существующие закладки из PDF без Adobe Acrobat?
О: Да. Библиотека Free Spire.PDF позволяет получить доступ к коллекции pdf.Bookmarks. Вы можете вызвать bookmarks.RemoveAt(index) или bookmarks.Clear(), чтобы удалить их программно, не покупая дорогое настольное программное обеспечение.
Смотрите также
Como citar um PDF no formato MLA: guia passo a passo
Índice
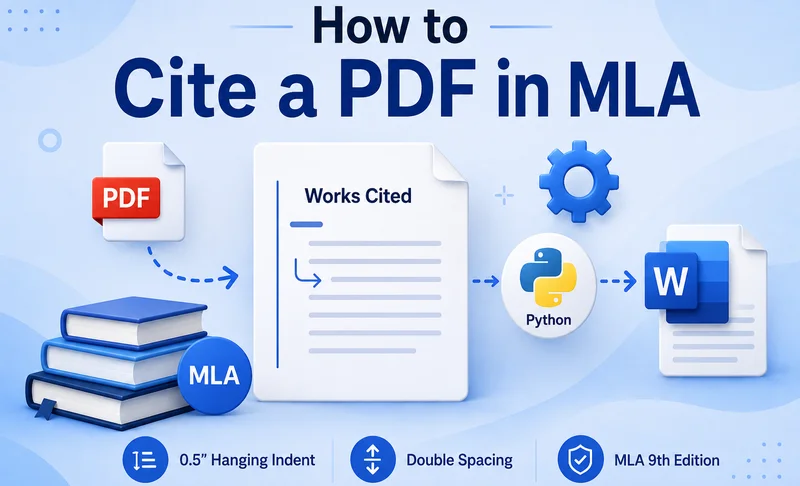
Citar um PDF em MLA exige mais do que simplesmente adicionar "PDF" a uma referência. O formato da citação depende do que o PDF contém, como um livro, artigo de periódico ou relatório, e de onde você o acessou. Uma vez preparada, a citação deve ser formatada corretamente na lista de Obras Citadas (Works Cited).
Este guia explica como citar um PDF em MLA, como formatar a citação no Microsoft Word e como automatizar a formatação de múltiplas entradas com Python.
- Requisitos de citação MLA para documentos PDF
- Formatar rapidamente uma citação PDF em MLA com o Microsoft Word
- Formatar múltiplas citações PDF em MLA com Python
- Obter informações de citação MLA com o Google Scholar ou MyBib
- Perguntas frequentes
Requisitos de citação MLA para documentos PDF
O MLA não utiliza um formato de citação fixo para todos os PDFs. Em vez disso, cite a obra de acordo com seu tipo e inclua as informações relevantes de publicação e acesso.
Dependendo da fonte, uma citação MLA pode incluir:
- Autor
- Título
- Contêiner, como um periódico, site ou banco de dados
- Editora
- Data de publicação
- Intervalo de páginas, quando aplicável
- DOI ou URL, quando aplicável
A nona edição do Manual MLA, publicado em 2021, fornece as diretrizes atuais de documentação MLA.
Exemplos de citação de PDF em MLA
- Para um livro independente disponível como PDF, a citação pode seguir o formato padrão de livro:
Chomsky, Noam. Media Control: The Spectacular Achievements of Propaganda. Seven Stories Press, 1997.
- Para um artigo de periódico disponível como PDF:
Rawls, John. “Kantian Constructivism in Moral Theory.” The Journal of Philosophy, vol. 77, no. 9, 1980, pp. 515–572.
Um PDF baixado de um site pode exigir informações adicionais sobre o site ou a versão do PDF. O MLA permite a descrição download de PDF quando isso ajuda a esclarecer o formato da fonte.
Portanto, a citação exata deve ser verificada com a fonte original antes de formatar a entrada final na lista de Obras Citadas.
Como formatar rapidamente uma citação PDF em MLA com o Microsoft Word
Após preparar sua citação, você pode usar o Microsoft Word para aplicar a formatação exigida para uma lista de Obras Citadas. O MLA recomenda um recuo deslocado (hanging indent) de 0,5 polegada (aprox. 1,27 cm) e espaçamento duplo.
Siga estes passos:
- Passo 1: Selecione as entradas de citação na sua lista de Obras Citadas.
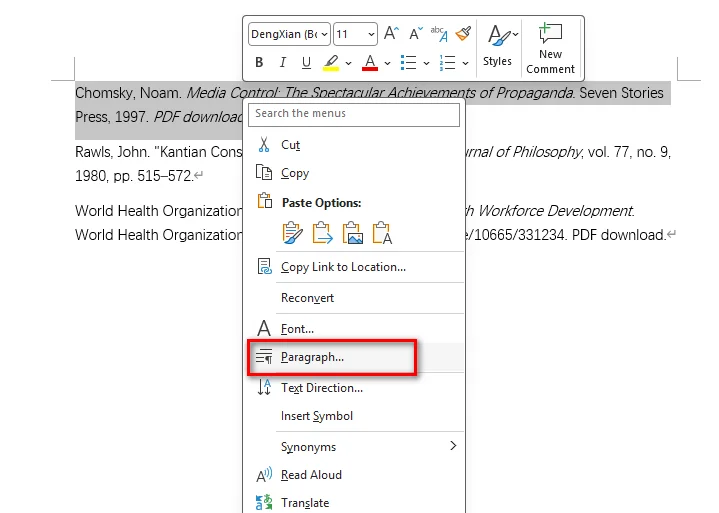
- Passo 2: Clique com o botão direito na seleção e escolha Parágrafo.
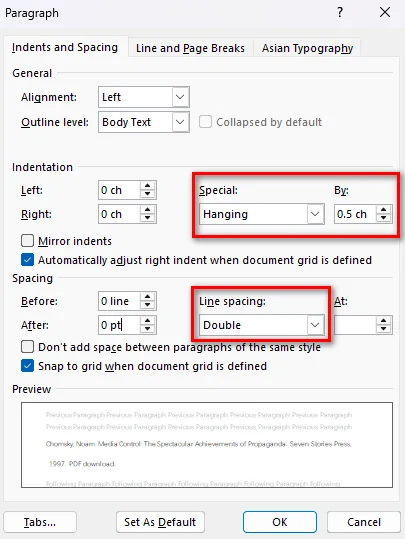
- Passo 3: Em Recuo, defina Especial como Deslocado e Por como 1,27 cm (ou 0,5 polegada). Em Espaçamento, defina Antes e Depois como 0 pt, defina Espaçamento entre linhas como Duplo e clique em OK.
Você também pode pressionar Ctrl + T no Windows ou Command + T no Mac para aplicar um recuo deslocado rapidamente.
Evite usar espaços, tabulações ou quebras de linha manuais para criar o recuo. A formatação de parágrafo mantém as entradas alinhadas quando você edita o texto da citação.
Nota: Se você também precisar colocar o PDF original em um documento do Word, consulte Como inserir um PDF no Word para métodos de inserir conteúdo PDF preservando seu layout e editabilidade.
Como formatar múltiplas citações PDF em MLA com Python
O Microsoft Word é conveniente quando você só precisa formatar algumas citações. Para aplicações que geram relatórios, processam documentos enviados por usuários ou criam grandes listas de Obras Citadas, formatar entradas de citação programaticamente pode ser mais eficiente.
Free Spire.Doc for Python é uma biblioteca Python independente para criar, editar, formatar e converter documentos Word sem a necessidade do Microsoft Word. Ela fornece propriedades de formatação de parágrafo que podem ser usadas para criar o recuo deslocado exigido para citações MLA.
Você pode combinar LeftIndent com um FirstLineIndent negativo. Para um recuo deslocado de 0,5 polegada, defina ambos os valores como 36 pontos em direções opostas.
O exemplo a seguir cria múltiplas entradas de citação MLA e aplica a formatação necessária automaticamente:
from spire.doc import *
from spire.doc.common import *

# Criar um documento e uma seção
doc = Document()
section = doc.AddSection()

# Exemplos de entradas de citação MLA
citations = [
    "Chomsky, Noam. Media Control: The Spectacular Achievements of Propaganda. Seven Stories Press, 1997.",
    'Rawls, John. "Kantian Constructivism in Moral Theory." The Journal of Philosophy, vol. 77, no. 9, 1980, pp. 515–572.'
]

# Adicionar e formatar cada citação
for citation in citations:
    paragraph = section.AddParagraph()
    paragraph.AppendText(citation)

    # Aplicar um recuo deslocado de 0,5 polegada
    paragraph.Format.LeftIndent = 36.0
    paragraph.Format.FirstLineIndent = -36.0

    # Aplicar espaçamento duplo e remover espaçamento entre parágrafos
    paragraph.Format.LineSpacingRule = LineSpacingRule.Multiple
    paragraph.Format.LineSpacing = 24.0
    paragraph.Format.BeforeSpacing = 0.0
    paragraph.Format.AfterSpacing = 0.0

# Salvar o documento
doc.SaveToFile("MLA_PDF_Citations.docx", FileFormat.Docx2013)
doc.Close()

No exemplo, LeftIndent = 36.0 move o conteúdo do parágrafo 0,5 polegada para a direita, enquanto FirstLineIndent = -36.0 move a primeira linha de volta para a margem esquerda. Juntos, eles criam um recuo deslocado.
O código também define BeforeSpacing e AfterSpacing como 0.0 e usa LineSpacingRule.Multiple com LineSpacing = 24.0 para produzir espaçamento duplo nesta configuração do Free Spire.Doc.
Esta abordagem é útil quando você já possui strings de citação e precisa gerar um documento Word formatado de forma consistente a partir de muitas entradas.
Obter informações de citação MLA com o Google Scholar ou MyBib
Se você precisar de ajuda para coletar informações de citação, ferramentas como o Google Scholar e o MyBib podem fornecer um ponto de partida útil.
O Google Scholar oferece uma opção Citar para muitos resultados de pesquisa, enquanto o MyBib pode gerar citações no estilo MLA a partir de informações de fonte disponíveis.
No entanto, as citações geradas ainda devem ser verificadas com a fonte original. Uma ferramenta de citação nem sempre pode identificar corretamente o tipo de fonte, detalhes de publicação ou método de acesso ao PDF.
Um fluxo de trabalho prático é:
- Identificar o tipo de obra contida no PDF.
- Coletar as informações de publicação necessárias.
- Gerar ou preparar a citação MLA.
- Verificar a citação com a fonte original.
- Formatar as entradas concluídas manualmente no Word ou automaticamente com Python.
Perguntas frequentes
Preciso adicionar "download de PDF" a todas as citações MLA?
Não. Download de PDF não é necessário para todas as citações de PDF. Pode ser usado como uma descrição quando você deseja esclarecer que consultou uma versão em PDF da fonte.
O MLA usa o mesmo formato para todos os PDFs?
Não. A citação depende do tipo de obra e de como você a acessou. Um livro, um artigo de periódico e um relatório baixados de um site podem exigir informações de citação diferentes.
Como formato uma citação de PDF em uma lista de Obras Citadas MLA?
Use um recuo deslocado de 0,5 polegada e espaçamento duplo para as entradas de citação. No Microsoft Word, você pode aplicar a formatação através das configurações de Parágrafo ou usar Ctrl + T no Windows.
Posso formatar múltiplas citações de PDF em MLA com Python?
Sim. Se o texto da citação já estiver preparado, o Free Spire.Doc for Python pode criar documentos Word e aplicar formatação de parágrafo consistente a múltiplas entradas de citação. Propriedades como LeftIndent e FirstLineIndent podem ser combinadas para criar um recuo deslocado.
Conclusão
Citar um PDF em MLA torna-se mais fácil quando você separa o processo em duas partes: preparar a citação com base na fonte e formatar a entrada final corretamente. Para algumas citações, o Microsoft Word oferece uma maneira rápida de aplicar o recuo deslocado e o espaçamento duplo necessários. Quando você precisa formatar muitas entradas de forma consistente, o Free Spire.Doc for Python pode automatizar o processo e gerar um documento Word pronto para uso.
Leia também:
MLA 형식으로 PDF 인용하는 방법: 단계별 가이드
MLA 형식으로 PDF를 인용할 때는 단순히 참조에 “PDF”라는 단어를 추가하는 것 이상의 작업이 필요합니다. 인용 형식은 해당 PDF에 무엇이 포함되어 있는지(예: 도서, 저널 기사, 보고서 등)와 어디에서 액세스했는지에 따라 달라집니다. 인용문이 준비되면 '인용 문헌(Works Cited)' 목록에 올바르게 서식을 지정해야 합니다.
이 가이드에서는 MLA 형식으로 PDF를 인용하는 방법, Microsoft Word에서 인용 서식을 지정하는 방법, 그리고 Python을 사용하여 여러 항목의 서식 지정을 자동화하는 방법을 설명합니다.
- PDF 문서에 대한 MLA 인용 요구 사항
- Microsoft Word를 사용하여 MLA PDF 인용 서식 빠르게 지정하기
- Python으로 여러 MLA PDF 인용 서식 지정하기
- Google Scholar 또는 MyBib을 사용하여 MLA 인용 정보 가져오기
- 자주 묻는 질문(FAQs)
PDF 문서에 대한 MLA 인용 요구 사항
MLA는 모든 PDF에 대해 하나의 고정된 인용 형식을 사용하지 않습니다. 대신, 자료의 유형에 따라 인용하고 관련 출판 및 액세스 정보를 포함해야 합니다.
출처에 따라 MLA 인용에는 다음이 포함될 수 있습니다:
- 저자
- 제목
- 컨테이너(저널, 웹사이트, 데이터베이스 등)
- 출판사
- 출판 날짜
- 페이지 범위(해당되는 경우)
- DOI 또는 URL(해당되는 경우)
2021년에 출판된 MLA 핸드북(MLA Handbook) 제9판은 현재의 MLA 문서 작성 지침을 제공합니다.
MLA PDF 인용 예시
- PDF로 제공되는 단행본의 경우, 표준 도서 형식을 따를 수 있습니다:
Chomsky, Noam. Media Control: The Spectacular Achievements of Propaganda. Seven Stories Press, 1997.
- PDF로 제공되는 저널 기사의 경우:
Rawls, John. “Kantian Constructivism in Moral Theory.” The Journal of Philosophy, vol. 77, no. 9, 1980, pp. 515–572.
웹사이트에서 다운로드한 PDF는 웹사이트나 PDF 버전에 대한 추가 정보가 필요할 수 있습니다. MLA는 출처의 형식을 명확히 하는 데 도움이 되는 경우 PDF download라는 설명을 허용합니다.
따라서 최종 '인용 문헌' 항목의 서식을 지정하기 전에 정확한 인용 내용을 원본 출처와 대조하여 확인해야 합니다.
Microsoft Word를 사용하여 MLA PDF 인용 서식 빠르게 지정하기
인용문을 준비한 후 Microsoft Word를 사용하여 '인용 문헌' 목록에 필요한 서식을 적용할 수 있습니다. MLA는 0.5인치 내어쓰기(hanging indent)와 줄 간격 2줄(double spacing)을 권장합니다.
다음 단계를 따르세요:
- 1단계: '인용 문헌' 목록에서 인용 항목을 선택합니다.
- 2단계: 선택 영역을 마우스 오른쪽 버튼으로 클릭하고 단락(Paragraph)을 선택합니다.
- 3단계: 들여쓰기(Indentation) 아래의 특수(Special)를 내어쓰기(Hanging)로 설정하고 크기(By)를 0.5인치로 설정합니다. 또한 간격(Spacing) 아래에서 단락 앞(Before)과 단락 뒤(After)를 0 pt로, 줄 간격(Line spacing)을 2줄(Double)로 설정한 후 확인을 클릭합니다.
Windows에서는 Ctrl + T를, Mac에서는 Command + T를 눌러 내어쓰기를 빠르게 적용할 수도 있습니다.
스페이스바, 탭, 또는 수동 줄 바꿈을 사용하여 들여쓰기를 만들지 마십시오. 단락 서식을 사용해야 인용 텍스트를 편집할 때 항목이 정렬된 상태로 유지됩니다.
참고: 원본 PDF를 Word 문서에 배치해야 하는 경우, 레이아웃과 편집 가능성을 유지하면서 PDF 콘텐츠를 삽입하는 방법은 Word에 PDF를 삽입하는 방법을 참조하십시오.
Python으로 여러 MLA PDF 인용 서식 지정하기
Microsoft Word는 몇 개의 인용문만 서식을 지정할 때 편리합니다. 보고서를 생성하거나, 사용자가 제출한 문서를 처리하거나, 긴 '인용 문헌' 목록을 작성하는 애플리케이션의 경우, 프로그래밍 방식으로 인용 항목의 서식을 지정하는 것이 더 효율적일 수 있습니다.
Free Spire.Doc for Python은 Microsoft Word 없이도 Word 문서를 생성, 편집, 서식 지정 및 변환할 수 있는 독립형 Python 라이브러리입니다. 이 라이브러리는 MLA 인용에 필요한 내어쓰기를 생성하는 데 사용할 수 있는 단락 서식 속성을 제공합니다.
LeftIndent(왼쪽 들여쓰기)와 음수 값의 FirstLineIndent(첫 줄 들여쓰기)를 결합할 수 있습니다. 0.5인치 내어쓰기를 하려면 두 값을 반대 방향으로 36포인트로 설정하십시오.
다음 예제는 여러 MLA 인용 항목을 생성하고 필요한 서식을 자동으로 적용합니다:
from spire.doc import *
from spire.doc.common import *

# 문서 및 섹션 생성
doc = Document()
section = doc.AddSection()

# 샘플 MLA 인용 항목
citations = [
    "Chomsky, Noam. Media Control: The Spectacular Achievements of Propaganda. Seven Stories Press, 1997.",
    'Rawls, John. "Kantian Constructivism in Moral Theory." The Journal of Philosophy, vol. 77, no. 9, 1980, pp. 515–572.'
]

# 각 인용문 추가 및 서식 지정
for citation in citations:
    paragraph = section.AddParagraph()
    paragraph.AppendText(citation)

    # 0.5인치 내어쓰기 적용
    paragraph.Format.LeftIndent = 36.0
    paragraph.Format.FirstLineIndent = -36.0

    # 줄 간격 2줄 적용 및 단락 간격 제거
    paragraph.Format.LineSpacingRule = LineSpacingRule.Multiple
    paragraph.Format.LineSpacing = 24.0
    paragraph.Format.BeforeSpacing = 0.0
    paragraph.Format.AfterSpacing = 0.0

# 문서 저장
doc.SaveToFile("MLA_PDF_Citations.docx", FileFormat.Docx2013)
doc.Close()
예제에서 LeftIndent = 36.0은 단락 내용을 오른쪽으로 0.5인치 이동시키고, FirstLineIndent = -36.0은 첫 번째 줄을 왼쪽 여백으로 다시 이동시킵니다. 이 둘을 결합하여 내어쓰기가 생성됩니다.
또한 이 코드는 BeforeSpacing과 AfterSpacing을 0.0으로 설정하고, Free Spire.Doc 구성에서 줄 간격 2줄을 만들기 위해 LineSpacingRule.Multiple과 LineSpacing = 24.0을 사용합니다.
이 접근 방식은 이미 인용문 문자열을 가지고 있고 많은 항목으로부터 일관된 서식의 Word 문서를 생성해야 할 때 유용합니다.
Google Scholar 또는 MyBib을 사용하여 MLA 인용 정보 가져오기
인용 정보를 수집하는 데 도움이 필요하다면 Google Scholar나 MyBib과 같은 도구가 유용한 출발점이 될 수 있습니다.
Google Scholar는 많은 검색 결과에 대해 인용(Cite) 옵션을 제공하며, MyBib은 사용 가능한 출처 정보를 바탕으로 MLA 스타일 인용문을 생성할 수 있습니다.
단, 생성된 인용문은 반드시 원본 출처와 대조하여 확인해야 합니다. 인용 도구가 항상 출처 유형, 출판 세부 정보 또는 PDF 액세스 방식을 정확하게 식별하지 못할 수도 있기 때문입니다.
실용적인 워크플로우는 다음과 같습니다:
- PDF에 포함된 자료의 유형을 식별합니다.
- 필요한 출판 정보를 수집합니다.
- MLA 인용문을 생성하거나 준비합니다.
- 원본 출처와 인용문을 대조하여 확인합니다.
- Word에서 수동으로 또는 Python을 사용하여 자동으로 완성된 항목의 서식을 지정합니다.
자주 묻는 질문(FAQs)
모든 MLA 인용에 “PDF download”를 추가해야 하나요?
아니요. 모든 PDF 인용에 PDF download가 필요한 것은 아닙니다. 출처의 PDF 버전을 참조했음을 명확히 하고 싶을 때 설명으로 사용할 수 있습니다.
MLA는 모든 PDF에 대해 동일한 형식을 사용하나요?
아니요. 인용 형식은 자료의 유형과 액세스 방식에 따라 달라집니다. 웹사이트에서 다운로드한 도서, 저널 기사, 보고서는 각각 다른 인용 정보가 필요할 수 있습니다.
MLA '인용 문헌' 목록에서 PDF 인용 서식은 어떻게 지정하나요?
인용 항목에 0.5인치 내어쓰기와 줄 간격 2줄을 사용하십시오. Microsoft Word에서는 단락 설정을 통해 서식을 적용하거나 Windows에서 Ctrl + T를 사용할 수 있습니다.
Python으로 여러 MLA PDF 인용 서식을 지정할 수 있나요?
네. 인용 텍스트가 이미 준비되어 있다면, Free Spire.Doc for Python을 사용하여 Word 문서를 생성하고 여러 인용 항목에 일관된 단락 서식을 적용할 수 있습니다. LeftIndent와 FirstLineIndent와 같은 속성을 결합하여 내어쓰기를 만들 수 있습니다.
결론
MLA 형식으로 PDF를 인용하는 것은 출처를 바탕으로 인용문을 준비하는 과정과 완성된 항목의 서식을 올바르게 지정하는 과정으로 나누면 더 쉬워집니다. 인용문이 몇 개 안 될 때는 Microsoft Word가 필요한 내어쓰기와 줄 간격 2줄을 빠르게 적용할 수 있는 방법을 제공합니다. 많은 항목의 서식을 일관되게 지정해야 할 때는 Free Spire.Doc for Python을 사용하여 과정을 자동화하고 바로 사용할 수 있는 Word 문서를 생성할 수 있습니다.
추천 읽기:
Come citare un PDF in formato MLA: guida passo dopo passo
Indice
Citare un PDF in formato MLA richiede qualcosa di più della semplice aggiunta della dicitura "PDF" a un riferimento. Il formato della citazione dipende dal contenuto del PDF, come un libro, un articolo di rivista o un rapporto, e da dove è stato consultato. Una volta preparata la citazione, questa deve essere formattata correttamente nell'elenco delle opere citate (Works Cited).
Questa guida spiega come citare un PDF in formato MLA, come formattare la citazione in Microsoft Word e come automatizzare la formattazione di più voci con Python.
- Requisiti di citazione MLA per documenti PDF
- Formattare rapidamente una citazione PDF in MLA con Microsoft Word
- Formattare più citazioni PDF MLA con Python
- Ottenere informazioni di citazione MLA con Google Scholar o MyBib
- Domande frequenti (FAQ)
Requisiti di citazione MLA per documenti PDF
MLA non utilizza un formato di citazione fisso per ogni PDF. Al contrario, cita l'opera in base al suo tipo e includi le informazioni pertinenti sulla pubblicazione e sull'accesso.
A seconda della fonte, una citazione MLA può includere:
- Autore
- Titolo
- Contenitore, come una rivista, un sito web o un database
- Editore
- Data di pubblicazione
- Intervallo di pagine, ove applicabile
- DOI o URL, ove applicabile
La nona edizione del Manuale MLA, pubblicato nel 2021, fornisce le attuali linee guida per la documentazione MLA.
Esempi di citazione PDF MLA
- Per un libro autonomo disponibile come PDF, la citazione può seguire il formato standard del libro:
Chomsky, Noam. Media Control: The Spectacular Achievements of Propaganda. Seven Stories Press, 1997.
- Per un articolo di rivista disponibile come PDF:
Rawls, John. “Kantian Constructivism in Moral Theory.” The Journal of Philosophy, vol. 77, no. 9, 1980, pp. 515–572.
Un PDF scaricato da un sito web potrebbe richiedere informazioni aggiuntive sul sito o sulla versione del PDF. MLA consente la descrizione PDF download quando aiuta a chiarire il formato della fonte.
La citazione esatta dovrebbe quindi essere verificata rispetto alla fonte originale prima di formattare la voce finale nell'elenco delle opere citate.
Come formattare rapidamente una citazione PDF in MLA con Microsoft Word
Dopo aver preparato la citazione, puoi utilizzare Microsoft Word per applicare la formattazione richiesta per l'elenco delle opere citate. MLA raccomanda un rientro sporgente di 0,5 pollici (circa 1,27 cm) e un'interlinea doppia.
Segui questi passaggi:
- Passaggio 1: Seleziona le voci della citazione nell'elenco delle opere citate.
- Passaggio 2: Fai clic con il tasto destro sulla selezione e scegli Paragrafo.
- Passaggio 3: Sotto Rientro, imposta Speciale su Sporgente e Di su 1,27 cm (o 0,5 pollici). Sotto Spaziatura, imposta Prima e Dopo su 0 pt, imposta Interlinea su Doppia e fai clic su OK.
Puoi anche premere Ctrl + T su Windows o Command + T su Mac per applicare rapidamente un rientro sporgente.
Evita di usare spazi, tabulazioni o interruzioni di riga manuali per creare il rientro. La formattazione del paragrafo mantiene le voci allineate quando modifichi il testo della citazione.
Nota: Se hai anche bisogno di inserire il PDF originale in un documento Word, consulta Come inserire un PDF in Word per i metodi di inserimento del contenuto PDF preservandone layout e modificabilità.
Come formattare più citazioni PDF MLA con Python
Microsoft Word è comodo quando devi formattare solo poche citazioni. Per applicazioni che generano report, elaborano documenti inviati dagli utenti o creano lunghi elenchi di opere citate, formattare le voci di citazione a livello di programmazione può essere più efficiente.
Free Spire.Doc for Python è una libreria Python indipendente per creare, modificare, formattare e convertire documenti Word senza richiedere Microsoft Word. Fornisce proprietà di formattazione del paragrafo che possono essere utilizzate per creare il rientro sporgente richiesto per le citazioni MLA.
Puoi combinare LeftIndent con un FirstLineIndent negativo. Per un rientro sporgente di 0,5 pollici, imposta entrambi i valori a 36 punti in direzioni opposte.
L'esempio seguente crea più voci di citazione MLA e applica automaticamente la formattazione richiesta:
from spire.doc import *
from spire.doc.common import *

# Crea un documento e una sezione
doc = Document()
section = doc.AddSection()

# Esempi di voci di citazione MLA
citations = [
    "Chomsky, Noam. Media Control: The Spectacular Achievements of Propaganda. Seven Stories Press, 1997.",
    'Rawls, John. "Kantian Constructivism in Moral Theory." The Journal of Philosophy, vol. 77, no. 9, 1980, pp. 515–572.'
]

# Aggiungi e formatta ogni citazione
for citation in citations:
    paragraph = section.AddParagraph()
    paragraph.AppendText(citation)

    # Applica un rientro sporgente di 0,5 pollici (36 punti)
    paragraph.Format.LeftIndent = 36.0
    paragraph.Format.FirstLineIndent = -36.0

    # Applica interlinea doppia e rimuovi la spaziatura tra paragrafi
    paragraph.Format.LineSpacingRule = LineSpacingRule.Multiple
    paragraph.Format.LineSpacing = 24.0
    paragraph.Format.BeforeSpacing = 0.0
    paragraph.Format.AfterSpacing = 0.0

# Salva il documento
doc.SaveToFile("MLA_PDF_Citations.docx", FileFormat.Docx2013)
doc.Close()
Nell'esempio, LeftIndent = 36.0 sposta il contenuto del paragrafo di 0,5 pollici verso destra, mentre FirstLineIndent = -36.0 sposta la prima riga indietro verso il margine sinistro. Insieme, creano un rientro sporgente.
Il codice imposta anche BeforeSpacing e AfterSpacing su 0.0 e utilizza LineSpacingRule.Multiple con LineSpacing = 24.0 per produrre un'interlinea doppia in questa configurazione di Free Spire.Doc.
Questo approccio è utile quando hai già le stringhe di citazione e devi generare un documento Word formattato in modo coerente a partire da molte voci.
Ottenere informazioni di citazione MLA con Google Scholar o MyBib
Se hai bisogno di aiuto per raccogliere informazioni sulle citazioni, strumenti come Google Scholar e MyBib possono fornire un utile punto di partenza.
Google Scholar fornisce un'opzione Cita per molti risultati di ricerca, mentre MyBib può generare citazioni in stile MLA dalle informazioni sulla fonte disponibili.
Tuttavia, le citazioni generate dovrebbero sempre essere verificate rispetto alla fonte originale. Uno strumento di citazione potrebbe non identificare sempre correttamente il tipo di fonte, i dettagli di pubblicazione o il metodo di accesso al PDF.
Un flusso di lavoro pratico è:
- Identificare il tipo di opera contenuta nel PDF.
- Raccogliere le informazioni di pubblicazione richieste.
- Generare o preparare la citazione MLA.
- Verificare la citazione rispetto alla fonte originale.
- Formattare le voci completate manualmente in Word o automaticamente con Python.
Domande frequenti (FAQ)
Devo aggiungere "PDF download" a ogni citazione MLA?
No. PDF download non è richiesto per ogni citazione di un PDF. Può essere usato come descrizione quando vuoi chiarire che hai consultato una versione PDF della fonte.
MLA usa lo stesso formato per ogni PDF?
No. La citazione dipende dal tipo di opera e da come l'hai consultata. Un libro, un articolo di rivista e un rapporto scaricati da un sito web possono richiedere informazioni di citazione diverse.
Come formatto una citazione PDF in un elenco di opere citate MLA?
Usa un rientro sporgente di 0,5 pollici e un'interlinea doppia per le voci di citazione. In Microsoft Word, puoi applicare la formattazione tramite le impostazioni di Paragrafo o usare Ctrl + T su Windows.
Posso formattare più citazioni PDF MLA con Python?
Sì. Se il testo della citazione è già pronto, Free Spire.Doc for Python può creare documenti Word e applicare una formattazione del paragrafo coerente a più voci di citazione. Proprietà come LeftIndent e FirstLineIndent possono essere combinate per creare un rientro sporgente.
Conclusione
Citare un PDF in formato MLA diventa più semplice quando separi il processo in due parti: preparare la citazione in base alla fonte e formattare correttamente la voce finale. Per poche citazioni, Microsoft Word fornisce un modo rapido per applicare il rientro sporgente e l'interlinea doppia richiesti. Quando devi formattare molte voci in modo coerente, Free Spire.Doc for Python può automatizzare il processo e generare un documento Word pronto all'uso.