Importing CSV/PDF Data into Excel with Spire.Agent.Office
In cross-industry data processing scenarios, importing data from CSV and PDF files into Excel is one of the most common and error-prone tasks — finance teams reconcile CSV bank statements, e-commerce teams organize order files exported from multiple platforms, and administrative staff handle PDF statements from suppliers. These files come in all shapes and formats: inconsistent CSV delimiters, fields containing commas, dates appearing in various forms, phone numbers and ID numbers that start with 0 are treated as numbers and lose their leading zeros; PDF tables cannot be edited directly, and copying them into Excel misaligns rows, columns, and merged cells.
The traditional approach is to split columns manually, set formats column by column, and hunt for erroneous cells by eye. A CSV file with a few hundred rows often takes half an hour of repeated adjustment; PDF tables can only be copied and pasted row by row. Traditional methods are also prone to misaligned columns, misplaced dates, and numbers turning into text. As data volume grows, manual processing becomes nearly impossible.
Take a finance team reconciling bank statements, for example: after receiving a CSV, the usual routine is to confirm the encoding in a text editor first, split the columns in Excel, set date and amount formats column by column, and then hunt for anomalous values by eye. A field containing a comma shifts the whole row, accounts starting with 0 lose their leading zeros, and only after repeated adjustment does the table become usable. PDF statements can only be copied and pasted row by row — rows, columns, and merged cells are almost all misaligned, and reconstructing a single statement often eats up half a day.
Comparison with Traditional SDK API Processing
| Traditional Spire.Office for .NET API | Spire.Agent.Office Processing | |
|---|---|---|
| Driving Method | Write code for column splitting, type conversion, and format checking, controlling every step | Describe the goal in natural language; the AI understands and automatically orchestrates the execution path |
| Code Volume | Data import scenarios typically require 500-1000 lines of C# code (including parsers, type conversion, error detection, etc.) | About 10 lines of calling code + one natural language instruction |
| Delimiters & Quoting | Must hand-write parsing logic for edge cases such as commas inside quotes and escape characters | The AI automatically recognizes delimiters and quoted fields and splits columns intelligently |
| Type Detection | Must hard-code date/number/text recognition rules per column; changing rules requires code changes | The AI understands data type semantics and automatically recognizes dates, numbers, and text |
| Error Detection | Must write regex and conditional checks cell by cell; coverage of error types is incomplete | The AI automatically detects anomalies such as type mismatches and column count mismatches and highlights them in red |
| Requirement Changes | Adding a new CSV variant requires modifying code → compiling → deploying | Modify the description in the instruction; takes effect immediately |
This article introduces how to use the Excel AI capabilities of Spire.Agent.Office to implement CSV smart column splitting import and PDF table import, automatically completing data type detection and highlighting erroneous formats in red, with just a single natural language instruction.
For product installation and SpireToken configuration, please refer to Integrating Spire.Agent.Office in a .NET Project. The following examples assume Spire.Agent.Office is already installed and SpireToken is configured.
CSV Smart Column Splitting Import
CSV is the most common format for data exchange, yet also the least "controllable": the delimiter may be a comma, a tab, or a semicolon; fields may contain commas or line breaks wrapped in quotes; dates, numbers, and text are mixed in the same table; values starting with 0, such as phone numbers and codes, are treated as numbers by default and lose their leading zeros. Import quality directly determines the accuracy of subsequent analysis and reports.
The following example uses the Spire.Agent.Office agent to automatically import a CSV through natural language instructions, completing smart column splitting, data type detection, and highlighting erroneous formats in red:
using Spire.Agent.Office.AI;
using Spire.Agent.Office.Extensions;
using Spire.Xls;

// CSV source file to be imported (passed as an attachment)
string[] attachmentPaths = new string[] { @"C:\DataImport\employee_sales_data.csv" };
// Save path of the import result document
string savePath = @"C:\DataImport\ToXLSX.xlsx";
// SpireToken Key (apply on the official website)
string key = "sk-TF***************************r";
// Natural language instruction
string instruction = "Process as follows:\n" +
    "1. Convert the attached CSV file to an Excel document and apply appropriate formatting to improve readability\n" +
    "2. Unify the formats of dates/sales amounts/phone numbers in the file\n" +
    "3. Mark erroneous and missing data with a red background";

// AI generation
AIResult result = ImportCsvData(instruction, savePath, key, attachmentPaths);

// AI-assisted CSV import
static AIResult ImportCsvData(string instruction, string savePath, string key, string[] attachmentPaths)
{
    // Configure the AI processing options
    AIOptions options = new AIOptions();
    options.SpireToken = key;

    using (Workbook wb = new Workbook())
    {
        AIDocumentProcessor processor = wb.AI(options);
        return processor.ExecuteInstruction(wb, instruction, savePath, attachmentPaths);
    }
}
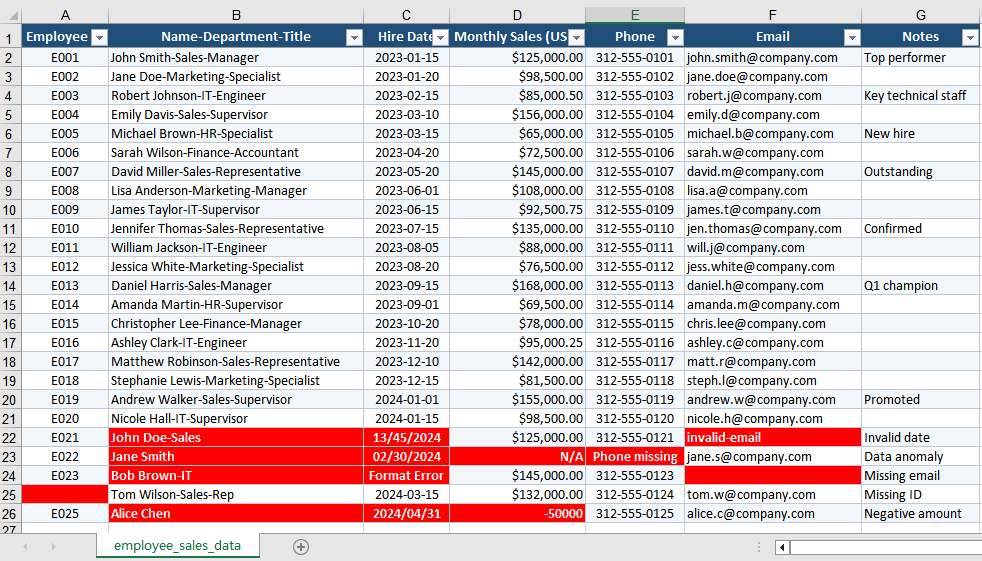
Original CSV data and smart column splitting import result 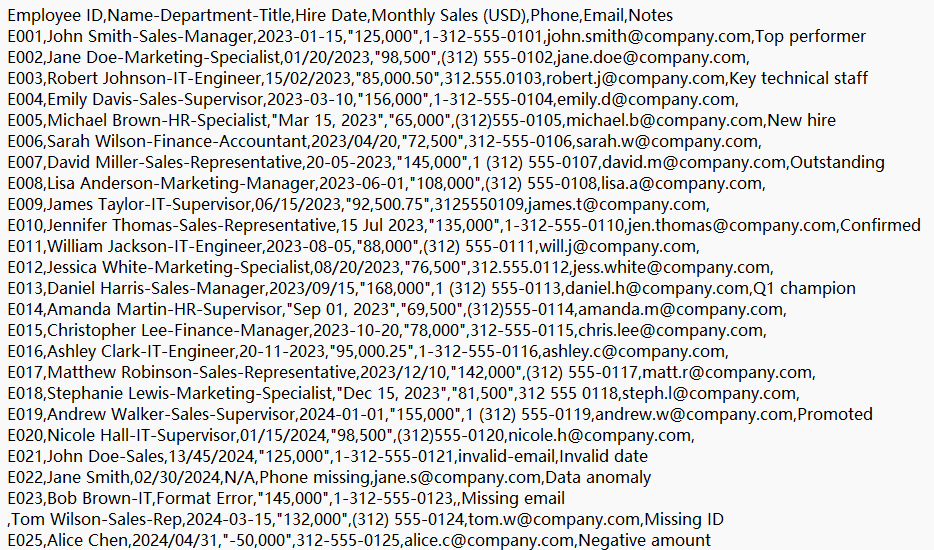
PDF Table Import to Excel
PDF is the universal format for distribution and archiving, but the table data inside it cannot be edited directly: copying it into Excel misaligns rows and columns, loses merged cells, and turns numbers and dates into text. When suppliers, banks, or government agencies deliver reports in PDF, accurately restoring the table data into editable Excel is an essential step in moving from fixed-layout documents to electronic processing.
The following example uses the Spire.Agent.Office agent to automatically extract table data from a PDF and write it into Excel through natural language instructions:
using Spire.Agent.Office.AI;
using Spire.Agent.Office.Extensions;
using Spire.Xls;

// PDF source file to be imported (passed as an attachment)
string[] attachmentPaths = new string[] { @"C:\DataImport\PurchaseOrder.pdf" };

// Save path of the import result document
string savePath = @"C:\DataImport\PurchaseOrderData.xlsx";
// SpireToken Key
string key = "sk-TF***************************r";
// Natural language instruction
string instruction =
    "Process as follows:\n" +
    "1. Convert the attached PDF file to an Excel document and apply appropriate formatting to improve readability\n" +
    "2. Unify the formats of dates/sales amounts/phone numbers in the file\n" +
    "3. Mark erroneous and missing data with a red background";
// AI generation
AIResult result = ImportPdfData(instruction, savePath, key, attachmentPaths);

// AI-assisted PDF import
static AIResult ImportPdfData(string instruction, string savePath, string key, string[] attachmentPaths)
{
    // Configure the AI processing options
    AIOptions options = new AIOptions();
    options.SpireToken = key;

    using (Workbook wb = new Workbook())
    {
        AIDocumentProcessor processor = wb.AI(options);
        return processor.ExecuteInstruction(wb, instruction, savePath, attachmentPaths);
    }
}
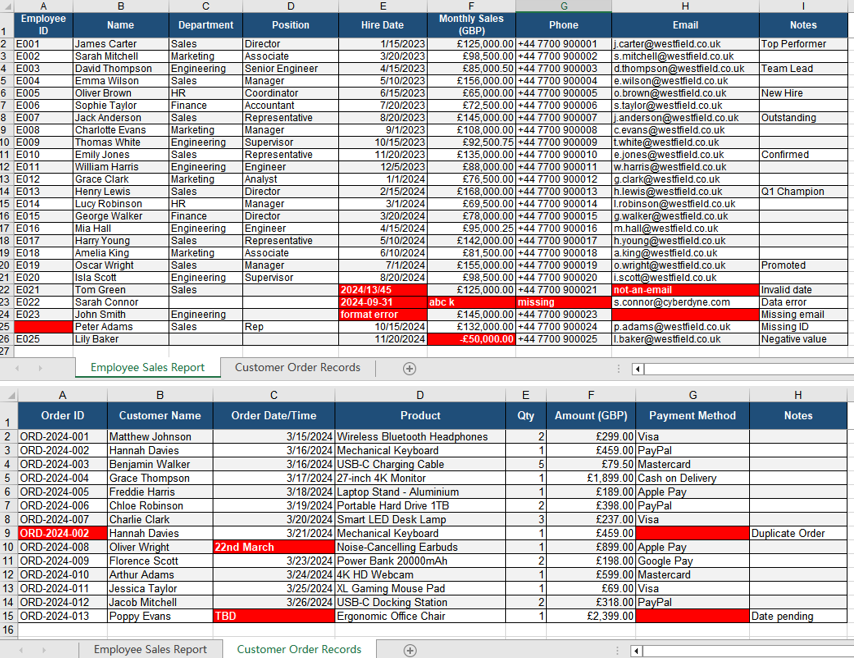
Original PDF data and table data extracted into Excel 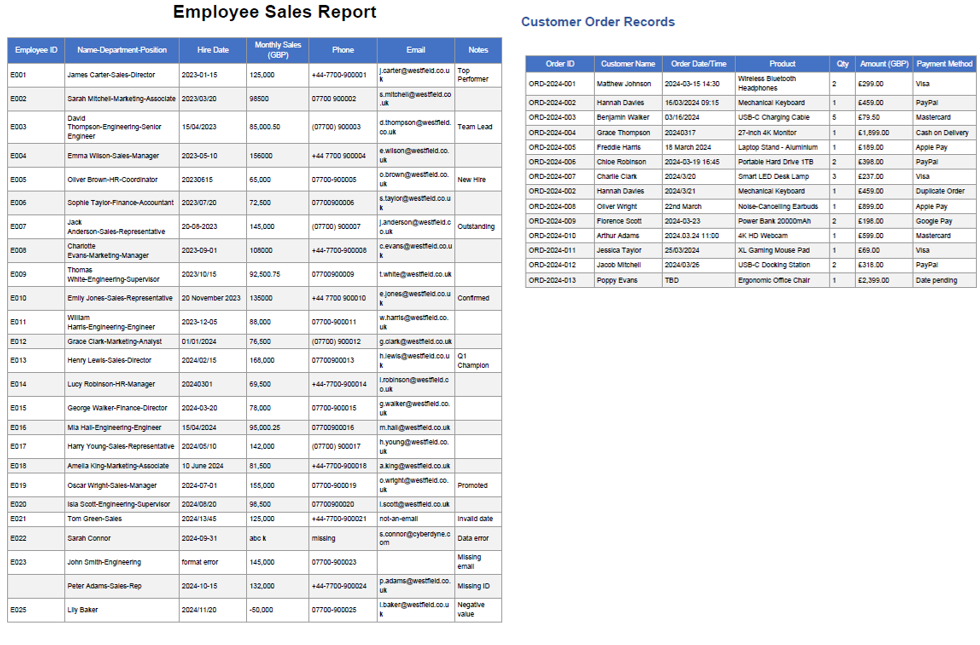
Frequently Asked Questions
Inconsistent CSV delimiters / commas within fields cause column misalignment
Cause: The CSV delimiter may be a semicolon or a tab, or a field may contain a quoted comma or newline, which causes the whole row to shift when columns are split automatically.
Solution: Specify the delimiter in the instruction, or let the AI identify it automatically and correctly handle the quoted fields.
Numbers starting with 0 lose their leading zeros
Cause: Values starting with 0, such as phone numbers, ID numbers, and account numbers, are imported as numeric values, and the leading zeros are dropped.
Solution: Specify the relevant columns as text type in the instruction, such as "set the phone number and ID number columns to text format and preserve the leading zeros".
Obtaining a SpireToken Key
- Contact sales@e-iceblue.com or visit https://www.e-iceblue.com/TemLicense.html to obtain a trial/commercial API key
Configure it in code:
AIOptions options = new AIOptions();
options.SpireToken = key;
Automatically Extract Invoice Information with Spire.Agent.Office
In finance and tax scenarios, invoice data entry is one of the most common and time-consuming tasks. The invoice number, date, amount, tax amount and buyer on every invoice must be manually checked and entered into Excel or a financial system one by one. During mid-month reconciliation, month-end tax filing or reimbursement peak periods, the backlog of invoices often numbers in the hundreds, and manual entry speed becomes the bottleneck. The traditional approach is to open each invoice PDF page by page, find the corresponding fields, copy and paste — which is not only inefficient but also highly prone to omissions, misalignments and mistyped amounts. Any single error directly affects the accuracy of reconciliation and tax filing. Invoice layouts also vary widely, with fields in all sorts of positions, further increasing the risk of errors in manual processing. Automating the repetitive work of "reading each invoice and copying its fields" is therefore one of the pain points financial teams most urgently want to solve.
Traditional SDK API vs. Spire.Agent.Office
For "extracting fields from a PDF invoice and exporting to Excel", the traditional SDK and Spire.Agent.Office take two completely different paths. With the traditional approach, you must first figure out the field positions and page structure of every invoice, then write locating and extraction code for each field — change the layout and you must change the code. With the agent approach, you only need to describe in natural language "what to extract and what to export as"; the AI understands and orchestrates the rest:
| Traditional Spire.Office for .NET API | Spire.Agent.Office | |
|---|---|---|
| Driving approach | Write loops + conditionals + exception-handling code, controlling every step of document processing | Describe the goal in natural language; the AI understands and orchestrates the execution path |
| Code volume | Page-by-page parsing usually needs 300-600 lines of C# (page traversal, field locating, data export, etc.) | ~10 lines of calling code + 1 natural language instruction |
| Field recognition | Hard-code the page position and format of each field; layout changes require code changes | AI automatically understands the invoice layout and locates fields such as invoice number, date, amount |
| Page handling | Manually traverse every page and extract each one | AI automatically extracts page by page and aggregates |
| Data export | Manually write Excel writing logic and column layout | AI automatically generates a structured Excel with aligned fields |
| Requirement changes | Change extracted fields → change code → compile → redeploy | Modify the instruction; takes effect immediately |
From the comparison, when invoice layouts, extracted fields or export structures change frequently, the agent only needs a change of one sentence, while the traditional approach requires changing code and redeploying.
This article explains how to use the Spire.Agent.Office PDF AI capability to automatically extract the invoice number, date, amount, tax amount and buyer name from each page of a PDF invoice and export them to Excel, digitalizing your financial documents in one step.
For product installation and SpireToken configuration, please refer to Integrating Spire.Agent.Office in a .NET Project. The examples below assume Spire.Agent.Office is installed and SpireToken is configured.
Automatic Invoice Information Extraction
The core idea of automatic invoice information extraction is: pass multiple invoice PDFs to the AI agent as attachments; the agent reads each invoice, understands the layout page by page, recognizes fields such as invoice number, issue date, amount, tax ID, tax amount, buyer name and title, and aggregates them into a structured Excel. The whole process is roughly divided into three steps — first the agent reads each invoice PDF and locates the invoice fields on every page; second, it aligns the fields recognized on each page by semantics; finally, it aggregates the results into Excel and beautifies them as requested (auto-fitting column widths, adding borders, keeping numeric values with two decimal places and right-aligned). The whole "page-by-page parsing → field recognition → aggregation & beautification" process is completed automatically by the AI from a natural language instruction, without writing a separate parsing routine for each invoice or worrying about layout differences between suppliers.
For invoice PDFs with dozens or hundreds of pages, the traditional approach requires a set of locating rules for each layout, whereas with the agent approach you always maintain just one natural language instruction no matter how the invoice source or layout changes. Requirements such as the amount basis (tax-inclusive vs. tax-exclusive), column order, or whether to flag anomalies can also be written directly into the instruction and take effect immediately.
The following example uses the Spire.Agent.Office agent to automatically extract invoice information from each page of PDFs and export it to Excel through a natural language instruction:
using Spire.Agent.Office.AI;
using Spire.Agent.Office.Extensions;
using Spire.Pdf;

// PDF processing configuration
string key = "**************************";  // Apply for a SpireToken Key on the official website

string inputDir = @"E:\invoices";  // Directory containing invoice PDFs (multiple allowed)
string[] pdfFiles = Directory.GetFiles(inputDir, "*.pdf", SearchOption.TopDirectoryOnly);
string savePath = @"E:\output\merged.xlsx";  // Output file path (null -> auto-generated to the output directory)

string instruction =
    "Read the attachment files and identify the information of each invoice, extracting the invoice number, issue date, amount, tax ID, tax amount, buyer name and title.\n" +
    "Put each invoice as one row and summarize them into a single Excel table.\n" +
    "When exporting to Excel, please beautify the table appropriately:\n" +
    "auto-fit the column widths so that text is fully displayed; add borders to the whole data area to make rows and columns clear and readable;\n" +
    "keep numeric columns such as amount and tax amount with two decimal places and right-aligned. Finally save as a well-formatted, easy-to-read Excel file.";

// Call the PDF processing function (attachments are the invoice PDFs)
AIResult result = ExecuteDemoPDF(instruction, savePath, key, pdfFiles);

// Execute PDF document AI processing
static AIResult ExecuteDemoPDF(string instruction, string savePath, string key, string[] attachments)
{
    // Create an AIOptions configuration object
    AIOptions options = new AIOptions();
    options.SpireToken = key;  // Set SpireToken Key

    // Process the PDF document with a PdfDocument object
    using (PdfDocument pdf = new PdfDocument())
    {
        // Create the AI document processor; attachments are the invoice PDFs
        AIDocumentProcessor processor = pdf.AI(options);
        return processor.ExecuteInstruction(pdf, instruction, savePath, attachments);
    }
}
Original invoice PDF 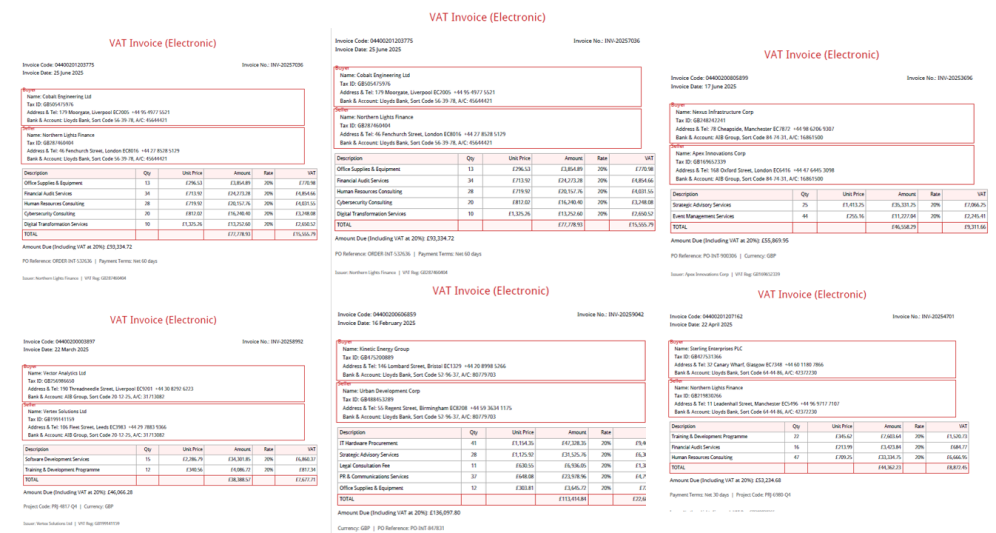 Extracted and exported Excel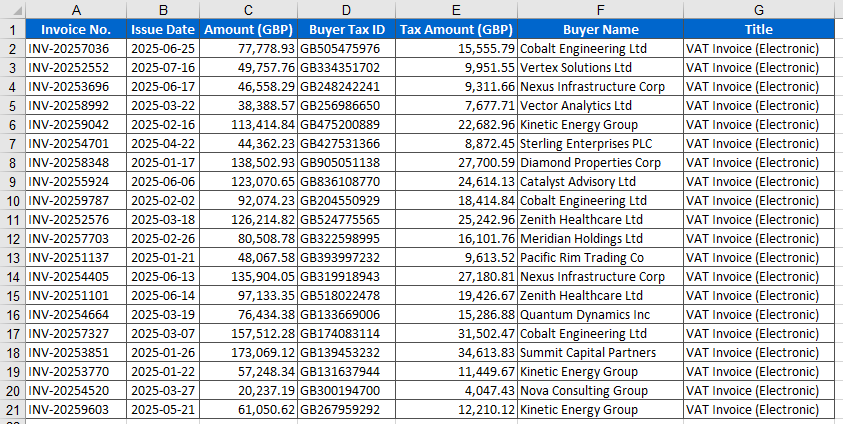
FAQ
The extracted amount or tax amount is incorrect
Reason: The invoice amount has both uppercase and lowercase forms, or the tax-inclusive/tax-exclusive basis is inconsistent.
Solution: Specify the extraction basis clearly in the instruction (e.g., "extract the total amount including tax", "extract the amount excluding tax"); the AI agent will extract according to the specified basis. If the invoice has two forms of amount, it is also recommended to state which one takes precedence to avoid ambiguity.
How are invoices with different layouts recognized?
Reason: Invoices from different suppliers have different layouts and field positions.
Solution: The AI agent can automatically understand the invoice layout and locate fields; for unusual layouts, you can add field hints in the instruction (e.g., "the invoice number is located in the upper-right corner") to help the agent locate more accurately.
The column order / field names of the result don't match expectations
Reason: By default the AI outputs fields in the order it recognizes them.
Solution: Specify the field names and order clearly in the instruction (e.g., "export in the order: invoice number, date, amount, tax amount, buyer"), and the agent will arrange the output columns as requested.
Getting a SpireToken Key
- Contact sales@e-iceblue.com or visit https://www.e-iceblue.com/TemLicense.html to obtain a trial/commercial API key
Configure it in code:
AIOptions options = new AIOptions();
options.SpireToken = key;
Convert Excel to ODS or ODS to Excel with JavaScript in React
In daily office work, data often needs to be exchanged between Excel spreadsheets and OpenDocument spreadsheets (ODS). ODS is an open-standard spreadsheet format widely used in open-source office software such as LibreOffice and OpenOffice. Spire.XLS for JavaScript runs entirely in the browser via WebAssembly, using a virtual file system (VFS) to manage input and output files — no backend server is required. It provides simple, easy-to-use APIs that make format conversion more convenient.
With Spire.XLS for JavaScript, you can save an Excel workbook as ODS format to work seamlessly with open-source office software, or import an ODS file to create a fully formatted Excel workbook. This makes data migration between different applications more convenient and efficient.
This article covers two core features:
For installation and project setup, refer to Integrating Spire.XLS for JavaScript in a React Project. The examples below assume Spire.XLS is installed and the WebAssembly module is initialized.
Convert Excel Workbook to ODS File
Exporting Excel data as ODS format makes it easy to open and edit directly in open-source office software such as LibreOffice and OpenOffice. With Spire.XLS for JavaScript, you can save an entire workbook as an ODS file, preserving table structure, styles, and data while enabling cross-platform data sharing. The steps are as follows:
- Create a
Workbookobject and load an existing Excel file. - Call the workbook's
SaveToFile()method, specifying the output filename and theFileFormat.ODSfile format. - Dispose of the workbook resources, read the result file from VFS, and trigger the download.
Below is a complete code example demonstrating how to convert Excel to ODS in React:
function App() {
  const convertToODS = async () => {
    // Get the Spire.XLS WASM module
    const xlsModule = window.wasmModule?.spirexls;

    // Check if the module is ready
    if (!xlsModule) {
      alert('Spire.Xls is not ready yet');
      return;
    }

    // Load the font file to ensure proper text rendering
    await window.spire.FetchFileToVFS('ARIAL.TTF', '/Library/Fonts/', `${process.env.PUBLIC_URL}font/`);

    // Load the sample Excel file into VFS
    await window.spire.FetchFileToVFS('Sample.xlsx', '', `${process.env.PUBLIC_URL}data/`);

    // Create a workbook object and load the Excel file
    const workbook = new xlsModule.Workbook();
    workbook.LoadFromFile({ fileName: 'Sample.xlsx' });

    // Save the workbook as an ODS file
    const outputFileName = 'ExcelToODS.ods';
    workbook.SaveToFile({ fileName: outputFileName, fileFormat: xlsModule.FileFormat.ODS });
    workbook.Dispose();

    // Read the file from VFS and trigger download
    const fileArray = window.dotnetRuntime.Module.FS.readFile(outputFileName);
    const blob = new Blob([fileArray], { type: 'application/vnd.oasis.opendocument.spreadsheet' });
    const url = URL.createObjectURL(blob);
    const a = document.createElement('a');
    a.href = url;
    a.download = outputFileName;
    a.click();
    URL.revokeObjectURL(url);
  };

  return (
    <div style={{ textAlign: 'center', height: '300px' }}>
      <h1>Convert Excel to ODS</h1>
      <button onClick={convertToODS}>
        Generate
      </button>
    </div>
  );
}

export default App;
Excel converted to ODS with Spire.XLS for JavaScript
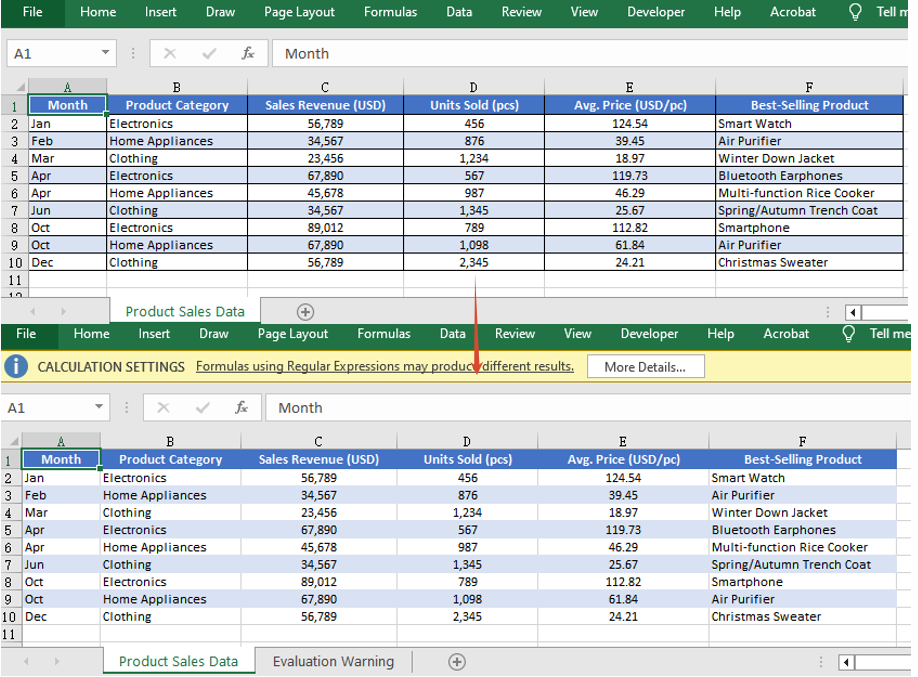
Convert ODS File to Excel Workbook
Importing an ODS file into an Excel spreadsheet allows you to take full advantage of Excel's powerful formatting, calculation, and charting capabilities. Spire.XLS for JavaScript supports loading an ODS file directly via the LoadFromFile() method, which automatically detects its file format, and then you can save the workbook as an Excel file. The steps are as follows:
- Load the font file and ODS sample file into the VFS.
- Create a
Workbookobject and load the ODS file via theLoadFromFile()method. - Save the workbook as an Excel file and trigger the download.
Below is a complete code example demonstrating how to convert ODS to Excel in React:
function App() {
  const convertToExcel = async () => {
    // Get the Spire.XLS WASM module
    const xlsModule = window.wasmModule?.spirexls;

    // Check if the module is ready
    if (!xlsModule) {
      alert('Spire.Xls is not ready yet');
      return;
    }

    // Load the font file to ensure proper text rendering
    await window.spire.FetchFileToVFS('ARIAL.TTF', '/Library/Fonts/', `${process.env.PUBLIC_URL}font/`);

    // Load the ODS sample file into VFS
    await window.spire.FetchFileToVFS('Sample.ods', '', `${process.env.PUBLIC_URL}data/`);

    // Create a workbook object and load the ODS file
    const workbook = new xlsModule.Workbook();
    workbook.LoadFromFile({ fileName: 'Sample.ods' });

    // Save the workbook and release resources
    const outputFileName = 'ODSToExcel.xlsx';
    workbook.SaveToFile({ fileName: outputFileName, version: xlsModule.ExcelVersion.Version2010 });
    workbook.Dispose();

    // Read the file from VFS and trigger download
    const fileArray = window.dotnetRuntime.Module.FS.readFile(outputFileName);
    const blob = new Blob([fileArray], { type: 'application/vnd.openxmlformats-officedocument.spreadsheetml.sheet' });
    const url = URL.createObjectURL(blob);
    const a = document.createElement('a');
    a.href = url;
    a.download = outputFileName;
    a.click();
    URL.revokeObjectURL(url);
  };

  return (
    <div style={{ textAlign: 'center', height: '300px' }}>
      <h1>Convert ODS to Excel</h1>
      <button onClick={convertToExcel}>
        Generate
      </button>
    </div>
  );
}

export default App;
ODS converted to Excel with Spire.XLS for JavaScript

FAQ
Why can't the generated ODS file be opened properly?
Cause: When saving the workbook with the SaveToFile() method, if the correct output file format is not specified via the fileFormat parameter, the generated file format may not match the extension, causing it to fail to open.
Solution: Specify the specific file format enum value xlsModule.FileFormat.ODS when saving as ODS:
const outputFileName = 'ExcelToODS.ods';
workbook.SaveToFile({ fileName: outputFileName, fileFormat: xlsModule.FileFormat.ODS });
How to handle the downloaded ODS file being opened as another type or unrecognized?
Cause: The MIME type is not set correctly when creating the Blob, so the browser cannot recognize the downloaded file as an ODS document, which may cause it to open as another type or display garbled text.
Solution: Specify the correct MIME type when downloading and make sure the download filename ends with .ods:
const blob = new Blob([fileArray], { type: 'application/vnd.oasis.opendocument.spreadsheet' });
const a = document.createElement('a');
a.href = URL.createObjectURL(blob);
a.download = 'ExcelToODS.ods';
a.click();
Get a Free License
Spire.XLS for JavaScript offers a 30-day full-featured free trial license with no functional limitations. Apply here to evaluate before purchasing.
Automação da geração de relatórios Excel com um agente de IA em C#
Tabela de Conteúdo
IA para Excel em C# significa combinar o julgamento de um modelo de linguagem com uma biblioteca real de processamento de Excel dentro de uma aplicação .NET, para que a aplicação possa mesclar, normalizar, analisar e formatar dados de planilhas a partir de instruções em linguagem natural em vez de código coluna por coluna. A parte difícil dos relatórios em Excel raramente foi desenhar o gráfico final — é transformar uma pilha de pastas de trabalho de origem inconsistentes em dados nos quais você realmente possa confiar. Com um agente de IA, você descreve a tarefa de relatório ("mescle estas 20 pastas de trabalho de lojas e sinalize as lojas cuja receita caiu mais de 30%") e recebe de volta uma pasta de trabalho formatada, não uma resposta em chat. O Spire.Agent.Office oferece ambas as partes: a compreensão de linguagem e uma camada de documento determinística que garante a geração de um arquivo .xlsx (ou PDF) real.
Navegação Rápida
- De Pastas de Trabalho Heterogêneas a um Modelo de Dados Comum
- Transformando Regras de Negócio em Análise em Linguagem Natural
- Da Análise a um Relatório Pronto para a Gestão
- Construindo o Fluxo de Trabalho em C#
- FAQ
1. O Real Gargalo na Automação de Relatórios do Excel
Considere a tarefa recorrente por trás da maioria das solicitações de "relatórios mensais". Uma equipe de operações administra 20 lojas regionais, e cada loja envia uma pasta de trabalho de vendas no final do mês. Em teoria, este é um único relatório. Na prática, são vinte arquivos diferentes que por acaso compartilham um padrão de nome de arquivo:
- As colunas não coincidem. Uma loja chama o valor de
Revenue, outra deSales Amount, e uma terceira deNet Sales. - O layout não coincide. Uma loja coloca os meses nas colunas, outra nas linhas, e uma terceira inclui uma coluna de notas no meio.
- Os tipos de dados não coincidem. As datas vêm como texto, os números vêm como milhares e pelo menos uma loja mescla uma linha de título no cabeçalho.
Portanto, antes que alguém possa produzir um gráfico para a gestão, um analista passa a semana abrindo arquivos, mapeando colunas, normalizando datas, procurando erros de digitação e só então verificando anomalias e montando o relatório. Nenhuma dessas tarefas faz parte da "geração de relatórios". Tudo isso é preparação de dados.
O ponto a ser internalizado: a parte difícil dos relatórios em Excel raramente é criar o gráfico final. É transformar pastas de trabalho de origem inconsistentes em dados nos quais você realmente possa confiar. Uma biblioteca de gráficos plotará dados incorretos com prazer; o que falta à equipe é um caminho confiável de arquivos de entrada brutos para uma tabela limpa e comparável. Esse caminho é exatamente onde um agente de IA muda a dinâmica.
2. O Que Muda Quando um Agente de IA Entra no Fluxo de Trabalho
A automação dessa tarefa não é nova — apenas costuma ser cara. Compare os dois fluxos de trabalho:
Automação tradicional
Inspecionar arquivos
→ mapear colunas
→ normalizar dados
→ escrever regras
→ gerar pasta de trabalho
Cada etapa antes da última é pré-definida: você escreve um mapa de colunas para cada cabeçalho conhecido, um analisador de data para cada formato conhecido e um limite para cada regra. No momento em que uma loja renomeia uma coluna ou uma regra de negócio muda, o mapa e as regras ficam incorretos, e um humano precisa intervir novamente.
Automação com agente
Descrever a tarefa de relatório
→ fornecer pastas de trabalho de origem
→ revisar o resultado
O agente lê o significado de cada pasta de trabalho em vez de uma posição fixa, portanto, o mapa de colunas e o conjunto de regras não precisam mais ser enumerados antecipadamente. O que ele remove é precisamente a parte cara: o trabalho de pré-definir um esquema e um conjunto de regras que falharão no próximo arquivo.
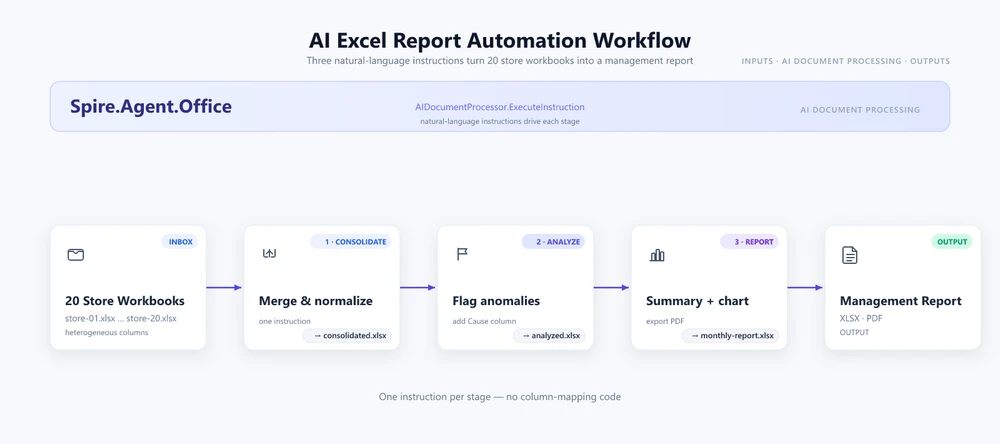
O restante deste artigo percorre esse pipeline uma vez, desde as pastas de trabalho brutas até um PDF impresso, usando o cenário das 20 lojas como exemplo principal. As seções 3 a 5 explicam o que o agente faz em cada etapa; a seção 6 fornece o código C# completo que o executa.
3. De Pastas de Trabalho Heterogêneas a um Modelo de Dados Comum
A versão do problema específica do Excel é que diferentes pastas de trabalho "parecem iguais" sem realmente ser iguais. Três lojas podem, cada uma, enviar uma tabela com quatro colunas e ainda assim não oferecer uma maneira de mesclá-las sem interpretação humana:
| Loja A | Loja B | Loja C |
|---|---|---|
| Revenue | Sales Amount | Net Sales |
| Month | Reporting Period | Date |
| Units | Quantity Sold | Qty |
Não existe um índice de coluna que as mapeie entre si, porque o mapeamento é semântico, e não posicional. Revenue, Sales Amount e Net Sales são três nomes para o mesmo conceito, e somente a compreensão do cabeçalho permite alinhá-los.
A etapa de consolidação do agente transforma esse alinhamento semântico em um único esquema:
Store / Region / SKU / UnitsSold / Revenue / Month
Ele lê cada pasta de trabalho de origem, resolve os nomes dos cabeçalhos em relação a esse modelo de destino, alinha linhas e colunas, ignora linhas duplicadas de cabeçalho e título e grava uma tabela normalizada. O desenvolvedor nunca escreve uma rotina FindColumnByHeader("Revenue") — a instrução nomeia o esquema de destino, e o agente determina o mapeamento a partir de cada arquivo.
Esta é a etapa com o maior retorno imediato, porque é a etapa que atualmente consome a maior parte do tempo do analista e quebra com mais frequência quando uma nova loja é adicionada.
4. Transformando Regras de Negócio em Análise em Linguagem Natural
Assim que os dados estão em um só lugar, a geração de relatórios precisa de julgamento, e o julgamento é onde as regras codificadas rigidamente falham. O exemplo prático usa uma regra financeira típica:
Sinalizar linhas onde a receita caiu mais de 30% ou cresceu mais de 50% em relação ao mês anterior.
Note o quanto está contido nessa frase e o quão inconveniente é cada parte em formato de código:
- Por que 30% e 50%? Esses são limites de negócios com contexto — uma loja sazonal, um novo SKU ou uma promoção alteram o significado de "incomum". Um
if (change < -0.30)codificado rigidamente trata cada loja de forma idêntica e dispara falsos alarmes devido à sazonalidade. - Como você altera isso? No código, você recompila e faz um novo implante (redeploy). Na instrução, o analista edita uma única frase: "caiu mais de 20%", ou "apenas para a região Leste", ou "sinalizar apenas SKUs com mais de 100 unidades vendidas".
- Adicionar uma dimensão? Quer que a regra seja aplicada por loja e por região e por mês? Você adiciona uma cláusula à instrução, não um loop aninhado.
- Explicar o resultado? O agente pode anexar uma coluna
Causecom uma explicação provável de uma frase para cada linha sinalizada — algo que uma comparação de limite por si só nunca poderá produzir.
O princípio decorrente desta seção vale a pena ser destacado claramente:
O código define como; as instruções definem o quê.
O desenvolvedor deixa de codificar a regra e passa a descrever o resultado. A regra permanece legível, editável pelos negócios e sobrevive a uma nova loja ou a uma alteração de limite sem qualquer mudança de código.
Para um exemplo prático completo da mesma análise orientada por instruções aplicada a um fluxo de trabalho de classificação (ranking), consulte o tutorial Análise e Classificação de Pontuação de Estudantes.
5. Da Análise a um Relatório Pronto para a Gestão
Encontrar anomalias é apenas metade da geração de relatórios. O resultado ainda precisa se tornar uma pasta de trabalho que alguém possa realmente usar — a planilha do analista não é o entregável; o resumo gerencial é.
O pipeline é concluído assim:
Pastas de Trabalho Brutas
      ↓
Dados Consolidados
      ↓
Anomalias
      ↓
Resumo Gerencial
      ↓
PDF
A instrução final compõe o entregável: uma aba Summary na frente com um bloco de KPIs (receita total, melhor loja, pior loja, contagem de anomalias sinalizadas), uma tabela de tendência mensal, um gráfico de barras de receita por região e formatação pronta para impressão. Apontar a mesma instrução para um caminho .pdf exporta o relatório idêntico como PDF para distribuição, sem uma etapa de renderização separada.
O ponto a ter em mente: análise e composição são dois trabalhos diferentes, e o agente faz ambos. O trabalho do analista passa a ser revisar a lista restrita sinalizada e aprovar, em vez de reconstruir a apresentação todos os meses.
6. Construindo o Fluxo de Trabalho em C#
Todas as peças acima são acionadas por um único pipeline em C#. Configure o agente uma vez e execute três instruções em sequência: consolidar, analisar e relatar. A configuração completa — token, pacotes e conexão do projeto — está documentada passo a passo no tutorial Primeiros Passos; aqui nos concentramos no próprio fluxo de trabalho.
using System.IO;
using Spire.Xls;
using Spire.Agent.Office.AI;
using Spire.Agent.Office.Extensions;

AIOptions options = new AIOptions {
    SpireToken = spireToken,
    WorkDir = @"C:\retail-ops\output",
    TimeoutMs = 300000
};

string[] storeFiles = Directory.GetFiles(@"C:\retail-ops\inbox", "*.xlsx");
Directory.CreateDirectory(@"C:\retail-ops\output");
1. Consolidar. Passe os 20 arquivos da caixa de entrada como anexos e nomeie o esquema de destino. A normalização da seção 3 ocorre aqui, impulsionada pela instrução em vez de qualquer mapa de colunas:
using (Workbook consolidated = new Workbook())
{
    AIResult result = consolidated.AI(options).ExecuteInstruction(
        consolidated,
        "Leia todas as pastas de trabalho de vendas regionais na caixa de entrada e mescle-as em uma única planilha. " +
        "Cada loja nomeia suas colunas de forma diferente (por exemplo, Sales vs Amount, Month vs Period); " +
        "normalize-as para um único esquema: Store, Region, SKU, UnitsSold, Revenue, Month. Ignore " +
        "linhas de cabeçalho duplicadas e salve o resultado mesclado como uma pasta de trabalho.",
        @"C:\retail-ops\output\consolidated.xlsx",
        storeFiles);

    if (result == null || !result.Success)
        throw new InvalidOperationException($"Consolidation failed: {result?.ErrorMessage}");
}
2. Analisar. Carregue o arquivo consolidado e defina a regra da seção 4 em linguagem clara. O agente adiciona uma aba Anomalies e deixa os dados de origem intocados:
using (Workbook analysis = new Workbook())
{
    analysis.LoadFromFile(@"C:\retail-ops\output\consolidated.xlsx");

    AIResult result = analysis.AI(options).ExecuteInstruction(
        analysis,
        "Adicione uma aba 'Anomalies'. Compare a Revenue de cada loja e SKU com o mês " +
        "anterior, sinalize as linhas onde a receita caiu mais de 30% ou cresceu mais de 50%, aplique " +
        "um preenchimento vermelho para quedas e um preenchimento verde para aumentos, e adicione uma coluna 'Cause' com uma " +
        "explicação provável de uma frase. Deixe as planilhas de dados originais inalteradas.",
        @"C:\retail-ops\output\analyzed.xlsx");

    if (result == null || !result.Success)
        throw new InvalidOperationException($"Analysis failed: {result?.ErrorMessage}");
}
A aba Anomalies é inserida ao lado dos dados de origem, com as linhas sinalizadas, preenchimentos e a coluna Cause aplicados pela instrução:
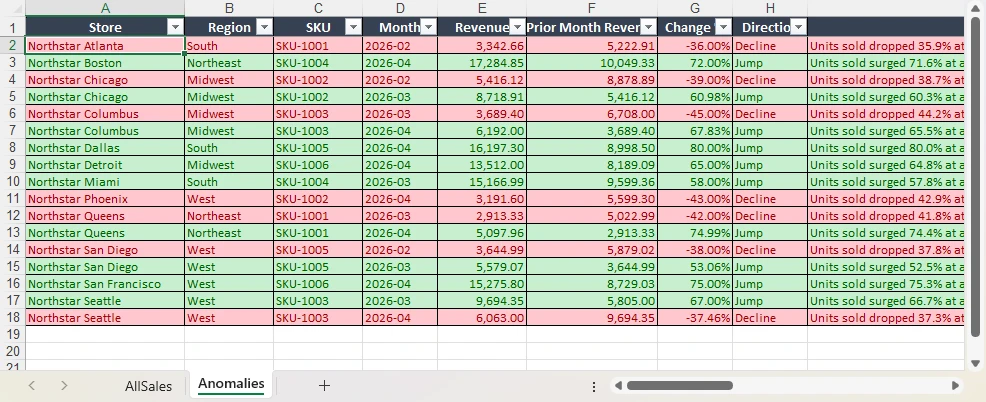
3. Gerar Relatório. Componha o resumo gerencial da seção 5 e exporte-o. O savePath por si só escolhe o formato — .xlsx aqui, .pdf para distribuição:
using (Workbook report = new Workbook())
{
    report.LoadFromFile(@"C:\retail-ops\output\analyzed.xlsx");

    AIResult result = report.AI(options).ExecuteInstruction(
        report,
        "Produza um relatório gerencial. Adicione uma aba 'Summary' na frente com um bloco de KPIs " +
        "(receita total, melhor loja, pior loja, contagem de anomalias sinalizadas), uma tabela de tendência " +
        "mensal e um gráfico de barras de receita por região. Formate-o para impressão e salve a pasta de " +
        "trabalho concluída.",
        @"C:\retail-ops\output\monthly-report.xlsx");

    if (result == null || !result.Success)
        throw new InvalidOperationException($"Report generation failed: {result?.ErrorMessage}");
}
A aba Summary é colocada na frente da pasta de trabalho, pronta para impressão ou exportação em PDF:
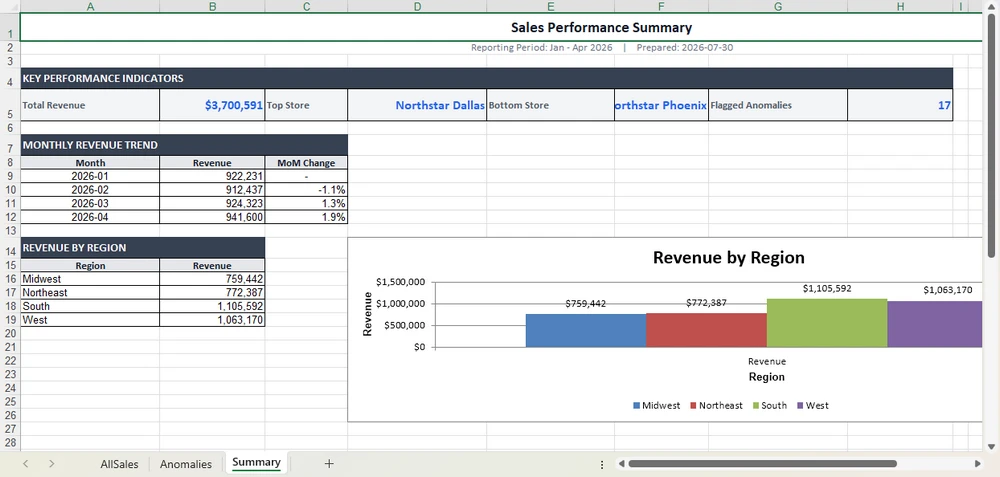
Principais Chamadas de API
Workbook.AI(options)— anexa o processador de documentos de IA a um objeto de pasta de trabalho existenteExecuteInstruction(doc, instruction, savePath, attachments)— executa uma etapa e grava o resultadoAIResult.Success/AIResult.ErrorMessage— verifica cada etapa e exibe falhas
O Que Você Escreveria Sem o Agente
Para fins de contraste, a rota de SDK tradicional para as mesmas três etapas localiza cada coluna pela string do cabeçalho, codifica rigidamente cada limite e define cada preenchimento célula por célula — e precisa de reajuste total quando uma loja renomeia uma coluna ou a regra muda:
foreach (string file in storeFiles)
{
    Workbook wb = new Workbook();
    wb.LoadFromFile(file);
    Worksheet sheet = wb.Worksheets[0];

    // Falha no momento em que uma loja nomeia a coluna como "Sales" em vez de "Revenue".
    int revenueCol = FindColumnByHeader(sheet, "Revenue");
    int storeCol   = FindColumnByHeader(sheet, "Store");

    for (int r = sheet.LastRow; r >= 2; r--)
    {
        double current = double.Parse(sheet.Range[r, revenueCol].Text);
        double prior   = double.Parse(sheet.Range[r, revenueCol + 1].Text);
        double change  = (current - prior) / prior;

        // Um limite codificado rigidamente; uma loja sazonal dispara falsos alarmes.
        if (change < -0.30) sheet.Range[r, revenueCol].Style.Color = Color.Red;
    }
    // ... depois mesclar, depois resumo, depois gráfico -- centenas de linhas por loja e por mês.
}
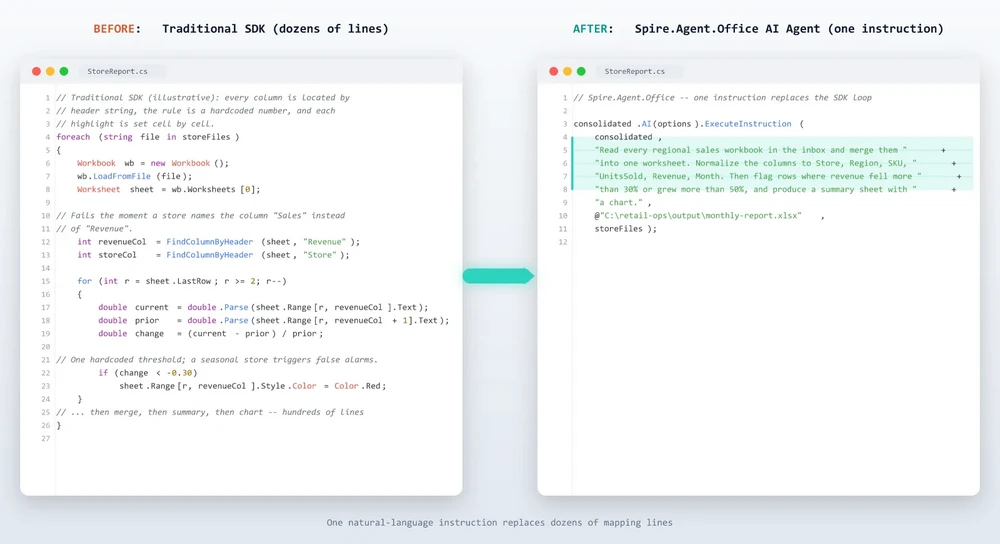
O agente não remove a necessidade de código — ele remove a necessidade de código de mapeamento. A diferença está em onde a lógica reside: em um localizador de colunas e um limite, ou em uma frase que a equipe de negócios pode ler e editar.
7. Onde a IA Para e a Lógica da Aplicação Começa
Uma maneira mais honesta de pensar sobre essa fronteira do que uma lista do que "pode e não pode" ser feito: o agente não elimina a lógica determinística da aplicação — ele atua sobre ela.
A aplicação ainda é proprietária de tudo o que não tem a ver com a compreensão da planilha:
- Descoberta e acesso a arquivos — localizar os arquivos da caixa de entrada, verificar permissões e prepará-los
- Agendamento do fluxo de trabalho — quando o relatório é executado, com qual gatilho e em qual ordem
- Controle da fonte de dados — quais arquivos são entradas autorizadas e de onde eles vêm
- Tratamento de erros e tentativas — o que acontece quando um arquivo está ausente ou uma etapa falha
- Aprovação final — um humano revisa as anomalias sinalizadas antes da aprovação
- Reconciliação externa — comparar o relatório com um sistema de registro
O agente é responsável pelas partes que são genuinamente semânticas:
- Compreensão — ler o que cada coluna realmente significa
- Normalização — alinhar esquemas heterogêneos em um único modelo
- Interpretação — aplicar uma regra de negócio para decidir o que é incomum
- Transformação — transformar dados brutos em um resumo, gráfico e formatação
- Composição — montar a pasta de trabalho final ou PDF
Essa estrutura é mais útil do que uma tabela de recursos porque indica onde aplicar seu esforço de engenharia. Mantenha a estrutura determinística no código — onde ela é testável e auditável — e entregue o trabalho semântico ao agente. Cada lado faz o que faz de melhor.
8. Adicionando IA a um Fluxo de Trabalho Excel .NET Existente
A última coisa que vale a pena tornar explícita é o quão pouco você precisa reconstruir para chegar lá. Se sua aplicação já funciona com Excel por meio do Spire.Xls, o modelo de documento que você já possui é o ponto de integração:
Workbook
   ↓
Workbook.AI(options)
   ↓
ExecuteInstruction(...)
Você não está introduzindo uma nova camada de documento ou um serviço de processamento de documentos separado. Você está adicionando uma camada de execução em linguagem natural ao objeto Workbook que já possui. O mesmo objeto que abriu, mesclou e salvou seus arquivos agora aceita uma instrução e executa o fluxo de trabalho, com o mecanismo determinístico do Excel garantindo que a saída seja um arquivo real e bem formado — células mescladas, formatos de número e gráficos intactos. O mesmo padrão ExecuteInstruction se estende a documentos do Word e PDF — veja Revisão de Contratos com IA em C#.
Essa é a proposta de valor para um desenvolvedor Excel, declarada nos termos em que você já pensa: não "adotar uma plataforma de IA", mas sim "ensinar a pasta de trabalho que você já usa a aceitar instruções." Quando uma loja renomeia uma coluna ou a equipe financeira altera a regra de sinalização, a correção é uma edição em uma frase, e não a reconstrução do pipeline de documentos.
9. FAQ
Preciso enviar meus dados do Excel para a nuvem?
Não necessariamente. O Spire.Agent.Office é executado a partir de sua própria aplicação, portanto o SDK e o processamento de documentos permanecem dentro do seu ambiente; seus arquivos não são enviados para um serviço de terceiros para armazenamento ou conversão. Para analisar o conteúdo, a IA precisa dos dados relevantes, e estes são enviados ao modelo para processamento — uma etapa inerente a qualquer fluxo de trabalho de IA. Se você implantar seu próprio modelo em sua rede local, o conteúdo permanecerá inteiramente em sua infraestrutura. Se você se conectar por meio de uma API de modelo hospedado, como OpenAI ou Azure OpenAI, o conteúdo relevante será transmitido a esse provedor pela rede de acordo com sua configuração.
Quais formatos do Excel são suportados?
A entrada abrange arquivos de pasta de trabalho padrão, como XLSX e XLS, e o agente lê a pasta de trabalho diretamente em seu formato nativo. A saída pode ser salva como XLSX, XLS, CSV, PDF ou HTML, para que o relatório final possa ir direto para um arquivo ou lista de distribuição.
Ele pode substituir minha revisão financeira ou operacional?
Não. O agente automatiza a leitura, normalização, análise e formatação — as horas que um analista gasta todos os meses —, mas a aprovação final permanece com um revisor humano. Trate as anomalias sinalizadas como uma lista curta a ser verificada, não como uma decisão já tomada.
Qual a diferença entre isso e colar meus dados no ChatGPT?
Um modelo de chat pode informar o que parece incomum, mas não pode colocar essa resposta em uma pasta de trabalho estilizada com uma planilha de resumo, formatação condicional e um gráfico, nem pode exportar um PDF. Um agente de IA para Excel combina o julgamento do modelo de linguagem com uma camada determinística do Excel, para que a saída seja um arquivo real e bem formado que sua equipe possa abrir e distribuir.
Posso usar meu próprio modelo de IA?
Sim. O Spire.Agent.Office suporta integração flexível de modelos de IA e é compatível com as principais infraestruturas de IA, incluindo APIs de modelos hospedados e modelos implantados de forma privada. Você pode apontar o agente para seu próprio endpoint. Para dúvidas sobre quais provedores são suportados em sua implantação, entre em contato conosco.
Pronto para Automatizar seus Relatórios no Excel?
A consolidação, a análise de anomalias e a geração de relatórios são as formas mais rápidas de obter valor: aponte o agente para a caixa de entrada, descreva o relatório e obtenha uma pasta de trabalho ou PDF formatado. Siga o tutorial Primeiros Passos para executar seu primeiro fluxo de trabalho de planilha em .NET.
Leitura Adicional
- Tutorial de Automação de Análise e Classificação de Pontuação de Estudantes -- um fluxo de trabalho do Excel executado do início ao fim pelo agente
- Revisão de Contratos com IA em C# -- o mesmo padrão orientado por instruções aplicado a documentos do Word e PDF
- Visão geral do produto Spire.Agent.Office -- SDKs de agentes de IA para todos os formatos de documentos do Office
C# 기반 AI 에이전트를 활용한 Excel 보고서 생성 자동화
C# 기반 Excel AI는 .NET 애플리케이션 내에서 언어 모델의 판단력과 실제 Excel 처리 라이브러리를 결합하는 것을 의미합니다. 이를 통해 애플리케이션은 열 단위의 복잡한 코드 대신 자연어 지시사항을 기반으로 스프레드시트 데이터를 병합, 정규화, 분석 및 서식 지정할 수 있습니다. Excel 보고서 작업에서 가장 어려운 부분은 차트를 그리는 것이 아니라, 서로 다른 형식의 소스 워크북들을 실제로 신뢰할 수 있는 데이터로 변환하는 것입니다. AI 에이전트를 사용하면 보고 작업("이 20개 매장 워크북을 병합하고 매출이 30% 이상 감소한 매장을 표시해 줘")을 설명하기만 하면 단순한 채팅 답변이 아닌 서식이 지정된 워크북을 받게 됩니다. Spire.Agent.Office는 언어 이해 기능과 실제 .xlsx(또는 PDF) 파일 출력을 보장하는 결정론적 문서 레이어를 모두 제공합니다.
빠른 이동
1. Excel 보고서 자동화의 진정한 병목 현상
대부분의 "월간 보고" 요청 뒤에 숨겨진 반복적인 작업을 예로 들어보겠습니다. 운영팀은 20개의 지역 매장을 운영하고 있으며, 각 매장은 월말에 매출 워크북을 전송합니다. 이론상으로는 하나의 보고서이지만, 실제로는 파일 이름 패턴만 공유할 뿐 서로 다른 20개의 파일입니다.
- 열(Column)이 일치하지 않습니다. 한 매장은 수치를
Revenue로, 다른 매장은Sales Amount로, 세 번째 매장은Net Sales로 부릅니다. - 레이아웃이 일치하지 않습니다. 한 매장은 월을 열 방향으로, 다른 매장은 행 방향으로 배치하며, 세 번째 매장은 중간에 메모 열을 집어넣습니다.
- 데이터 형식이 일치하지 않습니다. 날짜가 텍스트로 입력되거나, 숫자에 천 단위 구분 기호가 들어가고, 최소 한 매장은 헤더 행에 제목 행을 병합해 놓습니다.
따라서 경영진을 위한 차트를 만들기 전에 분석가는 일주일 내내 파일을 열고, 열을 매핑하고, 날짜를 정규화하고, 오탈자를 찾은 후에야 비로소 이상 징후를 확인하고 보고서를 작성합니다. 이 과정 중 그 어떤 것도 "보고서 생성" 단계가 아닙니다. 모두 데이터 준비 작업일 뿐입니다.
여기서 명심해야 할 점은 Excel 보고서 작업에서 어려운 부분은 최종 차트를 만드는 것이 아니라, 일관성 없는 소스 워크북을 실제로 신뢰할 수 있는 데이터로 변환하는 것입니다. 차트 라이브러리는 잘못된 데이터라도 얼마든지 그려냅니다. 팀에 정말 필요한 것은 수신함의 원시 파일에서 깨끗하고 비교 가능한 테이블로 이어지는 신뢰할 수 있는 경로입니다. AI 에이전트는 바로 이 과정의 비효율성을 완전히 바꿔놓습니다.
2. AI 에이전트가 워크플로우에 도입되면 바뀌는 것들
이 작업을 자동화하는 것 자체는 새로운 개념이 아니지만, 기존 방식은 비쌉니다. 두 워크플로우를 비교해 보세요.
기존 자동화 방식
파일 검사
→ 열 매핑
→ 데이터 정규화
→ 규칙 작성
→ 워크북 생성
마지막 단계를 제외한 모든 단계가 사전에 정의되어야 합니다. 알려진 헤더마다 열 매핑을 작성하고, 알려진 형식마다 날짜 파서를 만들며, 각 규칙마다 임계값을 설정해야 합니다. 매장이 열 이름을 바꾸거나 비즈니스 규칙이 변경되는 순간, 매핑과 규칙은 무용지물이 되고 사람이 다시 개입해야 합니다.
에이전트 기반 자동화
보고 작업 설명
→ 소스 워크북 제공
→ 결과 검토
에이전트는 고정된 위치 대신 각 워크북의 의미(Semantic)를 읽어내므로 열 매핑과 규칙 세트를 사전에 일일이 나열할 필요가 없습니다. 이를 통해 다음 파일에서 쉽게 깨지곤 했던 스키마 및 규칙 세트의 사전 정의 작업이라는 가장 비싼 비용을 제거할 수 있습니다.
이 문서의 나머지 부분에서는 20개 매장 시나리오를 예시로 삼아 원시 워크북에서 인쇄 가능한 PDF 생성까지의 파이프라인을 살펴봅니다. 3절부터 5절까지는 각 단계에서 에이전트가 수행하는 작업을 설명하며, 6절에서는 이를 실행하는 전체 C# 코드를 제공합니다.
3. 서로 다른 워크북에서 공통 데이터 모델로
Excel 관련 문제의 특수성은 서로 다른 워크북들이 실제로는 같지 않음에도 "같아 보인다"는 점입니다. 세 매장이 각각 4개의 열이 있는 테이블을 보내오더라도 사람이 해석하지 않고는 병합할 수 없는 경우가 많습니다.
| 매장 A | 매장 B | 매장 C |
|---|---|---|
| Revenue | Sales Amount | Net Sales |
| Month | Reporting Period | Date |
| Units | Quantity Sold | Qty |
이 매핑은 위치가 아닌 의미적(Semantic) 매핑이기 때문에 서로를 직접 연결하는 열 인덱스가 존재하지 않습니다. Revenue, Sales Amount, Net Sales는 동일한 개념을 가리키는 세 가지 이름이며, 헤더의 의미를 이해해야만 맞출 수 있습니다.
에이전트의 통합 단계는 이러한 의미적 맞춤을 단일 스키마로 변환합니다.
Store / Region / SKU / UnitsSold / Revenue / Month
에이전트는 각 소스 워크북을 읽고 대상 모델에 맞게 헤더 이름을 해독하며, 행과 열을 맞추고, 중복된 헤더 및 제목 행을 건너뛰며, 하나의 정규화된 테이블을 작성합니다. 개발자는 FindColumnByHeader("Revenue")와 같은 루틴을 작성할 필요가 없습니다. 지시사항에 대상 스키마 이름을 지정하면 에이전트가 각 파일의 매핑을 스스로 해결합니다.
이 단계는 현재 분석가의 시간을 가장 많이 소모하고 새로운 매장이 추가될 때 가장 자주 깨지는 구간이므로, 자동화 시 단일 작업 기준으로 가장 큰 이점을 제공합니다.
4. 비즈니스 규칙을 자연어 분석으로 변환하기
데이터가 한곳에 모이면 보고에는 판단이 필요하며, 하드코딩된 규칙은 이 판단 단계에서 한계를 드러냅니다. 대표적인 재무 규칙 예시를 살펴보겠습니다.
전월 대비 매출이 30% 이상 감소했거나 50% 이상 증가한 행을 표시합니다.
이 한 문장에 얼마나 많은 내용이 담겨 있는지, 그리고 코드로 구현하려면 각 부분이 얼마나 까다로운지 확인해 보세요.
- 왜 30%와 50%인가? 이 숫자들은 맥락이 있는 비즈니스 임계값입니다. 계절성을 타는 매장, 신규 SKU, 또는 프로모션 행사에 따라 "이상 현상"의 기준이 달라집니다. 하드코딩된
if (change < -0.30)조건문은 모든 매장을 동일하게 취급하므로 계절성 변화에 오탐(False Alarm)을 발생시킵니다. - 규칙을 어떻게 변경하는가? 코드에서는 다시 컴파일하고 배포해야 합니다. 그러나 지시사항 방식에서는 분석가가 "20% 이상 감소"나 "동부 지역에만 적용", 또는 "100개 이상 판매된 SKU만 표시"와 같이 한 문장만 수정하면 됩니다.
- 차원을 추가하려면? 매장별, 지역별, 월별로 규칙을 적용하고 싶으신가요? 중첩 루프문 대신 지시사항에 조건절 하나만 추가하면 됩니다.
- 결과를 설명해야 하는가? 에이전트는 감지된 각 행에 대해 한 문장으로 된 유력한 설명이 담긴
Cause열을 추가할 수 있습니다. 이는 단순 임계값 비교 코드가 결코 제공할 수 없는 기능입니다.
이 내용이 전달하는 핵심 원칙은 다음과 같습니다.
코드는 '어떻게(How)'를 정의하고, 지시사항은 '무엇을(What)'할지 정의합니다.
개발자는 규칙을 일일이 코딩하는 대신 원하는 결과를 설명하기 시작합니다. 규칙은 명확하고 비즈니스 담당자가 직접 수정할 수 있는 형태로 유지되며, 매장이 추가되거나 임계값이 변경되어도 코드를 수정할 필요가 없습니다.
지시사항 기반 분석이 순위 산출 워크플로우에 적용된 전체 예제는 학생 점수 분석 및 순위 매기기 튜토리얼을 참조하세요.
5. 분석에서 경영진 보고서 작성까지
이상 징후를 찾는 것은 보고 작업의 절반에 불과합니다. 결과물은 누군가가 실제로 사용할 수 있는 워크북 형태가 되어야 합니다. 분석가의 단순 스프레드시트는 최종 제출물이 아니며, 경영진 요약 보고서가 진짜 제출물입니다.
파이프라인은 다음과 같이 완성됩니다.
원시 워크북
      ↓
통합 데이터
      ↓
이상 징후
      ↓
경영진 요약
      ↓
PDF
최종 지시사항은 결과물을 구성합니다. 맨 앞에 KPI 블록(총 매출, 최고 매출 매장, 최저 매출 매장, 감지된 이상 징후 수)이 포함된 Summary 시트를 추가하고, 월별 추이 테이블, 지역별 매출 막대 차트, 인쇄용 서식을 설정합니다. 동일한 지시사항에서 저장 경로를 .pdf로 지정하면 별도의 렌더링 단계 없이 동일한 보고서가 배포용 PDF로 내보내집니다.
여기서 얻을 수 있는 점은 분석과 구성은 서로 다른 두 가지 작업이며, 에이전트가 이 두 가지를 모두 수행한다는 것입니다. 분석가의 역할은 매달 프레젠테이션을 처음부터 다시 만드는 것이 아니라 감지된 항목을 검토하고 승인하는 것으로 전환됩니다.
6. C#으로 워크플로우 구축하기
위의 모든 단계는 하나의 C# 파이프라인으로 실행됩니다. 에이전트를 한 번 설정한 후 통합, 분석, 보고의 세 가지 지시사항을 순차적으로 실행합니다. 토큰, 패키지 및 프로젝트 연결을 포함한 전체 설정은 시작하기 튜토리얼에 단계별로 설명되어 있으며, 여기서는 워크플로우 자체에 집중합니다.
using System.IO;
using Spire.Xls;
using Spire.Agent.Office.AI;
using Spire.Agent.Office.Extensions;

AIOptions options = new AIOptions {
    SpireToken = spireToken,
    WorkDir = @"C:\retail-ops\output",
    TimeoutMs = 300000
};

string[] storeFiles = Directory.GetFiles(@"C:\retail-ops\inbox", "*.xlsx");
Directory.CreateDirectory(@"C:\retail-ops\output");
1. 통합(Consolidate). 20개의 수신함 파일을 첨부 파일로 전달하고 대상 스키마를 지정합니다. 3절에서 설명한 정규화 작업이 열 매핑 코드 없이 지시사항에 의해 수행됩니다.
using (Workbook consolidated = new Workbook())
{
    AIResult result = consolidated.AI(options).ExecuteInstruction(
        consolidated,
        "Read every regional sales workbook in the inbox and merge them into one worksheet. " +
        "Each store names its columns differently (for example Sales vs Amount, Month vs Period); " +
        "normalize them to a single schema: Store, Region, SKU, UnitsSold, Revenue, Month. Skip " +
        "duplicate header rows and save the merged result as a workbook.",
        @"C:\retail-ops\output\consolidated.xlsx",
        storeFiles);

    if (result == null || !result.Success)
        throw new InvalidOperationException($"Consolidation failed: {result?.ErrorMessage}");
}
2. 분석(Analyze). 통합된 파일을 로드하고 4절의 규칙을 자연어로 명시합니다. 에이전트는 원본 데이터를 유지한 채 Anomalies 시트를 추가합니다.
using (Workbook analysis = new Workbook())
{
    analysis.LoadFromFile(@"C:\retail-ops\output\consolidated.xlsx");

    AIResult result = analysis.AI(options).ExecuteInstruction(
        analysis,
        "Add an 'Anomalies' sheet. Compare each store and SKU's Revenue against the prior " +
        "month, flag rows where revenue fell by more than 30% or grew by more than 50%, apply " +
        "a red fill to declines and a green fill to jumps, and add a 'Cause' column with a " +
        "one-sentence likely explanation. Leave the original data sheets unchanged.",
        @"C:\retail-ops\output\analyzed.xlsx");

    if (result == null || !result.Success)
        throw new InvalidOperationException($"Analysis failed: {result?.ErrorMessage}");
}
소스 데이터와 함께 생성된 Anomalies 시트에는 지시사항에 따라 플래그가 지정된 행, 셀 채우기 색상 및 Cause 열이 추가됩니다.
3. 보고서 생성(Report). 5절의 경영진 요약 보고서를 구성하고 내보냅니다. savePath의 확장자 지정만으로 형식이 결정됩니다(여기서는 .xlsx, 배포용은 .pdf).
using (Workbook report = new Workbook())
{
    report.LoadFromFile(@"C:\retail-ops\output\analyzed.xlsx");

    AIResult result = report.AI(options).ExecuteInstruction(
        report,
        "Produce a management report. Add a 'Summary' sheet at the front with a KPI block " +
        "(total revenue, top store, bottom store, count of flagged anomalies), a monthly trend " +
        "table, and a bar chart of revenue by region. Format it for print and save the finished " +
        "workbook.",
        @"C:\retail-ops\output\monthly-report.xlsx");

    if (result == null || !result.Success)
        throw new InvalidOperationException($"Report generation failed: {result?.ErrorMessage}");
}
워크북 맨 앞에 Summary 시트가 추가되어 인쇄나 PDF 내보내기가 가능한 상태로 완성됩니다.
주요 API 호출
Workbook.AI(options)— 기존 워크북 객체에 AI 문서 프로세서를 연결합니다.ExecuteInstruction(doc, instruction, savePath, attachments)— 단계를 실행하고 결과를 작성합니다.AIResult.Success/AIResult.ErrorMessage— 각 단계를 검증하고 오류 발생 시 내용을 확인합니다.
에이전트가 없을 때 작성해야 하는 코드
대조적으로, 동일한 3단계를 수행하기 위한 기존 SDK 방식은 문자열로 각 열을 찾고, 모든 임계값을 하드코딩하며, 셀별로 서식을 지정해야 합니다. 그리고 매장이 열 이름을 바꾸거나 규칙이 변경될 때마다 모든 코드를 다시 수정해야 합니다.
foreach (string file in storeFiles)
{
    Workbook wb = new Workbook();
    wb.LoadFromFile(file);
    Worksheet sheet = wb.Worksheets[0];

    // 매장이 열 이름을 "Revenue" 대신 "Sales"로 지정하는 순간 오류 발생.
    int revenueCol = FindColumnByHeader(sheet, "Revenue");
    int storeCol   = FindColumnByHeader(sheet, "Store");

    for (int r = sheet.LastRow; r >= 2; r--)
    {
        double current = double.Parse(sheet.Range[r, revenueCol].Text);
        double prior   = double.Parse(sheet.Range[r, revenueCol + 1].Text);
        double change  = (current - prior) / prior;

        // 하드코딩된 임계값; 계절성 매장의 경우 잘못된 알림 발생.
        if (change < -0.30) sheet.Range[r, revenueCol].Style.Color = Color.Red;
    }
    // ... 이후 병합, 요약 작성, 차트 생성 등 매장 및 월별로 수백 줄의 코드가 필요함.
}
에이전트가 코드의 필요성을 완전히 없애는 것은 아닙니다. 데이터 매핑 코드를 작성할 필요성을 없애주는 것입니다. 차이점은 로직이 위치하는 곳입니다. 열 검색 로직과 임계값 코드에 존재하는 대신, 비즈니스 담당자가 읽고 수정할 수 있는 문장에 존재하게 됩니다.
7. AI의 한계와 애플리케이션 로직의 역할
가능과 불가능의 단순 목록보다 한계를 이해하는 더 현실적인 시각은 다음과 같습니다. AI 에이전트는 결정론적인 애플리케이션 로직을 대체하는 것이 아니라, 그 위에서 작동합니다.
애플리케이션은 여전히 스프레드시트의 의미 해석과 관련 없는 다음 항목들을 담당합니다.
- 파일 검색 및 접근 권한 — 수신함 파일 검색, 권한 확인 및 파일 준비
- 워크플로우 스케줄링 — 보고서 실행 시점, 트리거 조건 및 실행 순서
- 데이터 소스 제어 — 어떤 파일이 승인된 입력값인지 및 출처 관리
- 오류 처리 및 재시도 — 파일 누락 또는 특정 단계 실패 시 대처 로직
- 최종 승인 — 최종 제출 전 사람이 감지된 이상 징후를 검토
- 외부 데이터 대조 — 생성된 보고서를 원장 시스템(System of Record)과 대조
에이전트는 의미적(Semantic) 해석이 필요한 영역을 전담합니다.
- 이해 — 각 열의 실제 의미 파악
- 정규화 — 서로 다른 스키마를 하나의 모델로 정렬
- 해석 — 비즈니스 규칙을 적용하여 이상 항목 판단
- 변환 — 원시 데이터를 요약, 차트 및 서식으로 변환
- 구성 — 최종 워크북 또는 PDF 완성
이러한 역할 분담은 엔지니어링 리소스를 어디에 투입해야 하는지 명확히 알려줍니다. 검증과 감사가 필요한 결정론적 플러밍(Plumbing) 코드는 프로그래밍 코드로 유지하고, 의미적 해석 작업은 에이전트에게 맡기는 것입니다. 각 영역이 가장 잘하는 역할을 수행하게 됩니다.
8. 기존 .NET Excel 워크플로우에 AI 추가하기
마지막으로 명확히 할 점은 이 환경을 구축하기 위해 기존 코드를 재작성할 필요가 거의 없다는 것입니다. 이미 Spire.Xls를 통해 Excel을 다루고 있는 애플리케이션이라면, 기존 문서 모델이 바로 통합 포인트가 됩니다.
Workbook
   ↓
Workbook.AI(options)
   ↓
ExecuteInstruction(...)
새로운 문서 레이어나 별도의 문서 처리 서비스를 도입할 필요가 없습니다. 기존에 사용하던 Workbook 객체에 자연어 실행 레이어를 추가하기만 하면 됩니다. 파일을 열고, 병합하고, 저장하던 동일한 객체가 이제 지시사항을 받아 워크플로우를 수행하며, 결정론적 Excel 엔진이 병합된 셀, 숫자 서식, 차트 등이 온전히 유지된 올바른 형태의 파일을 출력하도록 보장합니다. 동일한 ExecuteInstruction 패턴은 Word 및 PDF 문서에도 확장 적용할 수 있습니다. 자세한 내용은 C#을 활용한 AI 계약서 검토를 참조하세요.
이것이 Excel 개발자를 위한 핵심 가치 제안입니다. "새로운 AI 플랫폼을 도입하는 것"이 아니라 "기존에 사용하던 워크북이 지시사항을 이해하도록 만드는 것"입니다. 매장이 열 이름을 바꾸거나 재무팀이 플래그 설정 규칙을 변경할 때, 해결책은 문서 파이프라인을 다시 빌드하는 것이 아니라 문장 하나를 수정하는 것입니다.
9. 자주 묻는 질문(FAQ)
Excel 데이터를 클라우드로 전송해야 하나요?
반드시 그렇지는 않습니다. Spire.Agent.Office는 사용자 애플리케이션 내부에서 실행되므로 SDK와 문서 처리 로직이 자체 환경 내에 유지됩니다. 즉, 저장이나 변환을 위해 파일이 제3자 서비스로 업로드되지 않습니다. 콘텐츠를 분석하려면 AI 모델에 관련 데이터가 전달되어야 하며, 이는 모든 AI 워크플로우의 필수적인 과정입니다. 로컬 네트워크에 자체 AI 모델을 구축한 경우 데이터는 완전히 자체 인프라 내에 머물게 됩니다. OpenAI 또는 Azure OpenAI와 같은 호스팅된 모델 API를 연동하는 경우 설정에 따라 관련 데이터가 해당 공급업체로 전송됩니다.
어떤 Excel 형식을 지원하나요?
입력 파일로는 XLSX, XLS 등 표준 워크북 파일을 지원하며, 에이전트가 기본 형식 그대로 직접 읽어들입니다. 출력 결과물은 XLSX, XLS, CSV, PDF 또는 HTML로 저장할 수 있으므로 완성된 보고서를 아카이브나 배포 목록으로 즉시 보낼 수 있습니다.
재무 또는 운영 검토 작업을 완전히 대체할 수 있나요?
아닙니다. 에이전트는 읽기, 정규화, 분석, 서식 지정 등 분석가가 매달 소요하는 정리 작업을 자동화하지만, 최종 승인은 여전히 사람이 수행해야 합니다. 감지된 이상 항목은 이미 결정된 결론이 아니라 검토를 위한 요약 목록으로 활용해야 합니다.
ChatGPT에 데이터를 붙여넣는 것과 무엇이 다른가요?
대화형 모델은 이상 항목이 무엇인지 알려줄 수는 있지만, 그 결과를 요약 시트, 조건부 서식, 차트가 포함된 워크북으로 구성하거나 PDF로 내보낼 수 없습니다. AI Excel 에이전트는 언어 모델의 판단력과 결정론적 Excel 레이어를 결합하여, 팀이 즉시 열고 공유할 수 있는 완성된 실제 파일을 출력합니다.
자체 AI 모델을 사용할 수 있나요?
네, 가능합니다. Spire.Agent.Office는 유연한 AI 모델 연동을 지원하며, 호스팅된 모델 API 및 사설 구축(On-Premise) 모델을 포함한 주요 AI 인프라와 호환됩니다. 에이전트가 자체 엔드포인트를 바라보도록 설정할 수 있습니다. 배포 환경에서 지원되는 공급업체에 대한 문의는 문의하기를 통해 확인해 주세요.
Excel 보고서 자동화를 시작할 준비가 되셨나요?
데이터 통합, 이상 징후 분석, 보고서 생성은 AI를 통해 가장 빠르게 성과를 낼 수 있는 분야입니다. 수신함을 지정하고, 보고서를 설명하면 서식이 완료된 워크북이나 PDF를 얻을 수 있습니다. 시작하기 튜토리얼을 따라 .NET에서 첫 번째 스프레드시트 워크플로우를 실행해 보세요.
추가 자료
- 학생 점수 분석 및 순위 매기기 자동화 튜토리얼 -- 에이전트가 종단 간 실행하는 Excel 워크플로우
- C#을 활용한 AI 계약서 검토 -- Word 및 PDF 문서에 적용된 지시사항 기반 패턴
- Spire.Agent.Office 제품 개요 -- 모든 Office 문서 형식을 지원하는 AI 에이전트 SDK
Automazione della generazione di report Excel con un agente IA in C#
Indice
AI per Excel in C# significa abbinare la capacità di valutazione di un modello linguistico a una reale libreria di elaborazione Excel all'interno di un'applicazione .NET, in modo che l'applicazione possa unire, normalizzare, analizzare e formattare i dati del foglio di calcolo a partire da istruzioni in linguaggio naturale invece di codice colonna per colonna. La parte difficile del reporting Excel raramente è stata il disegno del grafico finale: è trasformare una serie di cartelle di lavoro di origine incoerenti in dati di cui ci si possa effettivamente fidare. Con un agente AI descrivi l'attività di reporting ("unisci queste 20 cartelle di lavoro dei negozi e segnala i negozi il cui fatturato è sceso di oltre il 30%") e ottieni in cambio una cartella di lavoro formattata, non una risposta di chat. Spire.Agent.Office fornisce entrambe le metà: la comprensione del linguaggio e un livello documentale deterministico che garantisce l'uscita di un vero file .xlsx (o PDF).
Navigazione rapida
- Da cartelle di lavoro eterogenee a un modello dati comune
- Trasformare le regole aziendali in analisi in linguaggio naturale
- Dall'analisi a un report pronto per la direzione
- Creazione del flusso di lavoro in C#
- FAQ
1. Il vero collo di bottiglia nell'automazione dei report Excel
Prendiamo il compito ricorrente alla base della maggior parte delle richieste di "reporting mensile". Un team operativo gestisce 20 negozi regionali e ogni negozio invia una cartella di lavoro sulle vendite a fine mese. In teoria si tratta di un solo report. In pratica sono venti file diversi che condividono per caso una struttura nel nome del file:
- Le colonne non corrispondono. Un negozio chiama la cifra
Revenue, un altroSales Amount, un terzoNet Sales. - Il layout non corrisponde. Un negozio inserisce i mesi nelle colonne, un altro nelle righe, un terzo aggiunge una colonna di note nel mezzo.
- I tipi di dati non corrispondono. Le date arrivano come testo, i numeri arrivano come migliaia e almeno un negozio unisce una riga di titolo nell'intestazione.
Quindi, prima che chiunque possa produrre un grafico per la direzione, un analista trascorre la settimana ad aprire file, mappare colonne, normalizzare date, cercare refusi e solo dopo verificare le anomalie e assemblare il report. Niente di tutto questo fa parte della "generazione del report". È tutta preparazione dei dati.
Il punto da comprendere a fondo: la parte difficile del reporting Excel raramente è la creazione del grafico finale. È trasformare cartelle di lavoro di origine incoerenti in dati di cui ci si possa effettivamente fidare. Una libreria di grafici traccerà felicemente dati errati; ciò che manca al team è un percorso affidabile dai file grezzi ricevuti a una tabella pulita e confrontabile. Quel percorso è esattamente dove un agente AI cambia le regole del gioco.
2. Cosa cambia quando un agente AI entra nel flusso di lavoro
L'automazione di questo compito non è una novità, è solo normalmente costosa. Confrontiamo i due flussi di lavoro:
Automazione tradizionale
Ispeziona i file
→ mappa le colonne
→ normalizza i dati
→ scrivi le regole
→ genera la cartella di lavoro
Ogni passaggio prima dell'ultimo è predefinito: si scrive una mappatura delle colonne per ogni intestazione nota, un parser di date per ogni formato noto e una soglia per ogni regola. Nel momento in cui un negozio rinomina una colonna o cambia una regola aziendale, la mappatura e le regole diventano errate e l'intervento umano torna ad essere necessario.
Automazione con agente
Descrivi l'attività di reporting
→ fornisci le cartelle di lavoro di origine
→ rivedi il risultato
L'agente legge il significato di ciascuna cartella di lavoro anziché basarsi su una posizione fissa, quindi la mappatura delle colonne e l'insieme di regole non devono più essere enumerati in anticipo. Ciò che rimuove è precisamente la parte più onerosa: il lavoro di predefinire uno schema e un insieme di regole che si interromperanno al file successivo.
Il resto di questo articolo esamina la pipeline dall'inizio alla fine, dalle cartelle di lavoro grezze a un PDF stampato, utilizzando lo scenario dei 20 negozi come esempio pratico. Le sezioni da 3 a 5 spiegano cosa fa l'agente in ciascuna fase; la sezione 6 fornisce il codice C# completo che la gestisce.
3. Da cartelle di lavoro eterogenee a un modello dati comune
La versione del problema specifica per Excel è che cartelle di lavoro diverse "sembrano uguali" senza esserlo davvero. Tre negozi possono inviare ciascuno una tabella con quattro colonne e non offrire comunque alcun modo di unirle senza l'interpretazione umana:
| Negozio A | Negozio B | Negozio C |
|---|---|---|
| Revenue | Sales Amount | Net Sales |
| Month | Reporting Period | Date |
| Units | Quantity Sold | Qty |
Non esiste un indice di colonna che le mappi l'una sull'altra, perché la mappatura è semantica, non posizionale. Revenue, Sales Amount e Net Sales sono tre nomi per lo stesso concetto, e solo la comprensione dell'intestazione consente di allinearli.
La fase di consolidamento dell'agente trasforma quell'allineamento semantico in un unico schema:
Store / Region / SKU / UnitsSold / Revenue / Month
Legge ogni cartella di lavoro di origine, risolve i nomi delle intestazioni rispetto a quel modello di destinazione, allinea righe e colonne, salta le righe di intestazione e titolo duplicate e scrive una tabella normalizzata. Lo sviluppatore non deve mai scrivere una routine FindColumnByHeader("Revenue"): l'istruzione specifica lo schema target e l'agente elabora la mappatura da ciascun file.
Questa è la fase con il massimo ritorno immediato, perché è quella che attualmente richiede più tempo all'analista e che si blocca più spesso quando si aggiunge un nuovo negozio.
4. Trasformare le regole aziendali in analisi in linguaggio naturale
Una volta che i dati sono raccolti in un unico posto, il reporting richiede valutazione, ed è proprio nella valutazione che le regole hardcoded falliscono. L'esempio in esame utilizza una tipica regola finanziaria:
Segnala le righe in cui il fatturato è sceso di oltre il 30% o è cresciuto di oltre il 50% rispetto al mese precedente.
Notate quanti elementi sono racchiusi in quella frase e quanto sia complessa ciascuna parte se tradotta in codice:
- Perché il 30% e il 50%? Sono soglie aziendali legate a un contesto: un negozio stagionale, un nuovo SKU o una promozione modificano il significato di "insolito". Una condizione hardcoded
if (change < -0.30)tratta ogni negozio allo stesso modo e genera falsi allarmi sulla stagionalità. - Come si modifica? Nel codice, occorre ricompilare ed eseguire nuovamente il deployment. Nell'istruzione, l'analista modifica semplicemente una frase: "sceso di oltre il 20%", oppure "solo per la regione Est", oppure "segnala solo gli SKU con più di 100 unità vendute".
- Aggiungere una dimensione? Si desidera applicare la regola per negozio e per regione e per mese? Si aggiunge una clausola all'istruzione, non un ciclo annidato.
- Spiegare il risultato? L'agente può aggiungere una colonna
Causecon una probabile spiegazione in una sola frase per ciascuna riga segnalata — qualcosa che un semplice confronto di soglie non potrebbe mai produrre.
Il principio che emerge da questa sezione merita di essere enunciato chiaramente:
Il codice definisce il come; le istruzioni definiscono il cosa.
Lo sviluppatore smette di codificare la regola e inizia a descrivere il risultato. La regola rimane leggibile, modificabile dal business e sopravvive all'aggiunta di un nuovo negozio o a un cambio di soglia senza richiedere modifiche al codice.
Per un esempio completo ed esercitato della stessa analisi basata su istruzioni applicata a un flusso di lavoro di graduatoria, consultare il tutorial sull'Analisi e Classificazione dei Punteggi degli Studenti.
5. Dall'analisi a un report pronto per la direzione
Trovare le anomalie è solo metà del lavoro di reporting. Il risultato deve comunque diventare una cartella di lavoro che qualcuno possa effettivamente utilizzare: il foglio di calcolo dell'analista non è il deliverable finale; lo è il riepilogo per la direzione.
La pipeline si completa in questo modo:
Cartelle di lavoro grezze
      ↓
Dati consolidati
      ↓
Anomalie
      ↓
Riepilogo per la direzione
      ↓
PDF
L'istruzione finale compone il documento finale: un foglio Summary all'inizio con un blocco KPI (fatturato totale, miglior negozio, peggior negozio, conteggio delle anomalie segnalate), una tabella con il trend mensile, un grafico a barre del fatturato per regione e una formattazione pronta per la stampa. Indirizzando la stessa istruzione su un percorso .pdf si esporta l'identico report in formato PDF per la distribuzione, senza alcuna fase di rendering separata.
Il concetto chiave da ricordare: l'analisi e la composizione sono due compiti diversi e l'agente li esegue entrambi. Il lavoro dell'analista diventa la revisione della selezione di elementi segnalati e la relativa approvazione, anziché la ricostruzione del report ogni mese.
6. Creazione del flusso di lavoro in C#
Tutti i componenti sopra descritti sono gestiti da una sola pipeline C#. È sufficiente configurare l'agente una volta e poi eseguire tre istruzioni in sequenza: consolida, analizza, rendiconta. La configurazione completa (token, pacchetti e collegamento del progetto) è documentata passo dopo passo nel tutorial Guida introduttiva; qui ci concentriamo sul flusso di lavoro stesso.
using System.IO;
using Spire.Xls;
using Spire.Agent.Office.AI;
using Spire.Agent.Office.Extensions;

AIOptions options = new AIOptions {
    SpireToken = spireToken,
    WorkDir = @"C:\retail-ops\output",
    TimeoutMs = 300000
};

string[] storeFiles = Directory.GetFiles(@"C:\retail-ops\inbox", "*.xlsx");
Directory.CreateDirectory(@"C:\retail-ops\output");
1. Consolida. Passa i 20 file della cartella inbox come allegati e indica lo schema di destinazione. La normalizzazione descritta nella sezione 3 avviene qui, guidata dall'istruzione anziché da una mappatura delle colonne:
using (Workbook consolidated = new Workbook())
{
    AIResult result = consolidated.AI(options).ExecuteInstruction(
        consolidated,
        "Leggi ogni cartella di lavoro delle vendite regionali nella cartella inbox e uniscile in un unico foglio di lavoro. " +
        "Ogni negozio denomina le colonne diversamente (ad esempio Sales rispetto ad Amount, Month rispetto a Period); " +
        "normalizzale in un unico schema: Store, Region, SKU, UnitsSold, Revenue, Month. Salta " +
        "le righe di intestazione duplicate e salva il risultato unito come cartella di lavoro.",
        @"C:\retail-ops\output\consolidated.xlsx",
        storeFiles);

    if (result == null || !result.Success)
        throw new InvalidOperationException($"Consolidation failed: {result?.ErrorMessage}");
}
2. Analizza. Carica il file consolidato ed esprimi la regola descritta nella sezione 4 in linguaggio naturale. L'agente aggiunge un foglio Anomalies e lascia inalterati i dati di origine:
using (Workbook analysis = new Workbook())
{
    analysis.LoadFromFile(@"C:\retail-ops\output\consolidated.xlsx");

    AIResult result = analysis.AI(options).ExecuteInstruction(
        analysis,
        "Aggiungi un foglio 'Anomalies'. Confronta il fatturato (Revenue) di ciascun negozio e SKU rispetto al mese " +
        "precedente, segnala le righe in cui il fatturato è sceso di oltre il 30% o è cresciuto di oltre il 50%, applica " +
        "un riempimento rosso ai cali e un riempimento verde agli aumenti, e aggiungi una colonna 'Cause' con " +
        "una probabile spiegazione in una sola frase. Lascia invariati i fogli dati originali.",
        @"C:\retail-ops\output\analyzed.xlsx");

    if (result == null || !result.Success)
        throw new InvalidOperationException($"Analysis failed: {result?.ErrorMessage}");
}
Il foglio Anomalies viene affiancato ai dati di origine, con le righe segnalate, i riempimenti e la colonna Cause applicati dall'istruzione:
3. Rendiconta. Componi il riepilogo per la direzione descritto nella sezione 5 ed esportalo. Il solo parametro savePath determina il formato — .xlsx in questo caso, .pdf per la distribuzione:
using (Workbook report = new Workbook())
{
    report.LoadFromFile(@"C:\retail-ops\output\analyzed.xlsx");

    AIResult result = report.AI(options).ExecuteInstruction(
        report,
        "Produci un report per la direzione. Aggiungi un foglio 'Summary' all'inizio con un blocco KPI " +
        "(fatturato totale, miglior negozio, peggior negozio, conteggio delle anomalie segnalate), una tabella " +
        "del trend mensile e un grafico a barre del fatturato per regione. Formattalo per la stampa e salva " +
        "la cartella di lavoro completata.",
        @"C:\retail-ops\output\monthly-report.xlsx");

    if (result == null || !result.Success)
        throw new InvalidOperationException($"Report generation failed: {result?.ErrorMessage}");
}
Il foglio Summary viene posizionato all'inizio della cartella di lavoro, pronto per la stampa o l'esportazione in PDF:
Chiamate API principali
Workbook.AI(options)— allega il processore di documenti AI a un oggetto workbook esistenteExecuteInstruction(doc, instruction, savePath, attachments)— esegue una fase e scrive il risultatoAIResult.Success/AIResult.ErrorMessage— verifica ciascuna fase ed evidenzia gli errori
Cosa bisognerebbe scrivere senza l'agente
Per un confronto, l'approccio SDK tradizionale per le stesse tre fasi individua ciascuna colonna tramite la stringa dell'intestazione, imposta ogni soglia nel codice e definisce ogni riempimento cella per cella — richiedendo la ricalibrazione di tutto quando un negozio rinomina una colonna o la regola cambia:
foreach (string file in storeFiles)
{
    Workbook wb = new Workbook();
    wb.LoadFromFile(file);
    Worksheet sheet = wb.Worksheets[0];

    // Fallisce nel momento in cui un negozio chiama la colonna "Sales" invece di "Revenue".
    int revenueCol = FindColumnByHeader(sheet, "Revenue");
    int storeCol   = FindColumnByHeader(sheet, "Store");

    for (int r = sheet.LastRow; r >= 2; r--)
    {
        double current = double.Parse(sheet.Range[r, revenueCol].Text);
        double prior   = double.Parse(sheet.Range[r, revenueCol + 1].Text);
        double change  = (current - prior) / prior;

        // Una soglia hardcoded; un negozio stagionale genera falsi allarmi.
        if (change < -0.30) sheet.Range[r, revenueCol].Style.Color = Color.Red;
    }
    // ... poi unione, poi riepilogo, poi grafico -- centinaia di righe per negozio e per mese.
}
L'agente non elimina la necessità di codice — elimina la necessità di codice di mappatura. La differenza sta in dove risiede la logica: in un rilevatore di colonne e una soglia, oppure in una frase che il business può leggere e modificare.
7. Dove l'AI si ferma e inizia la logica dell'applicazione
Un modo più realistico di considerare il confine rispetto a un elenco di ciò che "può e non può fare": l'agente non elimina la logica deterministica dell'applicazione — si posiziona al di sopra di essa.
L'applicazione gestisce comunque tutto ciò che non ha a che fare con la comprensione del foglio di calcolo:
- Individuazione e accesso ai file — individuare i file della cartella inbox, verificare i permessi e prepararli
- Pianificazione del flusso di lavoro — quando viene eseguito il report, con quale trigger e in quale ordine
- Controllo delle fonti dati — quali file sono input autorizzati e da dove provengono
- Gestione degli errori e tentativi di ripristino — cosa succede quando un file è mancante o una fase fallisce
- Approvazione finale — un operatore umano esamina le anomalie segnalate prima dell'approvazione
- Riconciliazione esterna — confronto del report con un sistema di registrazione di riferimento
L'agente gestisce le parti genuinamente semantiche:
- Comprensione — lettura del reale significato di ciascuna colonna
- Normalizzazione — allineamento di schemi eterogenei in un unico modello
- Interpretazione — applicazione di una regola aziendale per decidere cosa è insolito
- Trasformazione — conversione dei dati grezzi in un riepilogo, un grafico e formattazione
- Composizione — assemblaggio della cartella di lavoro finale o del PDF
Questa impostazione è più utile di una tabella delle funzionalità perché indica dove concentrare lo sforzo ingegneristico. Mantenete la struttura deterministica nel codice — dove è testabile e verificabile — e affidate il lavoro semantico all'agente. Ciascuna parte fa ciò in cui riesce meglio.
8. Aggiungere l'AI a un flusso di lavoro Excel .NET esistente
L'ultimo aspetto che vale la pena esplicitare è quanto poco sia necessario ricostruire per raggiungere questo risultato. Se la vostra applicazione funziona già con Excel tramite Spire.Xls, il modello documentale che già possedete rappresenta il punto di integrazione:
Workbook
   ↓
Workbook.AI(options)
   ↓
ExecuteInstruction(...)
Non state introducendo un nuovo livello documentale o un servizio di elaborazione documenti separato. State aggiungendo un livello di esecuzione in linguaggio naturale all'oggetto Workbook che già possedete. Lo stesso oggetto che aprirà, unirà e salverà i vostri file accetta ora un'istruzione ed esegue il flusso di lavoro, con il motore Excel deterministico che garantisce che l'output sia un file reale e ben formato — celle unite, formati numerici e grafici compresi. Lo stesso modello ExecuteInstruction si estende ai documenti Word e PDF — vedere Revisione dei contratti con AI in C#.
Questa è la proposta di valore per uno sviluppatore Excel, espressa nei termini in cui già ragiona: non "adottare una piattaforma AI", ma "insegnare alla cartella di lavoro che già si utilizza a ricevere istruzioni". Quando un negozio rinomina una colonna o il team finanziario modifica la regola di segnalazione, la soluzione consiste nella modifica di una frase, non nella ricostruzione della pipeline documentale.
9. FAQ
Devo inviare i miei dati Excel al cloud?
Non necessariamente. Spire.Agent.Office viene eseguito direttamente dalla tua applicazione, quindi l'SDK e l'elaborazione dei documenti rimangono all'interno del tuo ambiente; i tuoi file non vengono caricati su un servizio di terze parti per l'archiviazione o la conversione. Per analizzare i contenuti, l'AI necessita dei dati pertinenti, che vengono inviati al modello per l'elaborazione — un passaggio intrinseco di qualsiasi flusso di lavoro AI. Se distribuisci un tuo modello sulla tua rete locale, il contenuto rimane interamente all'interno della tua infrastruttura. Se ti colleghi tramite un'API di un modello ospitato come OpenAI o Azure OpenAI, i contenuti pertinenti vengono trasmessi a tale provider tramite la rete in base alla tua configurazione.
Quali formati Excel sono supportati?
L'input supporta i file di cartella di lavoro standard come XLSX e XLS e l'agente legge la cartella di lavoro direttamente nel suo formato nativo. L'output può essere salvato come XLSX, XLS, CSV, PDF o HTML, consentendo di inviare il report finale direttamente ad un archivio o a un elenco di distribuzione.
Può sostituire la revisione finanziaria o operativa?
No. L'agente automatizza la lettura, la normalizzazione, l'analisi e la formattazione — le ore che un analista dedica ogni mese —, ma l'approvazione finale rimane a carico di un revisore umano. Le anomalie segnalate vanno considerate come un elenco di elementi da verificare, non come una decisione già presa.
In che modo questo differisce dall'incollare i miei dati in ChatGPT?
Un modello di chat può indicare cosa appare insolito, ma non può inserire tale risposta in una cartella di lavoro formattata con un foglio di riepilogo, formattazione condizionale e un grafico, né può esportare un PDF. Un agente AI per Excel unisce la capacità di valutazione del modello linguistico a un livello Excel deterministico, in modo che l'output sia un file reale e ben formato che il team può aprire e distribuire.
Posso utilizzare un mio modello AI?
Sì. Spire.Agent.Office supporta l'integrazione flessibile con modelli AI ed è compatibile con le principali infrastrutture AI, comprese le API di modelli ospitati e modelli distribuiti privatamente. È possibile indirizzare l'agente verso il proprio endpoint. Per domande relative ai provider supportati nella propria distribuzione, contattaci.
Pronto ad automatizzare i tuoi report Excel?
Consolidamento, analisi delle anomalie e generazione di report sono i punti in cui ottenere valore più rapidamente: indirizza l'agente sulla cartella inbox, descrivi il report e ottieni una cartella di lavoro o un PDF formattato. Segui il tutorial Guida introduttiva per eseguire il tuo primo flusso di lavoro su fogli di calcolo in .NET.
Ulteriori letture
- Tutorial sull'automatizzazione dell'analisi e classificazione dei punteggi degli studenti -- un flusso di lavoro Excel che l'agente esegue dall'inizio alla fine
- Revisione dei contratti con AI in C# -- lo stesso modello basato su istruzioni applicato a documenti Word e PDF
- Panoramica del prodotto Spire.Agent.Office -- SDK con agente AI per ogni formato di documento Office
Automatisation de la génération de rapports Excel avec un agent IA en C#
Table des matières
L'IA pour Excel en C# consiste à associer le jugement d'un modèle de langage à une véritable bibliothèque de traitement Excel au sein d'une application .NET. Ainsi, l'application peut fusionner, normaliser, analyser et mettre en forme des données de feuilles de calcul à partir d'instructions en langage naturel plutôt que par du code colonne par colonne. La partie difficile des rapports Excel n'a jamais été de créer le graphique final, mais de transformer une pile de classeurs sources incohérents en données fiables. Avec un agent IA, vous décrivez la tâche de reporting (« fusionnez ces 20 classeurs de magasins et signalez les magasins dont le chiffre d'affaires a chuté de plus de 30 % ») et vous obtenez un classeur mis en forme, pas seulement une réponse de chat. Spire.Agent.Office fournit les deux volets : la compréhension du langage et une couche documentaire déterministe qui garantit la création d'un fichier .xlsx (ou PDF) réel.
Navigation rapide
- Des classeurs hétérogènes à un modèle de données commun
- Transformer les règles métier en analyse en langage naturel
- De l'analyse à un rapport prêt pour la direction
- Construire le flux de travail en C#
- FAQ
1. Le véritable goulot d'étranglement dans l'automatisation des rapports Excel
Prenons la tâche récurrente derrière la plupart des demandes de « rapports mensuels ». Une équipe opérationnelle gère 20 magasins régionaux, et chaque magasin envoie un classeur de ventes à la fin du mois. En théorie, il s'agit d'un seul rapport. En pratique, ce sont vingt fichiers différents qui partagent par hasard un modèle de nom de fichier :
- Les colonnes ne correspondent pas. Un magasin appelle le chiffre
Revenu, un autreMontant des ventes, un troisièmeVentes nettes. - La mise en page ne correspond pas. Un magasin place les mois en colonnes, un autre en lignes, un troisième ajoute une colonne de notes au milieu.
- Les types de données ne correspondent pas. Les dates arrivent sous forme de texte, les nombres arrivent en milliers, et au moins un magasin fusionne une ligne de titre dans l'en-tête.
Ainsi, avant que quiconque puisse produire un graphique pour la direction, un analyste passe la semaine à ouvrir des fichiers, mapper les colonnes, normaliser les dates, traquer les fautes de frappe, et seulement ensuite vérifier les anomalies et assembler le rapport. Rien de tout cela ne relève de la « génération de rapport ». Tout cela n'est que préparation des données.
Le point à retenir : la partie difficile des rapports Excel est rarement la création du graphique final. C'est transformer des classeurs sources incohérents en données réellement fiables. Une bibliothèque de graphiques tracera volontiers des données erronées ; ce qui manque à l'équipe, c'est un chemin fiable entre les fichiers bruts de la boîte de réception et un tableau propre et comparable. C'est exactement là qu'un agent IA change la donne économique.
2. Ce qui change lorsqu'un agent IA entre dans le flux de travail
L'automatisation de cette tâche n'est pas nouvelle, elle est simplement coûteuse en temps normal. Comparez les deux flux de travail :
Automatisation traditionnelle
Inspecter les fichiers
→ mapper les colonnes
→ normaliser les données
→ écrire les règles
→ générer le classeur
Chaque étape avant la dernière est prédéfinie : vous écrivez un mappage de colonnes pour chaque en-tête connu, un analyseur de dates pour chaque format connu, et un seuil pour chaque règle. Dès qu'un magasin renomme une colonne ou qu'une règle métier change, le mappage et les règles sont faux, et un humain doit intervenir à nouveau.
Automatisation par agent
Décrire la tâche de reporting
→ fournir les classeurs sources
→ examiner le résultat
L'agent lit la signification de chaque classeur plutôt qu'une position fixe, de sorte que le mappage des colonnes et l'ensemble des règles n'ont plus besoin d'être énumérés à l'avance. Ce qu'il supprime, c'est précisément la partie coûteuse : le travail de prédéfinition d'un schéma et d'un ensemble de règles qui seront obsolètes au prochain fichier.
Le reste de cet article parcourt ce pipeline une fois, des classeurs bruts à un PDF imprimé, en utilisant le scénario des 20 magasins comme exemple fil rouge. Les sections 3 à 5 expliquent ce que fait l'agent à chaque étape ; la section 6 fournit le code C# complet qui le pilote.
3. Des classeurs hétérogènes à un modèle de données commun
La version spécifique à Excel du problème est que différents classeurs « semblent identiques » sans l'être réellement. Trois magasins peuvent chacun envoyer un tableau avec quatre colonnes et ne vous donner aucun moyen de les fusionner sans interprétation humaine :
| Magasin A | Magasin B | Magasin C |
|---|---|---|
| Revenu | Montant des ventes | Ventes nettes |
| Mois | Période de rapport | Date |
| Unités | Quantité vendue | Qté |
Il n'y a pas d'index de colonne qui les mappe les uns aux autres, car le mappage est sémantique, pas positionnel. Revenu, Montant des ventes et Ventes nettes sont trois noms pour le même concept, et seule la compréhension de l'en-tête permet de les aligner.
L'étape de consolidation de l'agent transforme cet alignement sémantique en un schéma unique :
Magasin / Région / SKU / UnitésVendues / Revenu / Mois
Il lit chaque classeur source, résout les noms d'en-tête par rapport à ce modèle cible, aligne les lignes et les colonnes, ignore les lignes d'en-tête et de titre en double, et écrit un tableau normalisé. Le développeur n'écrit jamais de routine FindColumnByHeader("Revenu") — l'instruction nomme le schéma cible, et l'agent détermine le mappage à partir de chaque fichier.
C'est l'étape avec le gain ponctuel le plus important, car c'est celle qui consomme actuellement le plus de temps aux analystes et qui échoue le plus souvent lorsqu'un nouveau magasin rejoint le réseau.
4. Transformer les règles métier en analyse en langage naturel
Une fois les données au même endroit, le reporting nécessite du jugement, et le jugement est là où les règles codées en dur échouent. L'exemple utilisé ici repose sur une règle financière typique :
Signaler les lignes où le revenu a chuté de plus de 30 % ou a augmenté de plus de 50 % par rapport au mois précédent.
Remarquez tout ce qui est contenu dans cette phrase, et à quel point chaque partie est maladroite sous forme de code :
- Pourquoi 30 % et 50 % ? Ce sont des seuils métier avec un contexte — un magasin saisonnier, un nouveau SKU ou une promotion changent ce que signifie « inhabituel ». Un
if (change < -0.30)codé en dur traite chaque magasin de manière identique et déclenche de fausses alertes dues à la saisonnalité. - Comment le modifier ? Dans le code, vous recompilez et redéployez. Dans l'instruction, l'analyste modifie une phrase : « a chuté de plus de 20 % », ou « uniquement pour la région Est », ou « signaler uniquement les SKU avec plus de 100 unités vendues ».
- Ajouter une dimension ? Vous voulez que la règle soit appliquée par magasin et par région et par mois ? Vous ajoutez une clause à l'instruction, pas une boucle imbriquée.
- Expliquer le résultat ? L'agent peut ajouter une colonne
Causeavec une explication probable en une phrase pour chaque ligne signalée — quelque chose qu'une simple comparaison de seuil ne pourra jamais produire.
Le principe qui découle de cette section mérite d'être énoncé clairement :
Le code définit le comment ; les instructions définissent le quoi.
Le développeur cesse de coder la règle et commence à décrire le résultat. La règle reste lisible, modifiable par l'entreprise, et survit à l'ajout d'un nouveau magasin ou à un changement de seuil sans modification du code.
Pour un exemple complet de cette analyse pilotée par les instructions appliquée à un flux de travail de classement, consultez le tutoriel sur l'analyse et le classement des scores des étudiants.
5. De l'analyse à un rapport prêt pour la direction
Trouver des anomalies n'est que la moitié du travail de reporting. Le résultat doit encore devenir un classeur que quelqu'un peut réellement utiliser — la feuille de calcul de l'analyste n'est pas le livrable ; le résumé pour la direction l'est.
Le pipeline se complète ainsi :
Classeurs bruts
      ↓
Données consolidées
      ↓
Anomalies
      ↓
Résumé pour la direction
      ↓
PDF
L'instruction finale compose le livrable : une feuille Résumé au début avec un bloc KPI (revenu total, meilleur magasin, moins bon magasin, nombre d'anomalies signalées), un tableau de tendance mensuelle, un graphique à barres du revenu par région, et une mise en forme prête à l'impression. Pointer la même instruction vers un chemin .pdf exporte le rapport identique sous forme de PDF pour distribution, sans étape de rendu séparée.
Le point à retenir : l'analyse et la composition sont deux tâches différentes, et l'agent effectue les deux. Le travail de l'analyste devient l'examen de la liste courte des anomalies et la validation, et non la reconstruction du rapport chaque mois.
6. Construire le flux de travail en C#
Tous les éléments ci-dessus sont pilotés par un pipeline C#. Configurez l'agent une fois, puis exécutez trois instructions en séquence : consolider, analyser, rapporter. La configuration complète — jeton, packages et câblage du projet — est documentée étape par étape dans le tutoriel Démarrage ; ici, nous nous concentrons sur le flux de travail lui-même.
using System.IO;
using Spire.Xls;
using Spire.Agent.Office.AI;
using Spire.Agent.Office.Extensions;

AIOptions options = new AIOptions {
    SpireToken = spireToken,
    WorkDir = @"C:\retail-ops\output",
    TimeoutMs = 300000
};

string[] storeFiles = Directory.GetFiles(@"C:\retail-ops\inbox", "*.xlsx");
Directory.CreateDirectory(@"C:\retail-ops\output");
1. Consolider. Passez les 20 fichiers de la boîte de réception en tant que pièces jointes et nommez le schéma cible. La normalisation de la section 3 se produit ici, pilotée par l'instruction plutôt que par un mappage de colonnes :
using (Workbook consolidated = new Workbook())
{
    AIResult result = consolidated.AI(options).ExecuteInstruction(
        consolidated,
        "Lisez chaque classeur de ventes régionales dans la boîte de réception et fusionnez-les en une seule feuille de calcul. " +
        "Chaque magasin nomme ses colonnes différemment (par exemple Ventes vs Montant, Mois vs Période) ; " +
        "normalisez-les vers un schéma unique : Magasin, Région, SKU, UnitésVendues, Revenu, Mois. Ignorez " +
        "les lignes d'en-tête en double et enregistrez le résultat fusionné en tant que classeur.",
        @"C:\retail-ops\output\consolidated.xlsx",
        storeFiles);

    if (result == null || !result.Success)
        throw new InvalidOperationException($"La consolidation a échoué : {result?.ErrorMessage}");
}
2. Analyser. Chargez le fichier consolidé et énoncez la règle de la section 4 en anglais simple. L'agent ajoute une feuille Anomalies et laisse les données sources intactes :
using (Workbook analysis = new Workbook())
{
    analysis.LoadFromFile(@"C:\retail-ops\output\consolidated.xlsx");

    AIResult result = analysis.AI(options).ExecuteInstruction(
        analysis,
        "Ajoutez une feuille 'Anomalies'. Comparez le revenu de chaque magasin et SKU par rapport au mois " +
        "précédent, signalez les lignes où le revenu a chuté de plus de 30 % ou a augmenté de plus de 50 %, appliquez " +
        "un remplissage rouge aux baisses et un remplissage vert aux hausses, et ajoutez une colonne 'Cause' avec une " +
        "explication probable en une phrase. Laissez les feuilles de données originales inchangées.",
        @"C:\retail-ops\output\analyzed.xlsx");

    if (result == null || !result.Success)
        throw new InvalidOperationException($"L'analyse a échoué : {result?.ErrorMessage}");
}
La feuille Anomalies se place à côté des données sources, avec les lignes signalées, les remplissages et la colonne Cause appliqués par l'instruction :
3. Rapporter. Composez le résumé pour la direction de la section 5 et exportez-le. Le savePath choisit seul le format — .xlsx ici, .pdf pour la distribution :
using (Workbook report = new Workbook())
{
    report.LoadFromFile(@"C:\retail-ops\output\analyzed.xlsx");

    AIResult result = report.AI(options).ExecuteInstruction(
        report,
        "Produisez un rapport de gestion. Ajoutez une feuille 'Résumé' au début avec un bloc KPI " +
        "(revenu total, meilleur magasin, moins bon magasin, nombre d'anomalies signalées), un tableau de tendance " +
        "mensuelle et un graphique à barres du revenu par région. Mettez-le en forme pour l'impression et enregistrez le classeur terminé.",
        @"C:\retail-ops\output\monthly-report.xlsx");

    if (result == null || !result.Success)
        throw new InvalidOperationException($"La génération du rapport a échoué : {result?.ErrorMessage}");
}
La feuille Résumé se place au début du classeur, prête pour l'impression ou l'exportation PDF :
Appels API clés
Workbook.AI(options)— attache le processeur de document IA à un objet classeur existantExecuteInstruction(doc, instruction, savePath, attachments)— exécute une étape et écrit le résultatAIResult.Success/AIResult.ErrorMessage— vérifie chaque étape et fait remonter les échecs
Ce que vous écririez sans l'agent
Par contraste, la voie traditionnelle du SDK pour les trois mêmes étapes localise chaque colonne par chaîne d'en-tête, code en dur chaque seuil et définit chaque remplissage cellule par cellule — et doit tout reconfigurer lorsqu'un magasin renomme une colonne ou que la règle change :
foreach (string file in storeFiles)
{
    Workbook wb = new Workbook();
    wb.LoadFromFile(file);
    Worksheet sheet = wb.Worksheets[0];

    // Échoue dès qu'un magasin nomme la colonne "Ventes" au lieu de "Revenu".
    int revenueCol = FindColumnByHeader(sheet, "Revenu");
    int storeCol   = FindColumnByHeader(sheet, "Magasin");

    for (int r = sheet.LastRow; r >= 2; r--)
    {
        double current = double.Parse(sheet.Range[r, revenueCol].Text);
        double prior   = double.Parse(sheet.Range[r, revenueCol + 1].Text);
        double change  = (current - prior) / prior;

        // Un seuil codé en dur ; un magasin saisonnier déclenche de fausses alertes.
        if (change < -0.30) sheet.Range[r, revenueCol].Style.Color = Color.Red;
    }
    // ... puis fusionner, puis résumé, puis graphique -- des centaines de lignes par magasin et par mois.
}
L'agent ne supprime pas le besoin de code — il supprime le besoin de code de mappage. La différence réside dans l'endroit où vit la logique : dans un chercheur de colonne et un seuil, ou dans une phrase que l'entreprise peut lire et modifier.
7. Où s'arrête l'IA et où commence la logique applicative
Une façon plus honnête de penser à la frontière qu'une liste de « peut et ne peut pas » : l'agent n'élimine pas la logique applicative déterministe — il se place au-dessus d'elle.
L'application possède toujours tout ce qui n'a rien à voir avec la compréhension de la feuille de calcul :
- Découverte et accès aux fichiers — trouver les fichiers de la boîte de réception, vérifier les autorisations et les préparer
- Planification du flux de travail — quand le rapport s'exécute, sur quel déclencheur et dans quel ordre
- Contrôle des sources de données — quels fichiers sont des entrées autorisées et d'où ils viennent
- Gestion des erreurs et tentatives — ce qui se passe lorsqu'un fichier est manquant ou qu'une étape échoue
- Approbation finale — un humain examine les anomalies signalées avant la validation
- Réconciliation externe — faire correspondre le rapport avec un système d'enregistrement
L'agent possède les parties qui sont réellement sémantiques :
- Compréhension — lire ce que chaque colonne signifie réellement
- Normalisation — aligner des schémas hétérogènes en un seul modèle
- Interprétation — appliquer une règle métier pour décider ce qui est inhabituel
- Transformation — transformer des données brutes en un résumé, un graphique et une mise en forme
- Composition — assembler le classeur ou le PDF final
Ce cadre est plus utile qu'un tableau de capacités car il vous indique où concentrer vos efforts d'ingénierie. Gardez la plomberie déterministe dans le code — où elle est testable et auditable — et confiez le travail sémantique à l'agent. Chaque côté fait ce pour quoi il est doué.
8. Ajouter l'IA à un flux de travail Excel .NET existant
La dernière chose qui mérite d'être explicitée est le peu de choses que vous avez à reconstruire pour y arriver. Si votre application fonctionne déjà avec Excel via Spire.Xls, le modèle de document que vous possédez déjà est le point d'intégration :
Workbook
   ↓
Workbook.AI(options)
   ↓
ExecuteInstruction(...)
Vous n'introduisez pas une nouvelle couche de document ou un service de traitement de document séparé. Vous ajoutez une couche d'exécution en langage naturel sur l'objet Workbook que vous avez déjà. Le même objet qui a ouvert, fusionné et enregistré vos fichiers accepte maintenant une instruction et exécute le flux de travail, avec le moteur Excel déterministe garantissant que la sortie est un fichier réel et bien formé — cellules fusionnées, formats de nombre et graphiques intacts. Le même modèle ExecuteInstruction s'étend aux documents Word et PDF — voir Revue de contrat IA en C#.
C'est la proposition de valeur pour un développeur Excel, énoncée dans les termes que vous utilisez déjà : non pas « adopter une plateforme IA », mais « apprendre au classeur que vous utilisez déjà à prendre des instructions ». Lorsqu'un magasin renomme une colonne ou que l'équipe financière change la règle de signalement, la correction est une modification d'une phrase, pas une reconstruction du pipeline de documents.
9. FAQ
Dois-je envoyer mes données Excel dans le cloud ?
Pas nécessairement. Spire.Agent.Office s'exécute à partir de votre propre application, donc le SDK et le traitement des documents restent dans votre environnement ; vos fichiers ne sont pas téléchargés vers un service tiers pour stockage ou conversion. Pour analyser le contenu, l'IA a besoin des données pertinentes, et elles sont envoyées au modèle pour traitement — une étape inhérente à tout flux de travail IA. Si vous déployez votre propre modèle sur votre réseau local, le contenu reste entièrement au sein de votre infrastructure. Si vous vous connectez via une API de modèle hébergé telle qu'OpenAI ou Azure OpenAI, le contenu pertinent est transmis à ce fournisseur sur le réseau selon votre configuration.
Quels formats Excel prend-il en charge ?
L'entrée couvre les fichiers de classeur standard tels que XLSX et XLS, et l'agent lit le classeur directement dans son format natif. La sortie peut être enregistrée sous forme de XLSX, XLS, CSV, PDF ou HTML, de sorte que le rapport terminé peut aller directement vers une archive ou une liste de distribution.
Peut-il remplacer ma revue financière ou opérationnelle ?
Non. L'agent automatise la lecture, la normalisation, l'analyse et la mise en forme — les heures qu'un analyste passe chaque mois — mais la validation finale reste entre les mains d'un réviseur humain. Considérez les anomalies signalées comme une liste courte à vérifier, et non comme une décision déjà prise.
En quoi est-ce différent de coller mes données dans ChatGPT ?
Un modèle de chat peut vous dire ce qui semble inhabituel mais ne peut pas placer cette réponse dans un classeur stylisé avec une feuille de résumé, une mise en forme conditionnelle et un graphique, et il ne peut pas exporter un PDF. Un agent Excel IA associe le jugement du modèle de langage à une couche Excel déterministe, de sorte que la sortie est un fichier réel et bien formé que votre équipe peut ouvrir et distribuer.
Puis-je utiliser mon propre modèle d'IA ?
Oui. Spire.Agent.Office prend en charge une intégration flexible des modèles d'IA et est compatible avec l'infrastructure IA grand public, y compris les API de modèles hébergés et les modèles déployés en privé. Vous pouvez pointer l'agent vers votre propre point de terminaison. Pour des questions sur les fournisseurs pris en charge dans votre déploiement, contactez-nous.
Prêt à automatiser vos rapports Excel ?
La consolidation, l'analyse des anomalies et la génération de rapports sont les endroits les plus rapides pour obtenir de la valeur : pointez l'agent vers la boîte de réception, décrivez le rapport et obtenez un classeur ou un PDF mis en forme. Suivez le tutoriel Démarrage pour exécuter votre premier flux de travail de feuille de calcul en .NET.
Lectures complémentaires
- Tutoriel sur l'automatisation de l'analyse et du classement des scores des étudiants -- un flux de travail Excel que l'agent exécute de bout en bout
- Revue de contrat IA en C# -- le même modèle piloté par les instructions appliqué aux documents Word et PDF
- Présentation du produit Spire.Agent.Office -- SDK d'agent IA pour chaque format de document Office
Automatización de la generación de informes de Excel con un agente de IA en C#
Tabla de contenidos
IA para Excel en C# significa combinar el criterio de un modelo de lenguaje con una biblioteca real de procesamiento de Excel dentro de una aplicación .NET, de modo que la aplicación pueda fusionar, normalizar, analizar y dar formato a los datos de una hoja de cálculo a partir de instrucciones en lenguaje natural en lugar de código columna por columna. La parte difícil de la creación de informes en Excel rara vez ha sido dibujar el gráfico final: es convertir una pila de libros de origen incoherentes en datos en los que realmente se pueda confiar. Con un agente de IA, usted describe la tarea de generación de informes ("fusione estos 20 libros de tiendas y señale las tiendas cuyos ingresos hayan caído más del 30%") y recibe un libro con formato, no una respuesta de chat. Spire.Agent.Office ofrece ambas partes: la comprensión del lenguaje y una capa de documentos determinista que garantiza la obtención de un archivo .xlsx (o PDF) real.
Navegación rápida
- De libros de trabajo heterogéneos a un modelo de datos común
- Conversión de reglas de negocio en análisis en lenguaje natural
- Del análisis a un informe listo para la dirección
- Construcción del flujo de trabajo en C#
- Preguntas frecuentes
1. El verdadero cuello de botella en la automatización de informes de Excel
Tome como ejemplo la tarea recurrente detrás de la mayoría de las solicitudes de "informes mensuales". Un equipo de operaciones gestiona 20 tiendas regionales, y cada tienda envía un libro de ventas a fin de mes. En teoría, se trata de un solo informe. En la práctica, son veinte archivos diferentes que coinciden en compartir un patrón de nombre de archivo:
- Las columnas no coinciden. Una tienda llama a la cifra
Revenue, otraSales Amount, una terceraNet Sales. - El diseño no coincide. Una tienda coloca los meses en columnas, otra en filas y una tercera añade una columna de notas en medio.
- Los tipos de datos no coinciden. Las fechas vienen como texto, los números como millares y al menos una tienda combina una fila de título en el encabezado.
Así que, antes de que alguien pueda generar un gráfico para la dirección, un analista pasa la semana abriendo archivos, mapeando columnas, normalizando fechas, buscando erratas y solo entonces comprobando anomalías y ensamblando el informe. Nada de eso es la parte de "generación del informe". Todo es preparación de datos.
La idea clave que hay que asimilar: la parte difícil de los informes de Excel rara vez es crear el gráfico final. Es convertir libros de origen incoherentes en datos en los que realmente se pueda confiar. Una biblioteca de gráficos representará sin problemas datos erróneos; lo que le falta al equipo es un camino fiable desde los archivos no procesados de la bandeja de entrada hasta una tabla limpia y comparable. Ese camino es exactamente donde un agente de IA cambia el panorama económico.
2. Lo que cambia cuando un agente de IA entra en el flujo de trabajo
La automatización de esta tarea no es nueva, solo que normalmente es costosa. Compare los dos flujos de trabajo:
Automatización tradicional
Inspeccionar archivos
→ mapear columnas
→ normalizar datos
→ escribir reglas
→ generar libro
Cada paso previo al último está predefinido: se escribe un mapa de columnas para cada encabezado conocido, un analizador de fechas para cada formato conocido y un umbral para cada regla. En el momento en que una tienda renombra una columna o cambia una regla de negocio, el mapa y las reglas dejan de ser válidos y un ser humano vuelve a entrar en el proceso.
Automatización con agente
Describir la tarea de informe
→ proporcionar libros de origen
→ revisar el resultado
El agente lee el significado de cada libro de trabajo en lugar de una posición fija, por lo que el mapa de columnas y el conjunto de reglas ya no tienen que enumerarse por adelantado. Lo que elimina es precisamente la parte costosa: el trabajo de predefinir un esquema y un conjunto de reglas que fallarán en el siguiente archivo.
El resto de este artículo recorre ese flujo paso a paso, desde los libros sin procesar hasta un PDF impreso, utilizando el escenario de las 20 tiendas como ejemplo práctico. Las secciones 3 a 5 explican lo que hace el agente en cada etapa; la sección 6 ofrece el código C# completo que lo ejecuta.
3. De libros de trabajo heterogéneos a un modelo de datos común
La versión específica de este problema en Excel es que diferentes libros "parecen iguales" sin ser realmente iguales. Tres tiendas pueden enviar cada una una tabla con cuatro columnas y, aun así, no ofrecer ninguna forma de combinarlas sin interpretación humana:
| Tienda A | Tienda B | Tienda C |
|---|---|---|
| Revenue | Sales Amount | Net Sales |
| Month | Reporting Period | Date |
| Units | Quantity Sold | Qty |
No existe un índice de columnas que las mapee entre sí, porque la correspondencia es semántica, no posicional. Revenue, Sales Amount y Net Sales son tres nombres para un mismo concepto, y solo comprendiendo el encabezado se pueden alinear.
El paso de consolidación del agente convierte esa alineación semántica en un único esquema:
Store / Region / SKU / UnitsSold / Revenue / Month
Lee cada libro de origen, resuelve los nombres de los encabezados con respecto a ese modelo de destino, alinea filas y columnas, omite las filas de encabezado y título duplicadas y escribe una tabla normalizada. El desarrollador nunca escribe una rutina FindColumnByHeader("Revenue"): la instrucción nombra el esquema de destino y el agente determina el mapeo de cada archivo.
Esta es la etapa con el mayor beneficio directo, porque es la que actualmente consume más tiempo del analista y la que más a menudo se rompe cuando se incorpora una nueva tienda.
4. Conversión de reglas de negocio en análisis en lenguaje natural
Una vez que los datos están en un solo lugar, la generación de informes requiere criterio, y el criterio es donde fallan las reglas codificadas de forma rígida. El ejemplo práctico utiliza una regla financiera típica:
Marcar las filas donde los ingresos cayeron más del 30% o crecieron más del 50% con respecto al mes anterior.
Observe cuánto se incluye en esa frase y qué tan incómoda resulta cada parte al pasarse a código:
- ¿Por qué el 30% y el 50%? Son umbrales de negocio con contexto: una tienda de temporada, un nuevo SKU o una promoción cambian lo que significa "inusual". Un
if (change < -0.30)codificado de forma rígida trata a todas las tiendas por igual y dispara falsas alarmas por estacionalidad. - ¿Cómo se cambia? En el código, hay que recompilar y volver a implementar. En la instrucción, el analista edita una sola frase: "cayeron más del 20%", o "solo para la región Este", o "marcar solo los SKU con más de 100 unidades vendidas".
- ¿Añadir una dimensión? ¿Desea aplicar la regla por tienda y por región y por mes? Añade una cláusula a la instrucción, no un bucle anidado.
- ¿Explicar el resultado? El agente puede adjuntar una columna
Causecon una probable explicación de una sola frase para cada fila marcada, algo que una simple comparación de umbrales nunca podría producir.
Vale la pena expresar claramente el principio que se desprende de esta sección:
El código define el cómo; las instrucciones definen el qué.
El desarrollador deja de codificar la regla y empieza a describir el resultado. La regla se mantiene legible, editable por la parte de negocio y sobrevive a una nueva tienda o a un cambio de umbral sin necesidad de modificar el código.
Para obtener un ejemplo completo y práctico de este mismo análisis impulsado por instrucciones aplicado a un flujo de trabajo de clasificación, consulte el tutorial de Análisis y clasificación de puntuaciones de estudiantes.
5. Del análisis a un informe listo para la dirección
Encontrar anomalías es solo la mitad de la elaboración de informes. El resultado todavía tiene que convertirse en un libro que alguien pueda usar realmente: la hoja de cálculo del analista no es el producto final; el resumen ejecutivo para la dirección sí lo es.
El flujo de trabajo se completa de la siguiente manera:
Libros sin procesar
      ↓
Datos consolidados
      ↓
Anomalías
      ↓
Resumen ejecutivo
      ↓
PDF
La instrucción final compone el producto entregable: una hoja Summary al principio con un bloque de KPI (ingresos totales, mejor tienda, peor tienda, recuento de anomalías marcadas), una tabla de tendencias mensuales, un gráfico de barras de ingresos por región y un formato listo para imprimir. Apuntar la misma instrucción a una ruta .pdf exporta el mismo informe como PDF para su distribución, sin necesidad de un paso de renderizado independiente.
La idea a recordar: el análisis y la composición son dos tareas diferentes, y el agente realiza ambas. El trabajo del analista pasa a ser revisar la lista corta de elementos marcados y dar su aprobación, en lugar de reconstruir la presentación cada mes.
6. Construcción del flujo de trabajo en C#
Todas las piezas anteriores se ejecutan mediante un único flujo de trabajo en C#. Configure el agente una vez y luego ejecute tres instrucciones en secuencia: consolidar, analizar e informar. La configuración completa —token, paquetes y conexiones del proyecto— está documentada paso a paso en el tutorial de Primeros pasos; aquí nos centramos en el flujo de trabajo en sí.
using System.IO;
using Spire.Xls;
using Spire.Agent.Office.AI;
using Spire.Agent.Office.Extensions;

AIOptions options = new AIOptions {
    SpireToken = spireToken,
    WorkDir = @"C:\retail-ops\output",
    TimeoutMs = 300000
};

string[] storeFiles = Directory.GetFiles(@"C:\retail-ops\inbox", "*.xlsx");
Directory.CreateDirectory(@"C:\retail-ops\output");
1. Consolidar. Pase los 20 archivos de la bandeja de entrada como archivos adjuntos y especifique el esquema de destino. La normalización de la sección 3 se realiza aquí, impulsada por la instrucción en lugar de un mapa de columnas:
using (Workbook consolidated = new Workbook())
{
    AIResult result = consolidated.AI(options).ExecuteInstruction(
        consolidated,
        "Lea cada libro de ventas regional en la bandeja de entrada y combínelos en una sola hoja de trabajo. " +
        "Cada tienda nombra sus columnas de forma diferente (por ejemplo, Sales vs Amount, Month vs Period); " +
        "normalícelas en un único esquema: Store, Region, SKU, UnitsSold, Revenue, Month. Omita las " +
        "filas de encabezado duplicadas y guarde el resultado fusionado como un libro de trabajo.",
        @"C:\retail-ops\output\consolidated.xlsx",
        storeFiles);

    if (result == null || !result.Success)
        throw new InvalidOperationException($"Consolidation failed: {result?.ErrorMessage}");
}
2. Analizar. Cargue el archivo consolidado y formule la regla de la sección 4 en lenguaje sencillo. El agente añade una hoja Anomalies y deja intactos los datos de origen:
using (Workbook analysis = new Workbook())
{
    analysis.LoadFromFile(@"C:\retail-ops\output\consolidated.xlsx");

    AIResult result = analysis.AI(options).ExecuteInstruction(
        analysis,
        "Añada una hoja 'Anomalies'. Compare los ingresos (Revenue) de cada tienda y SKU con el " +
        "mes anterior, marque las filas donde los ingresos cayeron más del 30% o crecieron más del 50%, aplique " +
        "un relleno rojo a los descensos y un relleno verde a los aumentos, y añada una columna 'Cause' con una " +
        "explicación probable de una sola frase. Deje inalteradas las hojas de datos originales.",
        @"C:\retail-ops\output\analyzed.xlsx");

    if (result == null || !result.Success)
        throw new InvalidOperationException($"Analysis failed: {result?.ErrorMessage}");
}
La hoja Anomalies se ubica junto a los datos de origen, con las filas marcadas, rellenos y la columna Cause aplicados por la instrucción:
3. Informar. Componga el resumen ejecutivo de la sección 5 y expórtelo. Únicamente el parámetro savePath elige el formato: .xlsx aquí, .pdf para su distribución:
using (Workbook report = new Workbook())
{
    report.LoadFromFile(@"C:\retail-ops\output\analyzed.xlsx");

    AIResult result = report.AI(options).ExecuteInstruction(
        report,
        "Genere un informe de gestión. Añada una hoja 'Summary' al principio con un bloque de KPI " +
        "(ingresos totales, mejor tienda, peor tienda, recuento de anomalías marcadas), una tabla de tendencias " +
        "mensuales y un gráfico de barras de ingresos por región. Delo formato para impresión y guarde el " +
        "libro de trabajo terminado.",
        @"C:\retail-ops\output\monthly-report.xlsx");

    if (result == null || !result.Success)
        throw new InvalidOperationException($"Report generation failed: {result?.ErrorMessage}");
}
La hoja Summary se coloca al principio del libro de trabajo, lista para imprimir o exportar a PDF:
Llamadas clave a la API
Workbook.AI(options)— adjunta el procesador de documentos de IA a un objeto de libro de trabajo existenteExecuteInstruction(doc, instruction, savePath, attachments)— ejecuta una etapa y escribe el resultadoAIResult.Success/AIResult.ErrorMessage— verifica cada etapa y saca a la luz los fallos
Lo que escribiría sin el agente
Por el contrario, la ruta habitual mediante SDK para las mismas tres etapas localiza cada columna por su cadena de encabezado, codifica de forma rígida cada umbral y establece cada relleno celda por celda, y vuelve a ajustar todo cuando una tienda renombra una columna o la regla cambia:
foreach (string file in storeFiles)
{
    Workbook wb = new Workbook();
    wb.LoadFromFile(file);
    Worksheet sheet = wb.Worksheets[0];

    // Falla en el momento en que una tienda llama a la columna "Sales" en lugar de "Revenue".
    int revenueCol = FindColumnByHeader(sheet, "Revenue");
    int storeCol   = FindColumnByHeader(sheet, "Store");

    for (int r = sheet.LastRow; r >= 2; r--)
    {
        double current = double.Parse(sheet.Range[r, revenueCol].Text);
        double prior   = double.Parse(sheet.Range[r, revenueCol + 1].Text);
        double change  = (current - prior) / prior;

        // Un umbral codificado de forma rígida; una tienda de temporada activa falsas alarmas.
        if (change < -0.30) sheet.Range[r, revenueCol].Style.Color = Color.Red;
    }
    // ... luego combinar, luego resumen, luego gráfico: cientos de líneas por tienda y por mes.
}
El agente no elimina la necesidad de código; elimina la necesidad de código de mapeo. La diferencia radica en dónde reside la lógica: en un buscador de columnas y un umbral, o en una frase que la parte de negocio puede leer y editar.
7. Dónde se detiene la IA y dónde comienza la lógica de la aplicación
Una forma más honesta de considerar el límite que una lista de "lo que se puede y no se puede hacer": el agente no elimina la lógica determinista de la aplicación, sino que se sitúa sobre ella.
La aplicación sigue siendo propietaria de todo lo que no tiene nada que ver con la comprensión de la hoja de cálculo:
- Detección y acceso a archivos — búsqueda de archivos en la bandeja de entrada, verificación de permisos y preparación de los mismos
- Programación del flujo de trabajo — cuándo se ejecuta el informe, con qué activador y en qué orden
- Control de fuentes de datos — qué archivos son entradas autorizadas y de dónde proceden
- Gestión de errores y reintentos — qué ocurre cuando falta un archivo o falla una etapa
- Aprobación final — un ser humano revisa las anomalías marcadas antes de la firma o aprobación definitiva
- Conciliación externa — cotejo del informe con un sistema de registro
El agente es propietario de las partes que son genuinamente semánticas:
- Comprensión — lectura de lo que significa realmente cada columna
- Normalización — alineación de esquemas heterogéneos en un solo modelo
- Interpretación — aplicación de una regla de negocio para decidir qué es inusual
- Transformación — conversión de datos sin procesar en un resumen, un gráfico y formato
- Composición — ensamblaje del libro de trabajo o PDF final
Este enfoque es más útil que una tabla de capacidades porque le indica dónde dedicar sus esfuerzos de ingeniería. Mantenga la fontanería determinista en el código —donde se puede probar y auditar— y confíe el trabajo semántico al agente. Cada parte hace aquello para lo que es buena.
8. Añadir IA a un flujo de trabajo de Excel en .NET existente
Lo último que vale la pena hacer explícito es lo poco que hay que reconstruir para conseguirlo. Si su aplicación ya funciona con Excel a través de Spire.Xls, el modelo de documento que ya posee es el punto de integración:
Workbook
   ↓
Workbook.AI(options)
   ↓
ExecuteInstruction(...)
No está introduciendo una nueva capa de documentos ni un servicio de procesamiento de documentos independiente. Está añadiendo una capa de ejecución en lenguaje natural sobre el objeto Workbook que ya tiene. El mismo objeto que abría, fusionaba y guardaba sus archivos ahora acepta una instrucción y lleva a cabo el flujo de trabajo, con el motor determinista de Excel garantizando que el resultado sea un archivo real y bien formado: celdas combinadas, formatos numéricos y gráficos intactos. El mismo patrón ExecuteInstruction se extiende a documentos de Word y PDF; consulte la Revisión de contratos con IA en C#.
Esa es la propuesta de valor para un desarrollador de Excel, expresada en los términos en los que usted ya piensa: no "adoptar una plataforma de IA", sino "enseñar al libro de trabajo que ya utiliza a recibir instrucciones". Cuando una tienda renombra una columna o el equipo de finanzas cambia la regla de marcado, la solución es editar una frase, no reconstruir todo el flujo de trabajo del documento.
9. Preguntas frecuentes
¿Necesito enviar mis datos de Excel a la nube?
No necesariamente. Spire.Agent.Office se ejecuta desde su propia aplicación, por lo que el SDK y el procesamiento de documentos se mantienen dentro de su entorno; sus archivos no se cargan a un servicio de terceros para su almacenamiento o conversión. Para analizar el contenido, la IA necesita los datos relevantes, y estos se envían al modelo para su procesamiento, un paso inherente a cualquier flujo de trabajo de IA. Si implementa su propio modelo en su red local, el contenido permanece totalmente dentro de su infraestructura. Si se conecta a través de una API de modelo alojada como OpenAI o Azure OpenAI, el contenido relevante se transmite a ese proveedor a través de la red según su configuración.
¿Qué formatos de Excel admite?
La entrada admite archivos de libro estándar como XLSX y XLS, y el agente lee el libro directamente en su formato nativo. La salida se puede guardar como XLSX, XLS, CSV, PDF o HTML, de modo que el informe finalizado puede ir directamente a un archivo o a una lista de distribución.
¿Puede reemplazar la revisión de finanzas u operaciones?
No. El agente automatiza la lectura, normalización, análisis y formato (las horas que un analista dedica cada mes), pero la aprobación final sigue estando en manos de un revisor humano. Trate las anomalías marcadas como una lista corta que verificar, no como una decisión ya tomada.
¿En qué se diferencia esto de pegar mis datos en ChatGPT?
Un modelo de chat puede decirle lo que parece inusual, pero no puede colocar esa respuesta en un libro de trabajo con formato, una hoja de resumen, formato condicional y un gráfico, ni puede exportar un PDF. Un agente de IA para Excel combina el criterio del modelo de lenguaje con una capa determinista de Excel, por lo que el resultado es un archivo real y bien formado que su equipo puede abrir y distribuir.
¿Puedo utilizar mi propio modelo de IA?
Sí. Spire.Agent.Office admite una integración flexible de modelos de IA y es compatible con las principales infraestructuras de IA, incluidas las API de modelos alojados y los modelos implementados de forma privada. Puede orientar el agente a su propio punto de enlace (endpoint). Si tiene preguntas sobre qué proveedores se admiten en su implementación, contáctenos.
¿Listo para automatizar sus informes de Excel?
La consolidación, el análisis de anomalías y la generación de informes son los puntos más rápidos para obtener valor: apunte el agente a la bandeja de entrada, describa el informe y obtenga un libro con formato o un PDF. Siga el tutorial de Primeros pasos para ejecutar su primer flujo de trabajo con hojas de cálculo en .NET.
Lecturas adicionales
- Tutorial de Automatización del análisis y clasificación de puntuaciones de estudiantes: un flujo de trabajo de Excel que el agente ejecuta de principio a fin
- Revisión de contratos con IA en C#: el mismo patrón impulsado por instrucciones aplicado a documentos de Word y PDF
- Descripción general del producto Spire.Agent.Office: SDK de agentes de IA para todos los formatos de documentos de Office
Automatisierung der Excel-Berichterstellung mit einem KI-Agenten in C#
Inhaltsverzeichnis
KI für Excel in C# bedeutet, das Urteilsvermögen eines Sprachmodells mit einer echten Excel-Verarbeitungsbibliothek in einer .NET-Anwendung zu kombinieren, sodass die Anwendung Tabellenkalkulationsdaten anhand von Anweisungen in natürlicher Sprache zusammenführen, normalisieren, analysieren und formatieren kann – anstatt durch Code Spalte für Spalte. Der schwierige Teil der Excel-Berichterstattung besteht selten darin, das finale Diagramm zu zeichnen – es geht darum, einen Haufen uneinheitlicher Quell-Arbeitsmappen in Daten zu verwandeln, denen Sie tatsächlich vertrauen können. Mit einem KI-Agenten beschreiben Sie die Berichtsaufgabe („Führe diese 20 Filial-Arbeitsmappen zusammen und markiere Filialen, deren Umsatz um mehr als 30 % gefallen ist“) und erhalten eine formatierte Arbeitsmappe zurück, keine Chat-Antwort. Spire.Agent.Office liefert beide Hälften: das Sprachverständnis und eine deterministische Dokumentenebene, die garantiert, dass eine echte .xlsx- (oder PDF-)Datei ausgegeben wird.
Schnellnavigation
- Von heterogenen Arbeitsmappen zu einem gemeinsamen Datenmodell
- Geschäftsregeln in Analysen in natürlicher Sprache umwandeln
- Von der Analyse zu einem fertigen Bericht für das Management
- Erstellen des Workflows in C#
- FAQ
1. Der eigentliche Engpass bei der Automatisierung von Excel-Berichten
Betrachten wir die wiederkehrende Aufgabe hinter den meisten Anfragen zur „monatlichen Berichterstattung“. Ein Betriebsteam verwaltet 20 regionale Filialen, und jede Filiale sendet am Monatsende eine Verkaufs-Arbeitsmappe. In der Theorie ist dies ein einziger Bericht. In der Praxis handelt es sich um zwanzig verschiedene Dateien, die zufällig ein ähnliches Dateinamensmuster aufweisen:
- Die Spalten stimmen nicht überein. Eine Filiale nennt die Zahl
Revenue, eine andereSales Amount, eine dritteNet Sales. - Das Layout stimmt nicht überein. Eine Filiale ordnet die Monate über Spalten an, eine andere über Zeilen, eine dritte fügt eine Notizspalte in der Mitte ein.
- Die Datentypen stimmen nicht überein. Daten werden als Text eingegeben, Zahlen als Tausenderwerte, und mindestens eine Filiale führt eine Titelzeile mit der Kopfzeile zusammen.
Bevor also jemand ein Diagramm für das Management erstellen kann, verbringt ein Analyst die Woche damit, Dateien zu öffnen, Spalten zuzuordnen, Daten zu normalisieren, nach Tippfehlern zu suchen und erst dann nach Anomalien zu suchen und den Bericht zusammenzustellen. Nichts davon ist der Teil der „Berichtserstellung“. Es ist alles Datenvorbereitung.
Der Punkt, den man sich klar machen muss: Der schwierige Teil der Excel-Berichterstellung ist selten das Erstellen des finalen Diagramms. Es geht darum, uneinheitliche Quell-Arbeitsmappen in Daten zu verwandeln, denen man tatsächlich vertrauen kann. Eine Diagrammbibliothek zeichnet gerne falsche Daten; was dem Team fehlt, ist ein zuverlässiger Weg von den Rohdateien im Posteingang zu einer sauberen, vergleichbaren Tabelle. Genau auf diesem Weg ändert ein KI-Agent die Wirtschaftlichkeit.
2. Was sich ändert, wenn ein KI-Agent in den Workflow integriert wird
Die Automatisierung dieser Aufgabe ist nicht neu – sie ist normalerweise nur teuer. Vergleichen Sie die beiden Workflows:
Traditionelle Automatisierung
Dateien prüfen
→ Spalten zuordnen
→ Daten normalisieren
→ Regeln schreiben
→ Arbeitsmappe generieren
Jeder Schritt vor dem letzten ist vordefiniert: Sie schreiben eine Spaltenzuordnung für jede bekannte Kopfzeile, einen Datums-Parser für jedes bekannte Format und einen Schwellenwert für jede Regel. In dem Moment, in dem eine Filiale eine Spalte umbenennt oder sich eine Geschäftsregel ändert, sind die Zuordnung und die Regeln falsch, und ein Mensch greift wieder ein.
Agenten-Automatisierung
Berichtsaufgabe beschreiben
→ Quell-Arbeitsmappen bereitstellen
→ Ergebnis überprüfen
Der Agent liest die Bedeutung jeder Arbeitsmappe anstatt einer festen Position, sodass die Spaltenzuordnung und das Regelwerk nicht mehr vorab aufgeführt werden müssen. Was er entfernt, ist genau der teure Teil: die Arbeit des Vordefinierens eines Schemas und eines Regelwerks, das bei der nächsten Datei fehlschlagen würde.
Der Rest dieses Artikels durchläuft diese Pipeline einmal, von den Roh-Arbeitsmappen bis zum gedruckten PDF, unter Verwendung des Szenarios mit 20 Filialen als laufendes Beispiel. Die Abschnitte 3 bis 5 erklären, was der Agent in jeder Phase tut; Abschnitt 6 zeigt den vollständigen C#-Code, der ihn steuert.
3. Von heterogenen Arbeitsmappen zu einem gemeinsamen Datenmodell
Die Excel-spezifische Variante des Problems besteht darin, dass verschiedene Arbeitsmappen „gleich aussehen“, ohne tatsächlich gleich zu sein. Drei Filialen können jeweils eine Tabelle mit vier Spalten senden und Ihnen dennoch keine Möglichkeit bieten, diese ohne menschliche Interpretation zusammenzuführen:
| Filiale A | Filiale B | Filiale C |
|---|---|---|
| Revenue | Sales Amount | Net Sales |
| Month | Reporting Period | Date |
| Units | Quantity Sold | Qty |
Es gibt keinen Spaltenindex, der diese einander zuordnet, da die Zuordnung semantisch und nicht positionsbezogen ist. Revenue, Sales Amount und Net Sales sind drei Namen für dasselbe Konzept, und nur das Verständnis der Kopfzeile ermöglicht es Ihnen, sie auszurichten.
Der Konsolidierungsschritt des Agenten verwandelt diese semantische Ausrichtung in ein einzelnes Schema:
Store / Region / SKU / UnitsSold / Revenue / Month
Er liest jede Quell-Arbeitsmappe, löst die Kopfzeilennamen anhand dieses Zielmodells auf, richtet Zeilen und Spalten aus, überspringt doppelte Kopf- und Titelzeilen und schreibt eine normalisierte Tabelle. Der Entwickler schreibt niemals eine FindColumnByHeader("Revenue")-Routine – die Anweisung benennt das Zielschema, und der Agent erarbeitet die Zuordnung für jede Datei.
Dies ist die Phase mit dem größten einmaligen Gewinn, da es sich um die Phase handelt, die derzeit die meiste Zeit des Analysten in Anspruch nimmt und am häufigsten fehlschlägt, wenn eine neue Filiale hinzukommt.
4. Geschäftsregeln in Analysen in natürlicher Sprache umwandeln
Sobald sich die Daten an einem Ort befinden, erfordert die Berichterstattung Urteilsvermögen, und beim Urteilsvermögen versagen fest codierte Regeln. Das laufende Beispiel verwendet eine typische Finanzregel:
Markiere Zeilen, in denen der Umsatz um mehr als 30 % gefallen oder um mehr als 50 % gestiegen ist im Vergleich zum Vormonat.
Beachten Sie, wie viel in diesem einen Satz steckt und wie umständlich jeder Teil als Code ist:
- Warum 30 % und 50 %? Das sind betriebswirtschaftliche Schwellenwerte mit Kontext – eine saisonale Filiale, eine neue SKU oder eine Werbeaktion ändern, was „ungewöhnlich“ bedeutet. Ein fest codiertes
if (change < -0.30)behandelt jede Filiale identisch und löst aufgrund von Saisonalität Fehlalarme aus. - Wie ändert man es? Im Code neu kompilieren und bereitstellen. In der Anweisung bearbeitet der Analyst einen einzigen Satz: „um mehr als 20 % gefallen“ oder „nur für die Region Ost“ oder „nur SKUs mit mehr als 100 verkauften Einheiten markieren“.
- Eine Dimension hinzufügen? Möchten Sie, dass die Regel pro Filiale und pro Region und pro Monat angewendet wird? Sie fügen der Anweisung eine Klausel hinzu, keine geschachtelte Schleife.
- Das Ergebnis erklären? Der Agent kann eine Spalte
Causemit einer wahrscheinlichen Erklärung in einem Satz für jede markierte Zeile anfügen – etwas, das ein bloßer Schwellenwertvergleich niemals liefern kann.
Das Prinzip, das sich aus diesem Abschnitt ergibt, ist es wert, klar formuliert zu werden:
Code definiert das Wie; Anweisungen definieren das Was.
Der Entwickler hört auf, die Regel zu codieren, und beginnt, das Ergebnis zu beschreiben. Die Regel bleibt lesbar, für das Geschäft bearbeitbar und übersteht eine neue Filiale oder einen geänderten Schwellenwert ohne Codeänderung.
Ein vollständiges durchgearbeitetes Beispiel derselben anweisungsgesteuerten Analyse angewendet auf einen Ranking-Workflow finden Sie im Tutorial Studenten-Punkteanalyse und Ranking.
5. Von der Analyse zu einem fertigen Bericht für das Management
Das Finden von Anomalien ist nur die halbe Miete der Berichterstattung. Das Ergebnis muss immer noch eine Arbeitsmappe werden, die tatsächlich jemand nutzen kann – die Tabellenkalkulation des Analysten ist nicht das Endergebnis, sondern die Zusammenfassung für das Management.
Die Pipeline schließt wie folgt ab:
Roh-Arbeitsmappen
      ↓
Konsolidierte Daten
      ↓
Anomalien
      ↓
Management-Zusammenfassung
      ↓
PDF
Die finale Anweisung stellt das Endprodukt zusammen: Ein Summary-Blatt vorab mit einem KPI-Block (Gesamtumsatz, beste Filiale, schlechteste Filiale, Anzahl markierter Anomalien), einer monatlichen Trendtabelle, einem Balkendiagramm des Umsatzes nach Region und druckfertiger Formatierung. Wenn dieselbe Anweisung auf einen .pdf-Pfad verweist, wird genau derselbe Bericht als PDF zur Verteilung exportiert, ohne separaten Render-Schritt.
Der Punkt zum Mitnehmen: Analyse und Zusammenstellung sind zwei verschiedene Aufgaben, und der Agent erledigt beide. Die Aufgabe des Analysten besteht darin, die markierte Auswahlliste zu überprüfen und freizugeben, anstatt das Deck jeden Monat neu aufzubauen.
6. Erstellen des Workflows in C#
Alle oben genannten Teile werden von einer C#-Pipeline gesteuert. Konfigurieren Sie den Agenten einmal und führen Sie dann drei Anweisungen nacheinander aus: konsolidieren, analysieren, berichten. Die vollständige Einrichtung – Token, Pakete und Projektverkabelung – ist Schritt für Schritt im Tutorial Erste Schritte dokumentiert; hier konzentrieren wir uns auf den Workflow selbst.
using System.IO;
using Spire.Xls;
using Spire.Agent.Office.AI;
using Spire.Agent.Office.Extensions;

AIOptions options = new AIOptions {
    SpireToken = spireToken,
    WorkDir = @"C:\retail-ops\output",
    TimeoutMs = 300000
};

string[] storeFiles = Directory.GetFiles(@"C:\retail-ops\inbox", "*.xlsx");
Directory.CreateDirectory(@"C:\retail-ops\output");
1. Konsolidieren. Übergeben Sie die 20 Dateien im Posteingang als Anhänge und nennen Sie das Zielschema. Die Normalisierung aus Abschnitt 3 findet hier statt, gesteuert durch die Anweisung anstelle einer Spaltenzuordnung:
using (Workbook consolidated = new Workbook())
{
    AIResult result = consolidated.AI(options).ExecuteInstruction(
        consolidated,
        "Lies jede regionale Verkaufs-Arbeitsmappe im Posteingang und führe sie in einem Arbeitsblatt zusammen. " +
        "Jede Filiale benennt ihre Spalten unterschiedlich (z. B. Sales vs. Amount, Month vs. Period); " +
        "normalisiere sie auf ein einziges Schema: Store, Region, SKU, UnitsSold, Revenue, Month. Überspringe " +
        "doppelte Kopfzeilen und speichere das zusammengeführte Ergebnis als Arbeitsmappe.",
        @"C:\retail-ops\output\consolidated.xlsx",
        storeFiles);

    if (result == null || !result.Success)
        throw new InvalidOperationException($"Consolidation failed: {result?.ErrorMessage}");
}
2. Analysieren. Laden Sie die konsolidierte Datei und formulieren Sie die Regel aus Abschnitt 4 in einfachem Englisch oder Deutsch. Der Agent fügt ein Anomalies-Blatt hinzu und lässt die Quelldaten unverändert:
using (Workbook analysis = new Workbook())
{
    analysis.LoadFromFile(@"C:\retail-ops\output\consolidated.xlsx");

    AIResult result = analysis.AI(options).ExecuteInstruction(
        analysis,
        "Füge ein 'Anomalies'-Blatt hinzu. Vergleiche den Umsatz jeder Filiale und SKU mit dem " +
        "Vormonat, markiere Zeilen, in denen der Umsatz um mehr als 30 % gefallen oder um mehr als 50 % gestiegen ist, " +
        "wende eine rote Füllung auf Rückgänge und eine grüne Füllung auf Sprünge an und füge eine 'Cause'-Spalte mit einer " +
        "einzeiligen wahrscheinlichen Erklärung hinzu. Lass die ursprünglichen Datenblätter unverändert.",
        @"C:\retail-ops\output\analyzed.xlsx");

    if (result == null || !result.Success)
        throw new InvalidOperationException($"Analysis failed: {result?.ErrorMessage}");
}
Das Blatt Anomalies wird neben den Quelldaten abgelegt, wobei die markierten Zeilen, Füllungen und die Spalte Cause durch die Anweisung angewendet wurden:
3. Berichten. Erstellen Sie die Management-Zusammenfassung aus Abschnitt 5 und exportieren Sie sie. Allein der savePath wählt das Format – hier .xlsx, für die Verteilung .pdf:
using (Workbook report = new Workbook())
{
    report.LoadFromFile(@"C:\retail-ops\output\analyzed.xlsx");

    AIResult result = report.AI(options).ExecuteInstruction(
        report,
        "Erstelle einen Management-Bericht. Füge vorne ein 'Summary'-Blatt mit einem KPI-Block " +
        "(Gesamtumsatz, beste Filiale, schlechteste Filiale, Anzahl markierter Anomalien), einer monatlichen Trendtabelle " +
        "und einem Balkendiagramm des Umsatzes nach Region hinzu. Formatiere es für den Druck und speichere die fertige " +
        "Arbeitsmappe.",
        @"C:\retail-ops\output\monthly-report.xlsx");

    if (result == null || !result.Success)
        throw new InvalidOperationException($"Report generation failed: {result?.ErrorMessage}");
}
Das Summary-Blatt befindet sich ganz vorne in der Arbeitsmappe, bereit für den Druck oder den PDF-Export:
Wichtige API-Aufrufe
Workbook.AI(options)— fügt den KI-Dokumentenprozessor an ein vorhandenes Workbook-Objekt anExecuteInstruction(doc, instruction, savePath, attachments)— führt eine Phase aus und schreibt das ErgebnisAIResult.Success/AIResult.ErrorMessage— überprüft jede Phase und deckt Fehler auf
Was Sie ohne den Agenten schreiben müssten
Zum Vergleich: Der traditionelle SDK-Weg für dieselben drei Phasen sucht jede Spalte nach Kopfzeilen-String, codiert jeden Schwellenwert fest und setzt jede Füllung Zelle für Zelle – und passt all das neu an, wenn eine Filiale eine Spalte umbenennt oder sich die Regel ändert:
foreach (string file in storeFiles)
{
    Workbook wb = new Workbook();
    wb.LoadFromFile(file);
    Worksheet sheet = wb.Worksheets[0];

    // Schlägt fehl, sobald eine Filiale die Spalte "Sales" statt "Revenue" nennt.
    int revenueCol = FindColumnByHeader(sheet, "Revenue");
    int storeCol   = FindColumnByHeader(sheet, "Store");

    for (int r = sheet.LastRow; r >= 2; r--)
    {
        double current = double.Parse(sheet.Range[r, revenueCol].Text);
        double prior   = double.Parse(sheet.Range[r, revenueCol + 1].Text);
        double change  = (current - prior) / prior;

        // Ein hartcodierter Schwellenwert; eine saisonale Filiale löst Fehlalarme aus.
        if (change < -0.30) sheet.Range[r, revenueCol].Style.Color = Color.Red;
    }
    // ... dann zusammenführen, dann Zusammenfassung, dann Diagramm -- Hunderte von Zeilen pro Filiale und Monat.
}
Der Agent erübrigt nicht den Code selbst – er erübrigt den Zuordnungscode. Der Unterschied liegt darin, wo die Logik lebt: in einem Spaltensucher und einem Schwellenwert oder in einem Satz, den das Fachteam lesen und bearbeiten kann.
7. Wo KI aufhört und Anwendungslogik beginnt
Eine ehrlichere Betrachtungsweise der Grenze als eine Liste von „Kann und Kann nicht“: Der Agent eliminiert nicht die deterministische Anwendungslogik – er setzt darauf auf.
Die Anwendung besitzt weiterhin alles, was nichts mit dem Verständnis der Tabellenkalkulation zu tun hat:
- Datei-Erkennung und -Zugriff — Suchen der Posteingangsdateien, Überprüfen von Berechtigungen und Bereitstellung
- Workflow-Planung — wann der Bericht ausgeführt wird, bei welchem Auslöser und in welcher Reihenfolge
- Datenquellensteuerung — welche Dateien autorisierte Eingaben sind und woher sie stammen
- Fehlerbehandlung und Wiederholungsversuche — was passiert, wenn eine Datei fehlt oder eine Phase fehlschlägt
- Finale Genehmigung — ein Mensch überprüft die markierten Anomalien vor der Freigabe
- Externe Abstimmung — Abgleich des Berichts mit einem führenden System (System of Record)
Der Agent besitzt die Teile, die echt semantisch sind:
- Verständnis — Lesen, was jede Spalte tatsächlich bedeutet
- Normalisierung — Ausrichten heterogener Schemata in ein Modell
- Interpretation — Anwenden einer Geschäftsregel zur Entscheidung, was ungewöhnlich ist
- Transformation — Umwandeln von Rohdaten in eine Zusammenfassung, ein Diagramm und Formatierung
- Zusammenstellung — Erstellen der finalen Arbeitsmappe oder PDF
Diese Betrachtung ist nützlicher als eine Funktionstabelle, weil sie Ihnen zeigt, worauf Sie Ihre Entwicklungsarbeit konzentrieren sollten. Behalten Sie die deterministische Infrastruktur im Code – wo sie testbar und auditierbar ist – und übergeben Sie die semantische Arbeit dem Agenten. Jede Seite tut das, worin sie gut ist.
8. Hinzufügen von KI zu einem bestehenden .NET Excel-Workflow
Das Letzte, was explizit gemacht werden sollte, ist, wie wenig Sie neu bauen müssen, um dorthin zu gelangen. Wenn Ihre Anwendung bereits über Spire.Xls mit Excel arbeitet, ist das Dokumentenmodell, das Sie bereits halten, der Integrationspunkt:
Workbook
   ↓
Workbook.AI(options)
   ↓
ExecuteInstruction(...)
Sie führen keine neue Dokumentenebene oder einen separaten Dokumentenverarbeitungsdienst ein. Sie fügen eine Ausführungsebene für natürliche Sprache zu dem Workbook-Objekt hinzu, das Sie bereits haben. Dasselbe Objekt, das Ihre Dateien geöffnet, zusammengeführt und gespeichert hat, akzeptiert nun eine Anweisung und führt den Workflow aus, wobei die deterministische Excel-Engine garantiert, dass die Ausgabe eine echte, wohlgeformte Datei ist – verbundene Zellen, Zahlenformate und Diagramme bleiben intakt. Dasselbe ExecuteInstruction-Muster erstreckt sich auf Word- und PDF-Dokumente – siehe KI-Vertragsprüfung in C#.
Das ist das Wertversprechen für einen Excel-Entwickler, ausgedrückt in den Begriffen, in denen Sie bereits denken: Nicht „eine KI-Plattform einführen“, sondern „der Arbeitsmappe, die Sie bereits verwenden, beibringen, Anweisungen entgegenzunehmen“. Wenn eine Filiale eine Spalte umbenennt oder das Finanzteam die Regel zur Markierung ändert, besteht die Korrektur in der Bearbeitung eines Satzes, nicht im Neuaufbau der Dokumenten-Pipeline.
9. FAQ
Muss ich meine Excel-Daten in die Cloud senden?
Nicht notwendigerweise. Spire.Agent.Office läuft in Ihrer eigenen Anwendung, sodass das SDK und die Dokumentenverarbeitung in Ihrer Umgebung verbleiben; Ihre Dateien werden nicht auf einen Dienst von Drittanbietern zur Speicherung oder Konvertierung hochgeladen. Um Inhalte zu analysieren, benötigt die KI die relevanten Daten, und diese werden zur Verarbeitung an das Modell gesendet – ein inhärenter Schritt jedes KI-Workflows. Wenn Sie Ihr eigenes Modell in Ihrem lokalen Netzwerk bereitstellen, verbleiben die Inhalte vollständig in Ihrer Infrastruktur. Wenn Sie eine Verbindung über eine gehostete Modell-API wie OpenAI oder Azure OpenAI herstellen, werden die relevanten Inhalte gemäß Ihrer Konfiguration über das Netzwerk an diesen Anbieter übertragen.
Welche Excel-Formate werden unterstützt?
Die Eingabe umfasst Standard-Arbeitsmappendateien wie XLSX und XLS, und der Agent liest die Arbeitsmappe direkt in ihrem nativen Format. Die Ausgabe kann als XLSX, XLS, CSV, PDF oder HTML gespeichert werden, sodass der fertige Bericht direkt in ein Archiv oder an einen Verteiler gehen kann.
Kann es meine Finanz- oder Betriebsüberprüfung ersetzen?
Nein. Der Agent automatisiert das Lesen, Normalisieren, Analysieren und Formatieren – die Stunden, die ein Analyst jeden Monat verbringt –, aber die finale Freigabe verbleibt bei einem menschlichen Prüfer. Betrachten Sie die markierten Anomalien als eine zu überprüfende Auswahlliste, nicht als eine bereits getroffene Entscheidung.
Wie unterscheidet sich dies vom Einfügen meiner Daten in ChatGPT?
Ein Chat-Modell kann Ihnen sagen, was ungewöhnlich aussieht, aber es kann diese Antwort nicht in eine gestaltete Arbeitsmappe mit einem Zusammenfassungsblatt, bedingter Formatierung und einem Diagramm einfügen und keine PDF-Datei exportieren. Ein KI-Excel-Agent kombiniert das Urteilsvermögen des Sprachmodells mit einer deterministischen Excel-Ebene, sodass das Ergebnis eine echte, wohlgeformte Datei ist, die Ihr Team öffnen und verteilen kann.
Kann ich mein eigenes KI-Modell verwenden?
Ja. Spire.Agent.Office unterstützt eine flexible KI-Modellintegration und ist mit gängigen KI-Infrastrukturen kompatibel, einschließlich gehosteter Modell-APIs und privat bereitgestellter Modelle. Sie können den Agenten auf Ihren eigenen Endpunkt richten. Bei Fragen dazu, welche Anbieter in Ihrer Bereitstellung unterstützt werden, kontaktieren Sie uns.
Bereit, Ihre Excel-Berichterstattung zu automatisieren?
Konsolidierung, Anomalieanalyse und Berichtserstellung sind die schnellsten Wege, um Mehrwert zu erzielen: Richten Sie den Agenten auf den Posteingang, beschreiben Sie den Bericht und erhalten Sie eine formatierte Arbeitsmappe oder PDF. Folgen Sie dem Tutorial Erste Schritte, um Ihren ersten Tabellenkalkulations-Workflow in .NET auszuführen.
Weiterführende Literatur
- Tutorial zur Automatisierung der Studenten-Punkteanalyse und des Rankings -- ein Excel-Workflow, den der Agent von Anfang bis Ende ausführt
- KI-Vertragsprüfung in C# -- dasselbe anweisungsgesteuerte Muster angewendet auf Word- und PDF-Dokumente
- Spire.Agent.Office Produktübersicht -- KI-Agenten-SDKs für jedes Office-Dokumentenformat
Автоматизация создания отчетов Excel с помощью ИИ-агента на C#
Оглавление
ИИ для Excel на C# означает объединение суждений языковой модели с реальной библиотекой обработки Excel внутри приложения .NET. Это позволяет приложению объединять, нормализовать, анализировать и форматировать данные электронных таблиц на основе инструкций на естественном языке, а не с помощью кода, написанного для каждого столбца отдельно. Самая сложная часть отчетности в Excel редко заключается в построении итоговой диаграммы — она заключается в превращении груды несогласованных исходных файлов в данные, которым можно доверять. С ИИ-агентом вы описываете задачу отчетности («объедини эти 20 файлов магазинов и отметь те, где выручка упала более чем на 30%») и получаете на выходе отформатированную книгу, а не просто ответ в чате. Spire.Agent.Office предоставляет обе составляющие: понимание языка и детерминированный уровень работы с документами, который гарантирует создание реального файла .xlsx (или PDF).
Быстрая навигация
- От разнородных книг к единой модели данных
- Превращение бизнес-правил в анализ на естественном языке
- От анализа к отчету для руководства
- Создание рабочего процесса на C#
- Часто задаваемые вопросы
1. Настоящее «узкое место» в автоматизации отчетов Excel
Возьмем повторяющуюся задачу, стоящую за большинством запросов на «ежемесячную отчетность». Операционный отдел управляет 20 региональными магазинами, и каждый магазин присылает книгу продаж в конце месяца. Теоретически это один отчет. На практике это двадцать разных файлов, которые случайно имеют схожий шаблон имени:
- Столбцы не совпадают. Один магазин называет показатель
Выручка, другойСумма продаж, третийЧистые продажи. - Макет не совпадает. Один магазин размещает месяцы по столбцам, другой по строкам, третий вставляет столбец с примечаниями посередине.
- Типы данных не совпадают. Даты приходят как текст, числа — как тысячи, и как минимум один магазин объединяет строку заголовка с заголовком таблицы.
Поэтому, прежде чем кто-либо сможет создать диаграмму для руководства, аналитик тратит неделю на открытие файлов, сопоставление столбцов, нормализацию дат, поиск опечаток и только потом — на проверку аномалий и сборку отчета. Ничто из этого не является «генерацией отчета». Это всё подготовка данных.
Важно усвоить: сложная часть отчетности в Excel редко заключается в создании финальной диаграммы. Она заключается в превращении несогласованных исходных файлов в данные, которым можно доверять. Библиотека для построения графиков с радостью построит график по неверным данным; команде не хватает надежного пути от «сырых» файлов во входящих до чистой, сопоставимой таблицы. Именно на этом пути ИИ-агент меняет экономику процесса.
2. Что меняется, когда в рабочий процесс входит ИИ-агент
Автоматизация этой задачи не нова — она просто обычно обходится дорого. Сравните два рабочих процесса:
Традиционная автоматизация
Проверка файлов
→ сопоставление столбцов
→ нормализация данных
→ написание правил
→ создание книги
Каждый шаг, кроме последнего, предопределен: вы пишете карту столбцов для каждого известного заголовка, парсер даты для каждого известного формата и пороговое значение для каждого правила. В тот момент, когда магазин переименовывает столбец или меняется бизнес-правило, карта и правила становятся неверными, и человек снова возвращается в цикл.
Автоматизация с помощью агента
Описание задачи отчетности
→ предоставление исходных книг
→ проверка результата
Агент считывает смысл каждой книги, а не фиксированную позицию, поэтому карту столбцов и набор правил больше не нужно перечислять заранее. Он устраняет именно ту дорогую часть: работу по предварительному определению схемы и набора правил, которые сломаются на следующем же файле.
В остальной части этой статьи мы пройдем по этому конвейеру один раз, от «сырых» книг до распечатанного PDF, используя сценарий с 20 магазинами в качестве примера. В разделах с 3 по 5 объясняется, что делает агент на каждом этапе; раздел 6 содержит полный код на C#, который управляет процессом.
3. От разнородных книг к единой модели данных
Специфическая проблема Excel заключается в том, что разные книги «выглядят одинаково», не являясь таковыми на самом деле. Три магазина могут прислать таблицу с четырьмя столбцами, и у вас всё равно не будет способа объединить их без человеческой интерпретации:
| Магазин A | Магазин B | Магазин C |
|---|---|---|
| Выручка | Сумма продаж | Чистые продажи |
| Месяц | Отчетный период | Дата |
| Единицы | Количество продаж | Кол-во |
Нет индекса столбца, который сопоставил бы их друг с другом, потому что сопоставление — семантическое, а не позиционное. Выручка, Сумма продаж и Чистые продажи — это три названия одного и того же понятия, и только понимание заголовка позволяет их выровнять.
Этап консолидации агента превращает это семантическое выравнивание в единую схему:
Магазин / Регион / SKU / ПроданоЕдиниц / Выручка / Месяц
Он считывает каждую исходную книгу, сопоставляет имена заголовков с целевой моделью, выравнивает строки и столбцы, пропускает дублирующиеся строки заголовков и создает одну нормализованную таблицу. Разработчику больше не нужно писать процедуру FindColumnByHeader("Выручка") — в инструкции указывается целевая схема, а агент сам определяет сопоставление для каждого файла.
Это этап с наибольшей разовой отдачей, так как именно он в настоящее время потребляет больше всего времени аналитика и чаще всего ломается при подключении нового магазина.
4. Превращение бизнес-правил в анализ на естественном языке
Как только данные собраны в одном месте, для отчетности требуется суждение, а именно там, где жестко закодированные правила терпит неудачу. В нашем примере используется типичное финансовое правило:
Отметить строки, где выручка упала более чем на 30% или выросла более чем на 50% по сравнению с предыдущим месяцем.
Заметьте, сколько всего заложено в это предложение и насколько неудобно каждое из них выглядит в виде кода:
- Почему 30% и 50%? Это бизнес-пороговые значения с контекстом — сезонный магазин, новый SKU или акция меняют значение того, что считается «необычным». Жестко закодированное
if (change < -0.30)относится к каждому магазину одинаково и вызывает ложные срабатывания из-за сезонности. - Как это изменить? В коде нужно перекомпилировать и развернуть приложение заново. В инструкции аналитик просто меняет одно предложение: «упала более чем на 20%», или «только для Восточного региона», или «отмечать только SKU с продажами более 100 единиц».
- Добавить измерение? Хотите, чтобы правило применялось к каждому магазину и к каждому региону и к каждому месяцу? Вы добавляете условие в инструкцию, а не вложенный цикл.
- Объяснить результат? Агент может добавить столбец
Причинас объяснением из одного предложения для каждой отмеченной строки — то, что невозможно получить с помощью простого сравнения порогов.
Принцип, который вытекает из этого раздела, стоит сформулировать прямо:
Код определяет как; инструкции определяют что.
Разработчик перестает кодировать правило и начинает описывать результат. Правило остается читаемым, редактируемым бизнесом и переживает добавление нового магазина или изменение порога без изменения кода.
Полный пример анализа на основе инструкций, примененный к рабочему процессу ранжирования, см. в руководстве по анализу и ранжированию оценок студентов.
5. От анализа к отчету для руководства
Поиск аномалий — это только половина дела. Результат должен стать книгой, которой действительно можно пользоваться — электронная таблица аналитика не является конечным продуктом; им является сводка для руководства.
Конвейер выглядит так:
Исходные книги
      ↓
Консолидированные данные
      ↓
Аномалии
      ↓
Сводка для руководства
      ↓
PDF
Финальная инструкция формирует результат: лист Сводка в начале с блоком KPI (общая выручка, лучший магазин, худший магазин, количество отмеченных аномалий), таблица ежемесячных трендов, гистограмма выручки по регионам и форматирование, готовое к печати. Указание того же пути для .pdf экспортирует готовый отчет в PDF для рассылки без отдельного шага рендеринга.
Важный вывод: анализ и оформление — это две разные задачи, и агент выполняет обе. Работа аналитика сводится к проверке отмеченного списка и утверждению, а не к пересборке отчета каждый месяц.
6. Создание рабочего процесса на C#
Все вышеперечисленные части управляются одним конвейером на C#. Настройте агента один раз, затем выполните три инструкции последовательно: консолидация, анализ, отчет. Полная настройка — токены, пакеты и подключение проекта — пошагово описана в руководстве Начало работы; здесь мы сосредоточимся на самом рабочем процессе.
using System.IO;
using Spire.Xls;
using Spire.Agent.Office.AI;
using Spire.Agent.Office.Extensions;

AIOptions options = new AIOptions {
    SpireToken = spireToken,
    WorkDir = @"C:\retail-ops\output",
    TimeoutMs = 300000
};

string[] storeFiles = Directory.GetFiles(@"C:\retail-ops\inbox", "*.xlsx");
Directory.CreateDirectory(@"C:\retail-ops\output");
1. Консолидация. Передайте 20 файлов из входящих в качестве вложений и укажите целевую схему. Нормализация из раздела 3 происходит здесь, управляемая инструкцией, а не картой столбцов:
using (Workbook consolidated = new Workbook())
{
    AIResult result = consolidated.AI(options).ExecuteInstruction(
        consolidated,
        "Прочитай каждую книгу региональных продаж во входящих и объедини их в один лист. " +
        "Каждый магазин называет свои столбцы по-разному (например, Sales против Amount, Month против Period); " +
        "нормализуй их к единой схеме: Store, Region, SKU, UnitsSold, Revenue, Month. Пропусти " +
        "дублирующиеся строки заголовков и сохрани объединенный результат как книгу.",
        @"C:\retail-ops\output\consolidated.xlsx",
        storeFiles);

    if (result == null || !result.Success)
        throw new InvalidOperationException($"Консолидация не удалась: {result?.ErrorMessage}");
}
2. Анализ. Загрузите консолидированный файл и сформулируйте правило из раздела 4 на простом английском. Агент добавляет лист Аномалии и оставляет исходные данные нетронутыми:
using (Workbook analysis = new Workbook())
{
    analysis.LoadFromFile(@"C:\retail-ops\output\consolidated.xlsx");

    AIResult result = analysis.AI(options).ExecuteInstruction(
        analysis,
        "Добавь лист 'Аномалии'. Сравни выручку каждого магазина и SKU с предыдущим " +
        "месяцем, отметь строки, где выручка упала более чем на 30% или выросла более чем на 50%, примени " +
        "красную заливку для падений и зеленую для роста, и добавь столбец 'Причина' с " +
        "вероятным объяснением в одно предложение. Оставь исходные листы данных без изменений.",
        @"C:\retail-ops\output\analyzed.xlsx");

    if (result == null || !result.Success)
        throw new InvalidOperationException($"Анализ не удался: {result?.ErrorMessage}");
}
Лист Аномалии появляется рядом с исходными данными, с отмеченными строками, заливками и столбцом Причина, примененными согласно инструкции:
3. Отчет. Составьте сводку для руководства из раздела 5 и экспортируйте её. Параметр savePath сам выбирает формат — .xlsx здесь, .pdf для рассылки:
using (Workbook report = new Workbook())
{
    report.LoadFromFile(@"C:\retail-ops\output\analyzed.xlsx");

    AIResult result = report.AI(options).ExecuteInstruction(
        report,
        "Подготовь отчет для руководства. Добавь лист 'Сводка' в начало с блоком KPI " +
        "(общая выручка, лучший магазин, худший магазин, количество отмеченных аномалий), таблицей " +
        "ежемесячных трендов и гистограммой выручки по регионам. Отформатируй для печати и сохрани готовую " +
        "книгу.",
        @"C:\retail-ops\output\monthly-report.xlsx");

    if (result == null || !result.Success)
        throw new InvalidOperationException($"Генерация отчета не удалась: {result?.ErrorMessage}");
}
Лист Сводка размещается в начале книги, готовый к печати или экспорту в PDF:
Ключевые вызовы API
Workbook.AI(options)— прикрепляет ИИ-обработчик документов к существующему объекту книгиExecuteInstruction(doc, instruction, savePath, attachments)— выполняет один этап и записывает результатAIResult.Success/AIResult.ErrorMessage— проверяет каждый этап и выводит ошибки
Что бы вы писали без агента
Для контраста, традиционный путь через SDK для тех же трех этапов требует поиска каждого столбца по строке заголовка, жесткого кодирования каждого порога и настройки каждой ячейки вручную — и перенастройки всего этого, когда магазин переименовывает столбец или меняется правило:
foreach (string file in storeFiles)
{
    Workbook wb = new Workbook();
    wb.LoadFromFile(file);
    Worksheet sheet = wb.Worksheets[0];

    // Ломается в тот момент, когда магазин называет столбец "Sales" вместо "Revenue".
    int revenueCol = FindColumnByHeader(sheet, "Revenue");
    int storeCol   = FindColumnByHeader(sheet, "Store");

    for (int r = sheet.LastRow; r >= 2; r--)
    {
        double current = double.Parse(sheet.Range[r, revenueCol].Text);
        double prior   = double.Parse(sheet.Range[r, revenueCol + 1].Text);
        double change  = (current - prior) / prior;

        // Один жестко закодированный порог; сезонный магазин вызывает ложные срабатывания.
        if (change < -0.30) sheet.Range[r, revenueCol].Style.Color = Color.Red;
    }
    // ... затем объединение, затем сводка, затем диаграмма -- сотни строк кода на магазин и месяц.
}
Агент не устраняет необходимость в коде — он устраняет необходимость в коде сопоставления. Разница в том, где живет логика: в поиске столбцов и пороговых значениях или в предложении, которое бизнес может прочитать и отредактировать.
7. Где заканчивается ИИ и начинается логика приложения
Более честный способ подумать о границе, чем список «может и не может»: агент не исключает детерминированную логику приложения — он располагается поверх неё.
Приложение по-прежнему владеет всем, что не имеет отношения к пониманию электронной таблицы:
- Обнаружение и доступ к файлам — поиск файлов во входящих, проверка разрешений и их подготовка
- Планирование рабочего процесса — когда запускается отчет, по какому триггеру и в каком порядке
- Контроль источников данных — какие файлы являются авторизованными входными данными и откуда они приходят
- Обработка ошибок и повторные попытки — что происходит, когда файл отсутствует или этап не удался
- Окончательное утверждение — человек проверяет отмеченные аномалии перед подписанием
- Внешняя сверка — сопоставление отчета с системой учета
Агент владеет частями, которые являются по-настоящему семантическими:
- Понимание — чтение того, что на самом деле означает каждый столбец
- Нормализация — выравнивание разнородных схем в одну модель
- Интерпретация — применение бизнес-правила для решения, что является необычным
- Трансформация — превращение «сырых» данных в сводку, диаграмму и форматирование
- Композиция — сборка финальной книги или PDF
Эта структура полезнее, чем таблица возможностей, потому что она говорит вам, куда направить инженерные усилия. Оставьте детерминированную «сантехнику» в коде — где она тестируема и проверяема — и передайте семантическую работу агенту. Каждая сторона делает то, что у неё получается лучше всего.
8. Добавление ИИ в существующий рабочий процесс .NET Excel
Последнее, что стоит прояснить, — как мало нужно перестраивать, чтобы прийти к этому. Если ваше приложение уже работает с Excel через Spire.Xls, модель документа, которой вы уже владеете, является точкой интеграции:
Workbook
   ↓
Workbook.AI(options)
   ↓
ExecuteInstruction(...)
Вы не внедряете новый уровень документа или отдельный сервис обработки документов. Вы добавляете уровень выполнения на естественном языке поверх объекта Workbook, который у вас уже есть. Тот же объект, который открывал, объединял и сохранял ваши файлы, теперь принимает инструкцию и выполняет рабочий процесс, а детерминированный движок Excel гарантирует, что на выходе получится реальный, правильно сформированный файл — с объединенными ячейками, форматами чисел и диаграммами. Тот же паттерн ExecuteInstruction распространяется на документы Word и PDF — см. ИИ-проверка контрактов на C#.
Это ценностное предложение для разработчика Excel, сформулированное в терминах, которыми вы уже мыслите: не «примите ИИ-платформу», а «научите книгу, которую вы уже используете, принимать инструкции». Когда магазин переименовывает столбец или финансовый отдел меняет правило маркировки, исправление — это редактирование предложения, а не перестройка конвейера документов.
9. Часто задаваемые вопросы
Нужно ли мне отправлять данные Excel в облако?
Не обязательно. Spire.Agent.Office работает из вашего собственного приложения, поэтому SDK и обработка документов остаются внутри вашей среды; ваши файлы не загружаются в сторонний сервис для хранения или конвертации. Для анализа контента ИИ нужны соответствующие данные, и они отправляются модели для обработки — это неотъемлемый шаг любого ИИ-рабочего процесса. Если вы развернете свою собственную модель в локальной сети, контент останется полностью в вашей инфраструктуре. Если вы подключаетесь через API размещенной модели, такой как OpenAI или Azure OpenAI, соответствующий контент передается этому провайдеру по сети согласно вашей конфигурации.
Какие форматы Excel поддерживаются?
Ввод охватывает стандартные файлы книг, такие как XLSX и XLS, и агент читает книгу напрямую в её собственном формате. Вывод можно сохранить как XLSX, XLS, CSV, PDF или HTML, поэтому готовый отчет может сразу отправиться в архив или список рассылки.
Может ли это заменить мою финансовую или операционную проверку?
Нет. Агент автоматизирует чтение, нормализацию, анализ и форматирование — часы, которые аналитик тратит каждый месяц, — но окончательное утверждение остается за человеком-рецензентом. Относитесь к отмеченным аномалиям как к списку для проверки, а не как к уже принятому решению.
Чем это отличается от вставки данных в ChatGPT?
Чат-модель может сказать вам, что выглядит необычно, но не может поместить этот ответ в стилизованную книгу со сводным листом, условным форматированием и диаграммой, и не может экспортировать PDF. ИИ-агент Excel объединяет суждение языковой модели с детерминированным уровнем Excel, поэтому на выходе получается реальный, правильно сформированный файл, который ваша команда может открыть и распространить.
Могу ли я использовать свою собственную ИИ-модель?
Да. Spire.Agent.Office поддерживает гибкую интеграцию ИИ-моделей и совместим с основной ИИ-инфраструктурой, включая API размещенных моделей и частные развернутые модели. Вы можете направить агента на свою собственную конечную точку. По вопросам о том, какие провайдеры поддерживаются в вашем развертывании, свяжитесь с нами.
Готовы автоматизировать отчетность в Excel?
Консолидация, анализ аномалий и генерация отчетов — это самые быстрые способы получить пользу: направьте агента на папку входящих, опишите отчет и получите отформатированную книгу или PDF. Следуйте руководству Начало работы, чтобы запустить свой первый рабочий процесс с электронными таблицами в .NET.
Дополнительное чтение
- Руководство по автоматизации анализа и ранжирования оценок студентов — рабочий процесс Excel, который агент выполняет от начала до конца
- ИИ-проверка контрактов на C# — тот же паттерн на основе инструкций, примененный к документам Word и PDF
- Обзор продукта Spire.Agent.Office — ИИ-агент SDK для всех форматов документов Office