
Knowledgebase (2345)
Children categories
Merging PDF files is a common task in many applications, from combining report sections to creating comprehensive document collections. For developers, using Python to merge PDF files programmatically can significantly streamline the process and help build automated workflows.
This article explores how to merge PDFs in Python using Spire.PDF for Python - a robust library designed for efficient PDF manipulation.
Table of Contents:
- 5 Reasons Why You Should Use Python to Combine PDFs
- Step-by-Step: Merge PDF Files in Python
- Advanced: Merge Selected Pages from PDFs in Python
- Batch Processing: Merge Multiple PDF Files in a Folder
- Frequently Asked Questions
- Conclusion
5 Reasons Why You Should Use Python to Combine PDFs
While GUI tools like Adobe Acrobat offer PDF merging capabilities, Python provides distinct advantages for developers and enterprises. Python’s PDF merging feature shines when you need to:
- Process documents in bulk
- Schedule scripts to run automatically (e.g., daily report merging).
- Integrate with data workflows
- Implement business-specific logic
- Deploy in server/cloud environments
Step-by-Step: Merge PDF Files in Python
Step 1: Install Spire.PDF for Python
Before you can start combining PDFs with Spire.PDF for Python, you need to install the library. You can do this using pip, the Python package manager. Open your terminal and run the following command:
pip install Spire.PDF
Step 2: Merge Multiple PDF Files into One
Now, let's dive into the Python code for merging multiple PDF files into a single PDF.
1. Import the Required Classes
First, import the necessary classes from the Spire.PDF library:
from spire.pdf.common import *
from spire.pdf import *
2. Define Paths of PDFs to Merge
Define three PDF file paths and stored them in a list. You can modify these paths or adjust the number of files according to your needs.
inputFile1 = "Sample1.pdf"
inputFile2 = "Sample2.pdf"
inputFile3 = "Sample3.pdf"
files = [inputFile1, inputFile2, inputFile3]
3. Merge PDF Files
The MergeFiles() method combines all PDFs in the list into a new PDF document object.
pdf = PdfDocument.MergeFiles(files)
4. Save the Merged PDF Finally, save the combined PDF to a specified output path.
pdf.Save("output/MergePDF.pdf", FileFormat.PDF)
Full Python Code to Combine PDFs:
from spire.pdf.common import *
from spire.pdf import *

# Create a list of the PDF file paths
inputFile1 = "Sample1.pdf"
inputFile2 = "Sample2.pdf"
inputFile3 = "Sample3.pdf"
files = [inputFile1, inputFile2, inputFile3]

# Merge the PDF documents
pdf = PdfDocument.MergeFiles(files)

# Save the result document
pdf.Save("output/MergePDF.pdf", FileFormat.PDF)
pdf.Close()
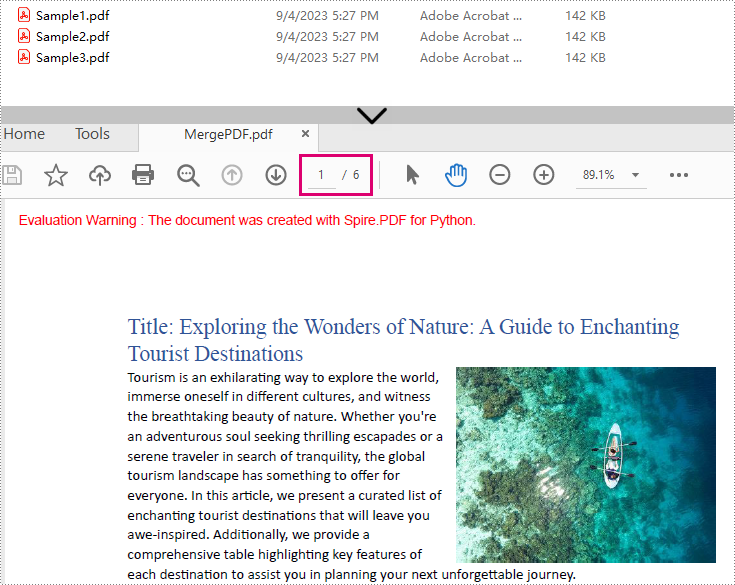
Result: Combine three PDF files (total of 6 pages) into one PDF file.
Advanced: Merge Selected Pages from PDFs in Python
In some cases, you may only want to merge specific pages of multiple PDFs. Spire.PDF for Python makes this easy by allowing you to select pages from different PDF documents and insert them into a new PDF file.
from spire.pdf import *
from spire.pdf.common import *

# Create a list of the PDF file paths
file1 = "Sample1.pdf"
file2 = "Sample2.pdf"
file3 = "Sample3.pdf"
files = [file1, file2, file3]

# Load each PDF file as an PdfDocument object and add them to a list
pdfs = []
for file in files:
    pdfs.append(PdfDocument(file))

# Create an object of PdfDocument class
newPdf = PdfDocument()

# Insert the selected pages from the loaded PDF documents into the new document
newPdf.InsertPage(pdfs[0], 0)
newPdf.InsertPage(pdfs[1], 1)
newPdf.InsertPageRange(pdfs[2], 0, 1)

# Save the new PDF document
newPdf.SaveToFile("output/SelectedPages.pdf")
Explanation:
- PdfDocument(): Initializes a new PDF document object.
- InsertPage(): Insert a specified page to the new PDF (Page index starts at 0).
- InsertPageRange(): Inserts a range of pages to the new PDF.
- SaveToFile(): Save the combined PDF to the specified output path.
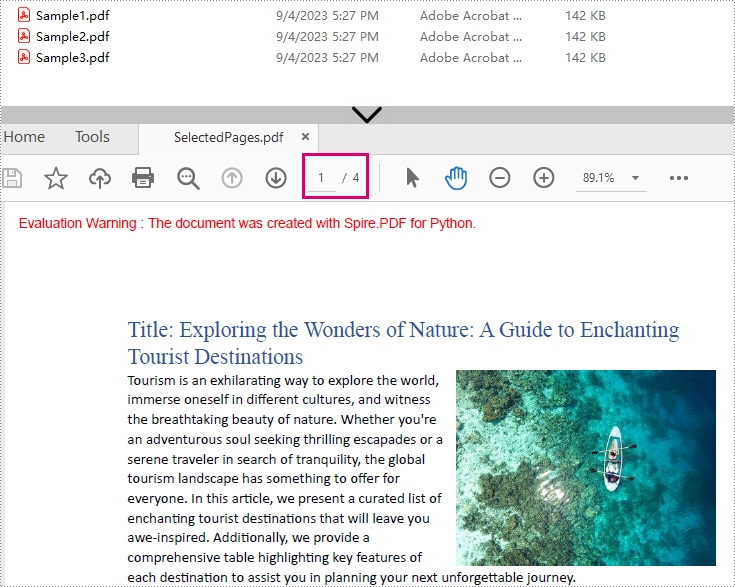
Result: Combine selected pages from three separate PDF files into a new PDF.
Batch Processing: Merge Multiple PDF Files in a Folder
The Python script loops through each source PDF in a specified folder, then appends all pages from the source PDFs to a new PDF file.
import os
from spire.pdf.common import *
from spire.pdf import *

# Specify the directory where the source PDFs are stored
folder = "pdf_folder/"

# Create a new PDF to hold the combined content.
merged_pdf = PdfDocument()

# Loop through each source PDF
for file in os.listdir(folder):
    if file.endswith(".pdf"):
        pdf = PdfDocument(os.path.join(folder, file))
        # Appends all pages from each source PDF to the new PDF
        merged_pdf.AppendPage(pdf)
        pdf.Close()  # Close source PDF

# Save the merged PDF after processing all files
merged_pdf.SaveToFile("BatchCombinePDFs.pdf")
merged_pdf.Close()  # Release resources
Frequently Asked Questions
Q1: Is Spire.PDF for Python free?
A: Spire.PDF for Python offers a 30-day free trial with full features. There’s also a free version available but with page limits.
Q2: Can I merge scanned/image-based PDFs?
A: Yes, Spire.PDF handles image-only PDFs. However, OCR/text extraction requires the Spire.OCR for Python library.
Q3: How to add page numbers to the merged PDF?
A: Refer to this comprehensive guide: Add Page Numbers to PDF in Python
Q4: How to reduce the size of the merged PDF?
A: You can compress the high-resolution images and fonts contained in the merged PDF file. A related tutorial: Compress PDF Documents in Python.
Conclusion
Merging PDFs with Python doesn't have to be a complex task. With Spire.PDF for Python, you can efficiently combine multiple PDF files into a single document with just a few lines of code. Whether you need to merge entire documents, specific pages, or a batch merge, this guide outlines step-by-step instructions to help you automate the PDF merging process.
Explore Spire.PDF's online documentation for more PDF prcessing features with Python.
Creating, reading, and updating Word documents is a common need for many developers working with the Python programming language. Whether it's generating reports, manipulating existing documents, or automating document creation processes, having the ability to work with Word documents programmatically can greatly enhance productivity and efficiency. In this article, you will learn how to create, read, or update Word documents in Python using Spire.Doc for Python.
- Create a Word Document from Scratch in Python
- Read Text of a Word Document in Python
- Update a Word Document in Python
Install Spire.Doc for Python
This scenario requires Spire.Doc for Python and plum-dispatch v1.7.4. They can be easily installed in your Windows through the following pip command.
pip install Spire.Doc
If you are unsure how to install, please refer to this tutorial: How to Install Spire.Doc for Python on Windows
Create a Word Document from Scratch in Python
Spire.Doc for Python offers the Document class to represent a Word document model. A document must contain at least one section (represented by the Section class) and each section is a container for various elements such as paragraphs, tables, charts, and images. This example shows you how to create a simple Word document containing several paragraphs using Spire.Doc for Python.
- Create a Document object.
- Add a section using Document.AddSection() method.
- Set the page margins through Section.PageSetUp.Margins property.
- Add several paragraphs to the section using Section.AddParagraph() method.
- Add text to the paragraphs using Paragraph.AppendText() method.
- Create a ParagraphStyle object, and apply it to a specific paragraph using Paragraph.ApplyStyle() method.
- Save the document to a Word file using Document.SaveToFile() method.
- Python
from spire.doc import *
from spire.doc.common import *
# Create a Document object
doc = Document()
# Add a section
section = doc.AddSection()
# Set the page margins
section.PageSetup.Margins.All = 40
# Add a title
titleParagraph = section.AddParagraph()
titleParagraph.AppendText("Introduction of Spire.Doc for Python")
# Add two paragraphs
bodyParagraph_1 = section.AddParagraph()
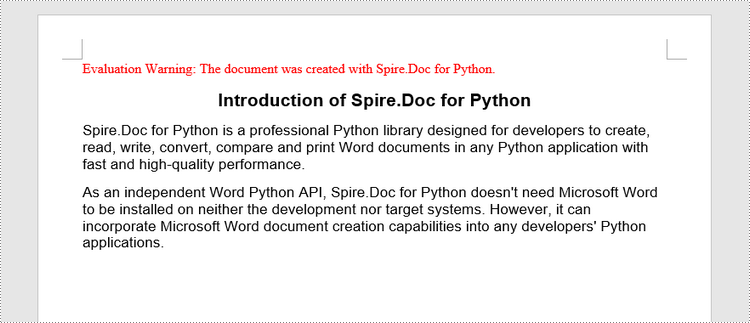
bodyParagraph_1.AppendText("Spire.Doc for Python is a professional Python library designed for developers to " +
"create, read, write, convert, compare and print Word documents in any Python application " +
"with fast and high-quality performance.")
bodyParagraph_2 = section.AddParagraph()
bodyParagraph_2.AppendText("As an independent Word Python API, Spire.Doc for Python doesn't need Microsoft Word to " +
"be installed on neither the development nor target systems. However, it can incorporate Microsoft Word " +
"document creation capabilities into any developers' Python applications.")
# Apply heading1 to the title
titleParagraph.ApplyStyle(BuiltinStyle.Heading1)
# Create a style for the paragraphs
style2 = ParagraphStyle(doc)
style2.Name = "paraStyle"
style2.CharacterFormat.FontName = "Arial"
style2.CharacterFormat.FontSize = 13
doc.Styles.Add(style2)
bodyParagraph_1.ApplyStyle("paraStyle")
bodyParagraph_2.ApplyStyle("paraStyle")
# Set the horizontal alignment of the paragraphs
titleParagraph.Format.HorizontalAlignment = HorizontalAlignment.Center
bodyParagraph_1.Format.HorizontalAlignment = HorizontalAlignment.Left
bodyParagraph_2.Format.HorizontalAlignment = HorizontalAlignment.Left
# Set the after spacing
titleParagraph.Format.AfterSpacing = 10
bodyParagraph_1.Format.AfterSpacing = 10
# Save to file
doc.SaveToFile("output/WordDocument.docx", FileFormat.Docx2019)
Read Text of a Word Document in Python
To get the text of an entire Word document, you could simply use Document.GetText() method. The following are the detailed steps.
- Create a Document object.
- Load a Word document using Document.LoadFromFile() method.
- Get text from the entire document using Document.GetText() method.
- Python
from spire.doc import *
from spire.doc.common import *
# Create a Document object
doc = Document()
# Load a Word file
doc.LoadFromFile("C:\\Users\\Administrator\\Desktop\\WordDocument.docx")
# Get text from the entire document
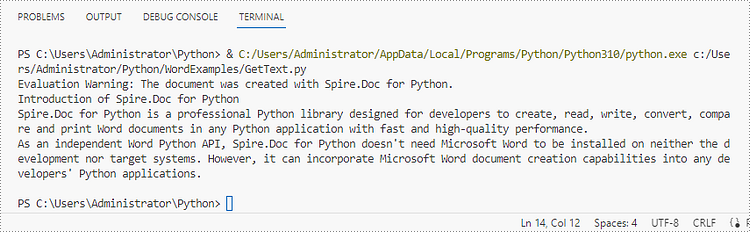
text = doc.GetText()
# Print text
print(text)
Update a Word Document in Python
To access a specific paragraph, you can use the Section.Paragraphs[index] property. If you want to modify the text of the paragraph, you can reassign text to the paragraph through the Paragraph.Text property. The following are the detailed steps.
- Create a Document object.
- Load a Word document using Document.LoadFromFile() method.
- Get a specific section through Document.Sections[index] property.
- Get a specific paragraph through Section.Paragraphs[index] property.
- Change the text of the paragraph through Paragraph.Text property.
- Save the document to another Word file using Document.SaveToFile() method.
- Python
from spire.doc import *
from spire.doc.common import *
# Create a Document object
doc = Document()
# Load a Word file
doc.LoadFromFile("C:\\Users\\Administrator\\Desktop\\WordDocument.docx")
# Get a specific section
section = doc.Sections.get_Item(0)
# Get a specific paragraph
paragraph = section.Paragraphs.get_Item(1)
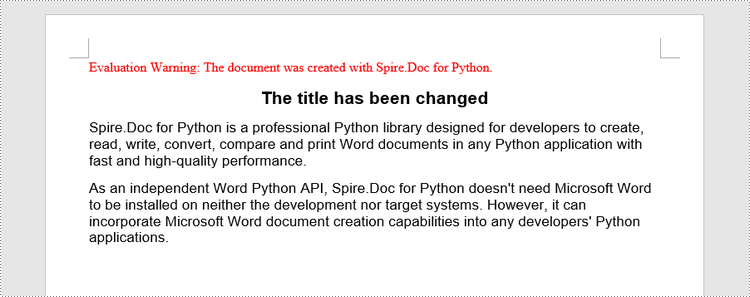
# Change the text of the paragraph
paragraph.Text = "The title has been changed"
# Save to file
doc.SaveToFile("output/Updated.docx", FileFormat.Docx2019)
Apply for a Temporary License
If you'd like to remove the evaluation message from the generated documents, or to get rid of the function limitations, please request a 30-day trial license for yourself.
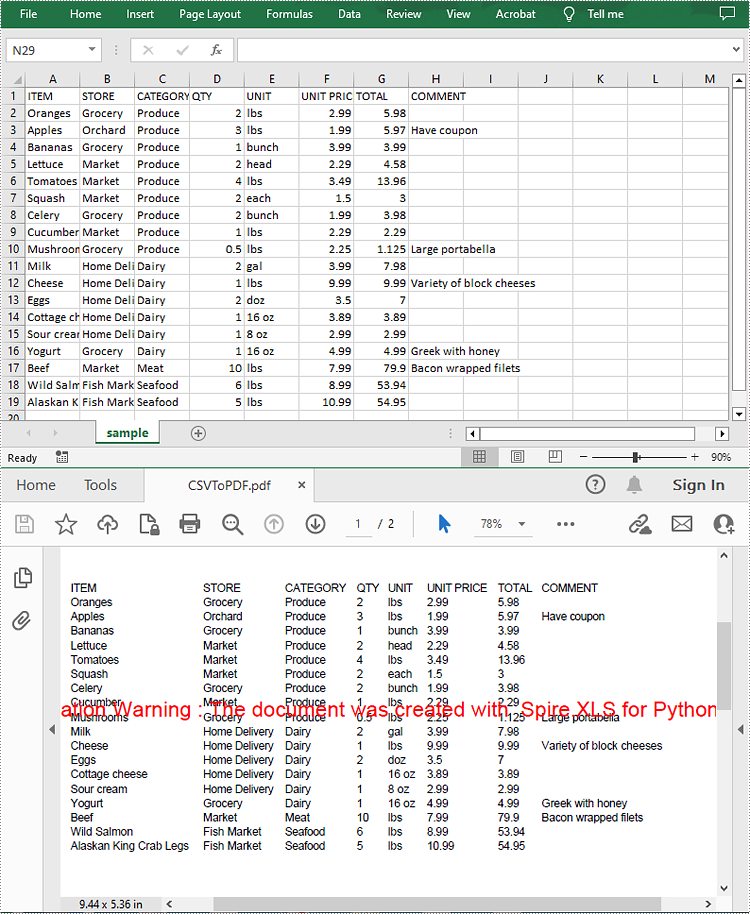
A CSV (Comma-Separated Values) file is a plain text file used to store tabular data. Although CSV files are widely supported by spreadsheet programs, there may still be times when you need to convert them to PDF files to ensure broader accessibility and also enable security features. This article will demonstrate how to convert CSV to PDF in Python using Spire.XLS for Python.
Install Spire.XLS for Python
This scenario requires Spire.XLS for Python and plum-dispatch v1.7.4. They can be easily installed in your Windows through the following pip command.
pip install Spire.XLS
If you are unsure how to install, please refer to this tutorial: How to Install Spire.XLS for Python on Windows
Convert CSV to PDF in Python
The Workbook.SaveToFile() method provided by Spire.XLS for Python allows to save a CSV file as a PDF file. The following are the detailed steps.
- Create a Workbook object.
- Load a CSV file using Workbook.LoadFromFile() method.
- Set the Workbook.ConverterSetting.SheetFitToPage property as true to ensure the worksheet is rendered to one PDF page.
- Get the first worksheet in the Workbook using Workbook.Worksheets[] property.
- Loop through the columns in the worksheet and auto-fit the width of each column using Worksheet.AutoFitColumn() method.
- Convert the CSV file to PDF using Workbook.SaveToFile() method.
- Python
from spire.xls import *
from spire.xls.common import *

# Create a Workbook object
workbook = Workbook()

# Load a CSV file
workbook.LoadFromFile("sample.csv", ",", 1, 1)

# Set the SheetFitToPage property as true
workbook.ConverterSetting.SheetFitToPage = True

# Get the first worksheet
sheet = workbook.Worksheets[0]

# Autofit columns in the worksheet
i = 1
while i < sheet.Columns.Length:
    sheet.AutoFitColumn(i)
    i += 1

# Save the CSV file to PDF
workbook.SaveToFile("CSVToPDF.pdf", FileFormat.PDF)
workbook.Dispose()
Apply for a Temporary License
If you'd like to remove the evaluation message from the generated documents, or to get rid of the function limitations, please request a 30-day trial license for yourself.
