Как конвертировать HTML в PDF: Полное руководство для каждого пользователя
Быстрая навигация:
| Сценарий использования | Рекомендуемый метод |
|---|---|
| Разовое личное использование | Печать в PDF через браузер |
| Быстрое и безопасное преобразование | Онлайн-конвертер CloudXDocs |
| Разработанная автоматизация | Spire.PDF для .NET |
Введение
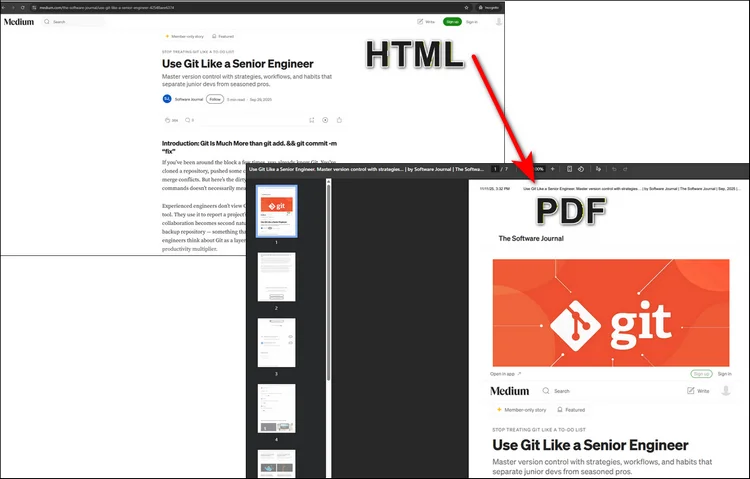
Вам когда-нибудь было нужно сохранить веб-страницу или HTML-файл в формате PDF для удобного обмена, печати или архивирования? Независимо от того, являетесь ли вы веб-разработчиком, создающим отчеты, бизнес-пользователем, сохраняющим счета-фактуры, или просто человеком, который хочет иметь чистую, портативную версию веб-страницы, преобразование HTML в PDF — это практичное решение.
В этом руководстве мы объясним, как преобразовать HTML в PDF, используя несколько методов — от онлайн-инструментов до программных решений — чтобы вы могли выбрать тот, который наилучшим образом соответствует вашим потребностям.
Почему стоит конвертировать HTML в PDF
Прежде чем углубляться в методы, полезно понять, почему преобразование HTML в PDF стало такой распространенной необходимостью. Независимо от того, архивируете ли вы веб-страницы, создаете загружаемые отчеты или делитесь согласованными макетами на разных устройствах, преобразование в PDF гарантирует, что ваш контент будет выглядеть именно так, как задумано.
Ниже перечислены некоторые основные преимущества сохранения HTML в формате PDF:
- Сохраняет макет и дизайн: преобразование HTML в PDF гарантирует, что исходное форматирование, шрифты и изображения вашей веб-страницы останутся в идеальном состоянии, сохраняя профессиональный и единообразный вид на всех устройствах.
- Обеспечивает доступ в автономном режиме: после преобразования ваш контент можно просматривать в любое время и в любом месте — даже без подключения к Интернету — что делает его идеальным для отчетов, руководств и заархивированных страниц.
- Обеспечивает легкий обмен и печать: PDF-файлы универсально поддерживаются, компактны и готовы к печати, что позволяет легко распространять ваш контент, не беспокоясь о совместимости с браузерами или устройствами.
- Предлагает повышенную безопасность и профессионализм: вы можете применять пароли, водяные знаки и цифровые подписи для защиты конфиденциальной информации, одновременно укрепляя свой бренд.
Метод 1. Преобразование HTML в PDF с помощью браузера (встроенная опция браузера)
Плюсы:
- Не требуются дополнительные инструменты
- Работает на Windows, macOS и Linux
Минусы:
- Ограниченные возможности настройки (нет поддержки верхних и нижних колонтитулов или скриптов)
- Непоследовательный рендеринг для динамических страниц
Большинство современных браузеров позволяют «печатать» веб-страницу непосредственно в PDF, что делает это одним из самых простых способов сохранения онлайн-контента. Всего за несколько кликов вы можете захватить полный макет, изображения и текст любой веб-страницы, превратив ее в чистый, легко распространяемый и легко печатаемый документ. Это отлично подходит для базовых потребностей в преобразовании, но не идеально для разработчиков или автоматизированных рабочих процессов.
Вот полное руководство по использованию функции печати для преобразования HTML в формат PDF с помощью браузера:
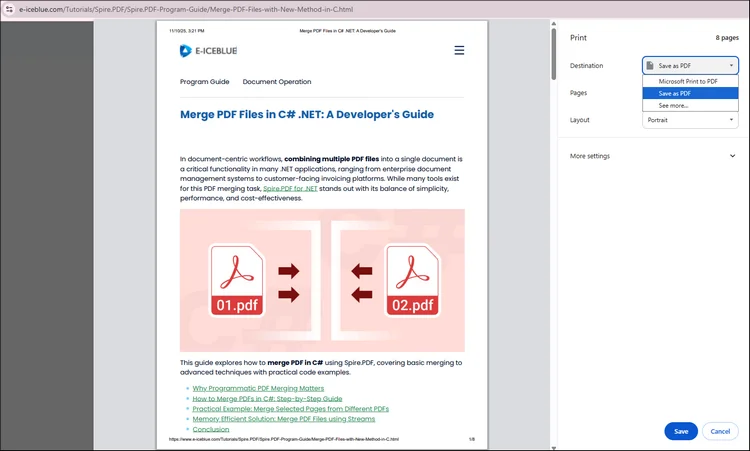
Шаг 1. Откройте свой HTML-файл или веб-сайт в Chrome или Edge. Нажмите «Ctrl + P (Windows)» или «cmd + P (Mac)».
Шаг 2. Появится новое окно настроек принтера, и вам просто нужно выбрать «Сохранить как PDF». Нажмите «Сохранить» и выберите папку назначения.
Метод 2. Используйте онлайн-конвертер HTML в PDF (быстро и без установки)
Плюсы:
- 100% онлайн — не требуется установка программного обеспечения
- Работает на всех устройствах и браузерах
- Быстро и просто в использовании
Минусы:
- Нет опции пакетного преобразования
- Требуется доступ в Интернет
Если вам нужно преобразовать всего несколько веб-страниц, онлайн-инструмент — это, безусловно, самый быстрый и удобный вариант. С помощью всего лишь URL-адреса или загруженного HTML-файла вы можете получить мгновенные результаты без установки какого-либо программного обеспечения.
Один из отличных вариантов — это CloudXDocs HTML to PDF Converter — бесплатный браузерный инструмент, который за считанные секунды преобразует ваши веб-страницы в высококачественные, готовые к печати PDF-файлы. Он быстрый, простой и идеально подходит для тех, кто хочет получить профессиональные результаты без какой-либо настройки.
Следуйте простому руководству ниже, чтобы преобразовать HTML в PDF с помощью CloudxDocs:
Шаг 1. Перейдите на официальный сайт CloudXDocs HTML to PDF Converter.
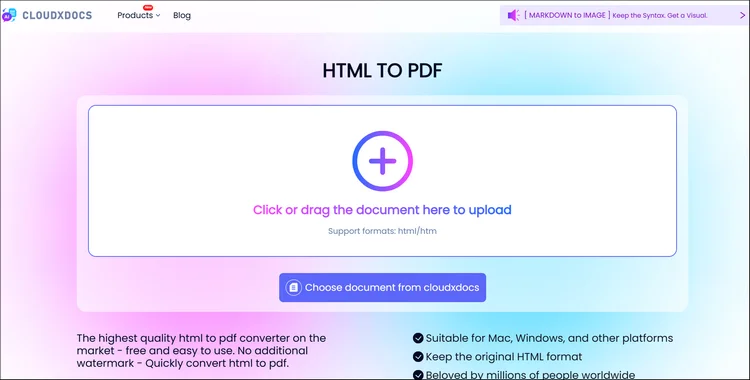
Шаг 2. Нажмите или перетащите, чтобы загрузить свой .html-файл, и подождите, пока CloudxDocs проанализирует файл.
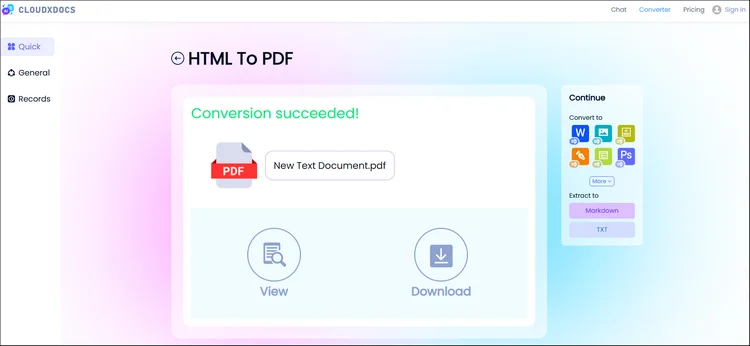
Шаг 3. CloudxDocs начнет преобразование сразу после анализа файла, и весь процесс не займет много времени.
Шаг 4. Мгновенно загрузите созданный PDF-файл и сохраните его в локальной папке.
Метод 3. Программное преобразование HTML в PDF с помощью C# (для разработчиков)
Если вы хотите динамически генерировать PDF-файлы из HTML, например, для счетов-фактур, отчетов или документации, программное преобразование является самым мощным подходом. Оно предлагает полный контроль над макетом, стилем и автоматизацией, что делает его идеальным для крупномасштабных или серверных приложений.
Используя Spire.PDF для .NET, разработчики могут легко преобразовывать HTML-файлы, URL-адреса или строки HTML в PDF всего за несколько строк кода C#, обеспечивая высокую точность и согласованный рендеринг в различных средах.
Почему стоит выбрать Spire.PDF для .NET в качестве программного решения?
- Высококачественный рендеринг, идентичный выводу браузера
- Предлагает полную настройку PDF-файлов, включая добавление водяных знаков, полей, верхних/нижних колонтитулов и многого другого
- Полностью совместим с .NET Framework, .NET Core и .NET 6+
Полные шаги по использованию Spire.PDF для .NET перечислены ниже:
Шаг 1. Установите, чтобы добавить Spire.PDF для .NET в качестве зависимости на вашем компьютере.
Вы можете установить его, загрузив с официальной веб-страницы, напрямую через NuGet или используя следующую строку кода:
PM> Install-Package Spire.PDF
Шаг 2. Скопируйте приведенный ниже пример кода для успешного управления преобразованием.
Пример кода с исходным HTML-файлом:
using System.IO;
using Spire.Additions.Qt;
using System.Drawing;
using Spire.Pdf.Graphics;

namespace ConvertHtmlStringToPdfWithPlugin
{
    class Program
    {
        static void Main(string[] args)
        {
            //Get the HTML string from a .html file
            string htmlString = File.ReadAllText( @"C:\Users\Administrator\Desktop\Document\Html\Sample.html");

            //Specify the output file path
            string fileName = "HtmlStringToPdf.pdf";

            //Specify the plugin path
            string pluginPath = "F:\\Libraries\\Plugin\\plugins-windows-x64\\plugins";

            //Set plugin path
            HtmlConverter.PluginPath = pluginPath;

            //Convert HTML string to PDF
            HtmlConverter.Convert(htmlString, fileName, true, 100000, new Size(1080, 1000), new PdfMargins(0), LoadHtmlType.SourceCode);
        }
    }
}
Пример кода с прямым URL-адресом:
Совет: чтобы использовать следующий пример кода, вам необходимо сначала загрузить QTPlugin на свой компьютер. Вы можете нажать на следующую ссылку, чтобы загрузить напрямую:
Пример кода:
using Spire.Pdf.Graphics;
using Spire.Additions.Qt;
using System.Drawing;

namespace ConvertUrlToPdf
{
    class Program
    {
        static void Main(string[] args)
        {
            //Specify the URL path
            string url = "https://www.wikipedia.org/";

            //Specify the output file path
            string fileName = "UrlToPdf.pdf";

            //Specify the plugin path
             string pluginPath = "F:\\Libraries\\Plugin\\plugins-windows-x64\\plugins";

            //Set the plugin path
             HtmlConverter.PluginPath = pluginPath;

            //Convert URL to PDF
            HtmlConverter.Convert(url, fileName, true, 100000, new Size(1080, 1000), new PdfMargins(0));
        }
    }
}
Прочтите следующий пост, чтобы получить более подробную информацию: Преобразование HTML в PDF с помощью C#
РЕЗУЛЬТАТ:
Заключение
Преобразование HTML в PDF может быть таким простым или сложным, как вам нужно. Если вы просто хотите быстро сохранить веб-страницу, идеальным вариантом будет онлайн-конвертер, такой как CloudXDocs. Но если вы разработчик, создающий автоматизированную систему генерации PDF, Spire.PDF для .NET обеспечивает контроль и гибкость профессионального уровня.
Независимо от того, работаете ли вы онлайн или пишете код локально, эти инструменты делают преобразование HTML в PDF легким и надежным.
Узнать больше:
How to Change HTML to PDF: A Complete Guide for Every User
Table of Contents

Quick Navigation:
| Use Case | Recommended Method |
|---|---|
| Occasional personal use | Browser Print to PDF |
| Fast and secure conversion | CloudXDocs Online Converter |
| Developed automation | Spire.PDF for .NET |
Introduction
Have you ever needed to save a webpage or HTML file as a PDF for easy sharing, printing, or archiving? Whether you're a web developer generating reports, a business user capturing invoices, or simply someone who wants a clean, portable version of a webpage, converting HTML to PDF is a practical solution.
In this guide, we'll explain how to change HTML to PDF using several methods—from online tools to programming solutions—so you can choose the one that best fits your needs.
Why You Should Convert HTML to PDF
Before diving into the methods, it's helpful to understand why converting HTML to PDF has become such a common need. Whether you're archiving web pages, generating downloadable reports, or sharing consistent layouts across devices, PDF conversion ensures your content looks exactly as intended.
Some main benefits of saving HTML to PDF format are listed below:
- Preserves layout and design: Converting HTML to PDF ensures your webpage's original formatting, fonts, and images remain perfectly intact, maintaining a professional and consistent look across all devices.
- Provides offline accessibility: Once converted, your content can be viewed anytime and anywhere — even without an internet connection — making it ideal for reports, manuals, and archived pages.
- Enables effortless sharing and printing: PDFs are universally supported, compact, and print-ready, allowing you to distribute your content easily without worrying about browser or device compatibility.
- Offers enhanced security and professionalism: You can apply passwords, watermarks, and digital signatures to protect sensitive information while reinforcing your brand identity.
Method 1. Change HTML to PDF with Browser (Built-in Browser Option)
Pros:
- No extra tools needed
- Works on Windows, macOS, and Linux
Cons:
- Limited customization (no headers, footers, or scripting support)
- Inconsistent rendering for dynamic pages
Most modern browsers allow you to "print" a webpage to PDF directly, making it one of the simplest ways to preserve online content. With just a few clicks, you can capture the full layout, images, and text of any webpage, turning it into a clean, shareable, and easily printable document. This is great for basic conversion needs but not ideal for developers or automated workflows.
Here is the full guide of using the print function to convert HTML in PDF format with browser:
Step 1. Open your HTML file or website in Chrome or Edge. Press "Ctrl + P (Windows)" or "cmd + P (Mac)".
Step 2. A new window of printer setting will jump out, and you just need to select "Save as PDF". Click "Save" and choose the destination folder.
Method 2. Use an Online HTML to PDF Converter (Quick & No Installation Needed)
Pros:
- 100% online — no software installation needed
- Works on all devices and browsers
- Fast and simple to use
Cons:
- No batch conversion option
- Requires internet access
If you only need to convert a few web pages, an online tool is by far the quickest and most convenient option. With just a URL or uploaded HTML file, you can get instant results without installing any software.
One great choice is CloudXDocs HTML to PDF Converter — a free, browser-based tool that transforms your webpages into high-quality, print-ready PDFs in seconds. It's fast, simple, and perfect for anyone who wants professional results with zero setup.
Follow the simple tutorial below to convert HTML to PDF with CloudxDocs:
Step 1. Go to the official website of CloudXDocs HTML to PDF Converter.
Step 2. Click or drag to upload your .html file and wait for CloudxDocs to analyze the file.
Step 3. CloudxDocs will start converting right after file analysis, and the whole conversion won't take much time.
Step 4. Download the generated PDF instantly and save it on your local file location.
Method 3. Convert HTML to PDF Programmatically with C# (for Developers)
If you want to generate PDFs from HTML dynamically, such as for invoices, reports, or documentation, programmatic conversion is the most powerful approach. It offers full control over layout, styling, and automation, making it ideal for large-scale or server-side applications.
Using Spire.PDF for .NET, developers can easily convert HTML files, URLs, or HTML strings to PDF in just a few lines of C# code, ensuring high fidelity and consistent rendering across different environments.
Why choose Spire.PDF for .NET as programmatic solution?
- High-quality rendering identical to browser output
- Offers complete customization for PDF files, including adding watermarks, margins, headers/footers, and more
- Fully compatible with .NET Framework, .NET Core, and .NET 6+
Full steps of using Spire.PDF for .NET are listed below:
Step 1. Install to add Spire.PDF for .NET as the dependency on your computer.
You can install it by downloading it from the official webpage, through NuGet directly, or use the following code line:
PM> Install-Package Spire.PDF
Step 2. Copy the example code below to manage conversion successfully.
Example Code with the original HTML file:
using System.IO;
using Spire.Additions.Qt;
using System.Drawing;
using Spire.Pdf.Graphics;

namespace ConvertHtmlStringToPdfWithPlugin
{
    class Program
    {
        static void Main(string[] args)
        {
            //Get the HTML string from a .html file
            string htmlString = File.ReadAllText(@"C:\Users\Administrator\Desktop\Document\Html\Sample.html");

            //Specify the output file path
            string fileName = "HtmlStringToPdf.pdf";

            //Specify the plugin path
            string pluginPath = "F:\\Libraries\\Plugin\\plugins-windows-x64\\plugins";

            //Set plugin path
            HtmlConverter.PluginPath = pluginPath;

            //Convert HTML string to PDF
            HtmlConverter.Convert(htmlString, fileName, true, 100000, new Size(1080, 1000), new PdfMargins(0), LoadHtmlType.SourceCode);
        }
    }
}
Example Code with URL directly:
Tip: To use the following sample code, you should download a QTPlugin on your computer first. You can click the following link to download directly:
Sample Code:
using Spire.Pdf.Graphics;
using Spire.Additions.Qt;
using System.Drawing;

namespace ConvertUrlToPdf
{
    class Program
    {
        static void Main(string[] args)
        {
            //Specify the URL path
            string url = "https://www.wikipedia.org/";

            //Specify the output file path
            string fileName = "UrlToPdf.pdf";

            //Specify the plugin path
             string pluginPath = "F:\\Libraries\\Plugin\\plugins-windows-x64\\plugins";

            //Set the plugin path
             HtmlConverter.PluginPath = pluginPath;

            //Convert URL to PDF
            HtmlConverter.Convert(url, fileName, true, 100000, new Size(1080, 1000), new PdfMargins(0));
        }
    }
}
Read the following post to get more details: Convert HTML to PDF with C#
RESULT:
Conclusion
Converting HTML to PDF can be as simple or as advanced as you need it to be. If you just want to save a webpage quickly, an online converter like CloudXDocs is ideal. But if you're a developer building an automated PDF generation system, Spire.PDF for .NET provides professional-grade control and flexibility.
Whether you're working online or coding locally, these tools make changing HTML to PDF effortless and reliable.
Learn more:
Come modificare gli sfondi delle diapositive di PowerPoint — 5 metodi
Indice
- Metodo 1. Cambiare lo Sfondo Usando "Formato Sfondo"
- Metodo 2. Usare un'Immagine di Sfondo Personalizzata
- Metodo 3. Applicare lo Sfondo a Tutte le Diapositive tramite lo Schema Diapositiva
- Metodo 4. Cambiare lo Sfondo con una Macro VBA
- Metodo 5. Cambiare lo Sfondo Programmaticamente con Python
- Tabella di Confronto: Quale Metodo Scegliere?
- Riepilogo
- Domande Frequenti sul Cambiamento dello Sfondo delle Diapositive
PowerPoint è ampiamente utilizzato per presentare idee, report e contenuti di marketing. Lo sfondo di una diapositiva non si limita a decorare: imposta il tono, migliora la leggibilità e rafforza il branding. La scelta dello sfondo giusto può rendere qualsiasi presentazione più professionale e visivamente accattivante.
Gli sfondi delle diapositive possono essere personalizzati manualmente utilizzando strumenti integrati come colori a tinta unita, sfumature, motivi o immagini. Per gli utenti avanzati, l'automazione con VBA o Python (Spire.Presentation) aiuta a risparmiare tempo su più diapositive o presentazioni. Questo articolo illustra cinque metodi pratici per cambiare gli sfondi delle diapositive, dalle modifiche manuali alle soluzioni programmatiche.
Panoramica dei Metodi
- Metodo 1. Cambiare lo Sfondo Usando "Formato Sfondo"
- Metodo 2. Usare un'Immagine di Sfondo Personalizzata
- Metodo 3. Applicare lo Sfondo a Tutte le Diapositive tramite lo Schema Diapositiva
- Metodo 4. Cambiare lo Sfondo con una Macro VBA
- Metodo 5. Cambiare lo Sfondo Programmaticamente con Python
Metodo 1. Cambiare lo Sfondo Usando "Formato Sfondo"
Uno dei modi più semplici per cambiare lo sfondo di una diapositiva è attraverso la funzione Formato Sfondo di PowerPoint. Offre diverse opzioni di riempimento — Tinta unita, Sfumatura, Immagine o trama e Motivo — tutte accessibili da un unico riquadro.
Come fare:
- Apri la tua presentazione PowerPoint.
- Seleziona la diapositiva che vuoi modificare.
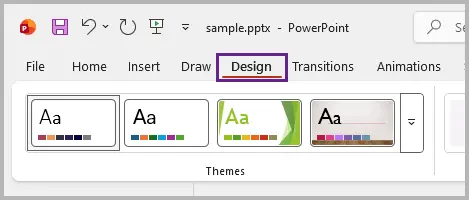
- Vai alla scheda Progettazione nella barra multifunzione.
- Fai clic su Formato Sfondo all'estrema destra.
- Scegli il tipo di riempimento preferito:
- Tinta unita: Scegli un unico colore per un aspetto pulito e professionale.
- Riempimento sfumato: Mescola due o più colori in modo uniforme per un effetto dinamico.
- Riempimento a immagine o trama: Applica un'immagine o una delle trame integrate di PowerPoint.
- Riempimento a motivo: Usa disegni ripetuti come strisce o punti per sfondi discreti.
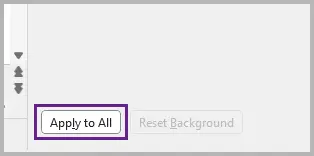
- Fai clic su Applica a tutte per utilizzare lo stesso sfondo su ogni diapositiva, oppure lascia deselezionato per applicarlo solo alla diapositiva corrente.

Suggerimenti:
- Scegli colori che contrastino bene con il testo e gli elementi visivi. Per la leggibilità, usa sfondi chiari con testo scuro o viceversa.
- Usa il Copia formato per copiare rapidamente uno stile di sfondo da una diapositiva all'altra.
Quando usarlo:
Questo metodo è ideale per la maggior parte degli utenti che desiderano uno sfondo coerente e professionale senza alcuno sforzo. È rapido, intuitivo e si integra perfettamente con i temi integrati di PowerPoint.
Metodo 2. Usare un'Immagine di Sfondo Personalizzata
Sebbene Formato Sfondo supporti i riempimenti a immagine, l'inserimento manuale di un'immagine offre un maggiore controllo creativo. Usa questo approccio quando devi posizionare, ritagliare, stratificare o coprire parzialmente la diapositiva con elementi visivi — ad esempio, posizionando un'immagine principale, sfalsando una foto dietro il testo o componendo più immagini e forme.
Guida rapida:
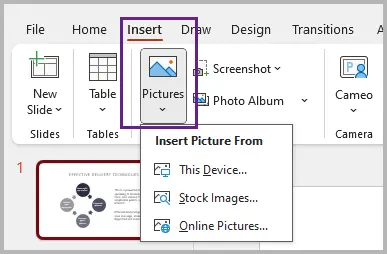
- Vai su Inserisci → Immagini → Questo dispositivo (o fonte online).
- Scegli e inserisci la tua immagine.
- Ridimensiona o ritagliala per adattarla al tuo design.
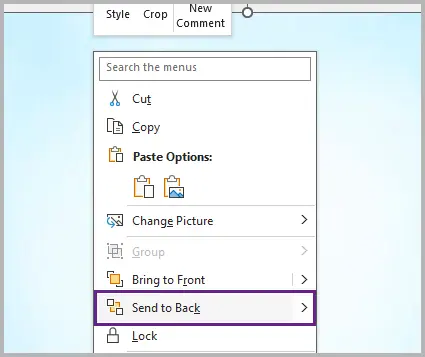
- Fai clic con il pulsante destro del mouse sull'immagine → Porta in secondo piano in modo che testo e oggetti appaiano sopra.
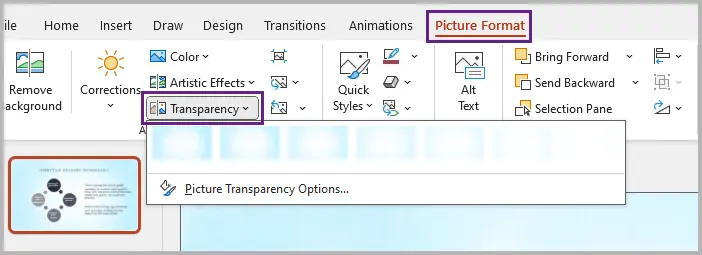
- Regola la trasparenza se necessario per evitare che lo sfondo sovrasti il contenuto della diapositiva.
Suggerimenti:
- Usa questo metodo per diapositive di spicco, come pagine di copertina o transizioni, in cui desideri un'immagine distinta dal resto della presentazione.
- Mantieni le dimensioni dei file ridotte — comprimi le immagini di grandi dimensioni per evitare un caricamento lento della presentazione.
Quando usarlo:
Scegli questo approccio quando hai bisogno di un posizionamento preciso, una composizione unica o effetti visivi a più livelli che vanno oltre ciò che offre Formato Sfondo.
Metodo 3. Applicare lo Sfondo a Tutte le Diapositive tramite lo Schema Diapositiva
Se desideri applicare uno sfondo in modo coerente a tutte le diapositive — comprese quelle future che aggiungerai — lo Schema Diapositiva è la soluzione migliore. Questo metodo garantisce che la tua presentazione mantenga un branding uniforme e fa risparmiare tempo durante la modifica di presentazioni di grandi dimensioni.
Passo dopo passo:
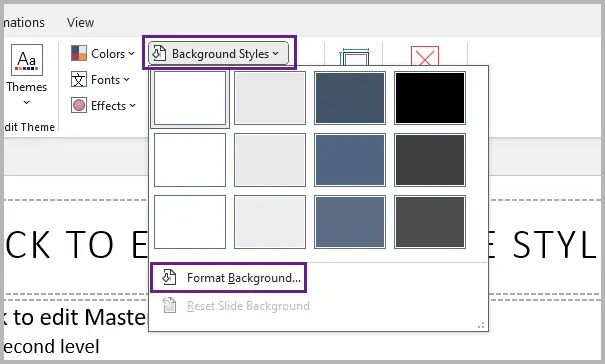
- Vai su Visualizza → Schema diapositiva .
- Seleziona la diapositiva master in cima nel pannello di sinistra.
- Fai clic su Stili sfondo → Formato sfondo e scegli lo sfondo desiderato (colore, sfumatura, immagine o motivo).
- Chiudi la visualizzazione Schema diapositiva per tornare al normale editor di diapositive.

Suggerimenti:
- Crea più layout di Schema Diapositiva, ognuno con uno sfondo diverso, per separare visivamente le sezioni della presentazione.
- Blocca gli elementi chiave (loghi, forme di sfondo) nello schema per evitare modifiche accidentali.
Quando usarlo:
Usa lo Schema Diapositiva quando crei modelli, presentazioni aziendali o mazzi didattici che richiedono uno sfondo coerente su tutte le diapositive e i layout.
Metodo 4. Cambiare lo Sfondo con una Macro VBA
Per gli utenti esperti che hanno familiarità con lo scripting, VBA (Visual Basic for Applications) offre un modo per automatizzare le modifiche dello sfondo direttamente all'interno di PowerPoint. È utile quando è necessario aggiornare rapidamente più diapositive o presentazioni con le stesse impostazioni.
Esempio di script VBA:
Sub SetSlideBackgroundColor()
    Dim sld As Slide
    For Each sld In ActivePresentation.Slides
        sld.FollowMasterBackground = False
        sld.Background.Fill.ForeColor.RGB = RGB(100, 149, 237) 'Blu cielo
    Next sld
End Sub
Ecco come fare:
- Premi Alt + F11 per aprire l'editor VBA in PowerPoint.
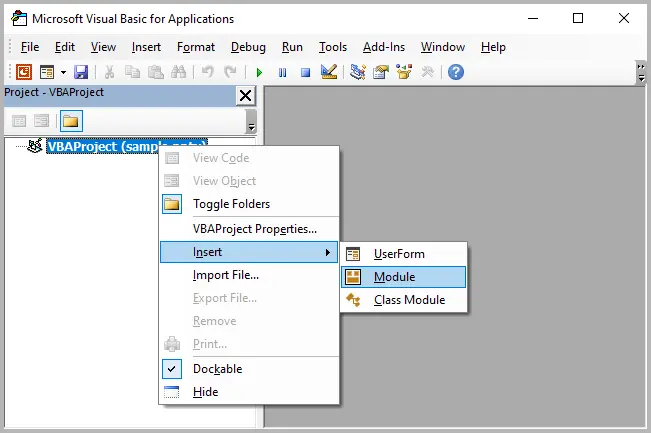
- Fai clic con il pulsante destro del mouse sul nome del progetto e seleziona Inserisci → Modulo .
- Copia e incolla il codice VBA fornito nel modulo.
- Premi F5 per eseguire la macro, che cambierà lo sfondo di tutte le diapositive.
Quando usarlo:
VBA è la soluzione migliore per gli utenti che già lavorano all'interno di PowerPoint e necessitano di un'automazione rapida e ripetibile — ad esempio, per aggiornamenti di modelli aziendali o attività di formattazione di massa.
Metodo 5. Cambiare lo Sfondo Programmaticamente con Python
Per sviluppatori o analisti che desiderano generare presentazioni in modo dinamico, Spire.Presentation for Python offre un modo potente per manipolare i file di PowerPoint, incluso il cambiamento degli sfondi delle diapositive, senza aprire PowerPoint.
Installazione:
pip install spire.presentation
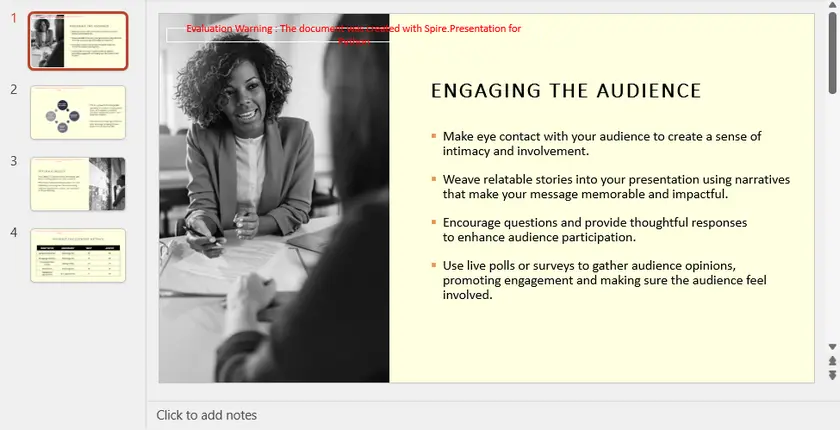
Ecco un esempio di come applicare un colore di sfondo a tinta unita a tutte le diapositive, utilizzando Spire.Presentation for Python:
from spire.presentation import *

# Crea un oggetto Presentation
presentation = Presentation()
# Carica il file PowerPoint
presentation.LoadFromFile("Input.pptx")

# Scansiona tutte le diapositive
for slide in presentation.Slides:
    # Accedi e personalizza lo sfondo
    background = slide.SlideBackground
    background.Type = BackgroundType.Custom
    background.Fill.FillType = FillFormatType.Solid
    background.Fill.SolidColor.Color = Color.get_LightYellow()

# Salva la presentazione modificata
presentation.SaveToFile("AllSlidesBackground.pptx", FileFormat.Pptx2013)
presentation.Dispose()
Passaggi principali spiegati:
- Carica un file PowerPoint esistente.
- Scorre tutte le diapositive.
- Imposta un colore a tinta unita personalizzato come sfondo.
- Salva la presentazione modificata.
Leggi anche: Impostare il Colore o l'Immagine di Sfondo per le Diapositive di PowerPoint in Python
Output:
Perché usare Spire.Presentation:
- Funziona su più piattaforme (Windows, macOS, Linux).
- Consente l'automazione di massa (applica sfondi a centinaia di diapositive).
- Può integrarsi con origini dati (Excel, XML, database) per la creazione dinamica di diapositive.
Tabella di Confronto: Quale Metodo Scegliere?
| Metodo | Livello di Abilità | Ideale Per | Ambito | Flessibilità |
|---|---|---|---|---|
| Formato Sfondo | Principiante | Modifiche rapide per diapositiva | Singola o tutte le diapositive | Moderata – offre molteplici opzioni di riempimento |
| Immagine di Sfondo Personalizzata | Principiante–Intermedio | Design creativi e layout unici | Per diapositiva | Alta – consente ritaglio, stratificazione ed effetti |
| Schema Diapositiva | Intermedio | Design coerente per intere presentazioni o modelli | Tutte le diapositive (attuali e future) | Alta – controlla layout e tema insieme |
| Macro VBA | Intermedio–Avanzato | Aggiornamenti di massa all'interno di PowerPoint | Tutte le diapositive o più presentazioni | Media – limitata dall'ambiente VBA di PowerPoint |
| Python (Spire.Presentation) | Avanzato | Automazione, generazione batch o integrazione con pipeline di dati | Più diapositive o file | Molto alta – controllo programmatico completo |
Riepilogo
Cambiare lo sfondo di una diapositiva di PowerPoint può essere semplice o altamente automatizzato, a seconda delle tue esigenze. Per gli utenti di tutti i giorni , Formato Sfondo di PowerPoint, le immagini personalizzate e lo Schema Diapositiva offrono opzioni flessibili sia per singole diapositive che per intere presentazioni. Per utenti avanzati o sviluppatori , l'automazione tramite VBA o Python (Spire.Presentation) rende facile applicare sfondi programmaticamente, risparmiando tempo e garantendo coerenza su presentazioni grandi o multiple.
Comprendendo questi metodi, puoi scegliere l'approccio giusto per il tuo flusso di lavoro — che si tratti di una rapida modifica manuale per una diapositiva, un modello aziendale brandizzato o aggiornamenti di sfondo completamente automatizzati per centinaia di diapositive.
Domande Frequenti sul Cambiamento dello Sfondo delle Diapositive
D1. Come posso ripristinare lo sfondo di una diapositiva?
Usa Formato Sfondo → Ripristina Sfondo per riportare la diapositiva allo stile predefinito del tema.
D2. Posso applicare sfondi diversi a diapositive diverse?
Sì, manualmente tramite Formato Sfondo o creando più layout nello Schema Diapositiva.
D3. Quale risoluzione dell'immagine è la migliore per gli sfondi delle diapositive?
Usa almeno 1920×1080 pixel per diapositive Full HD. Una risoluzione più alta è consigliata per schermi o proiettori di grandi dimensioni.
D4. Posso usare Python per applicare sfondi a sfumatura o a immagine?
Sì, Spire.Presentation for Python supporta colori a tinta unita, sfumature e riempimenti a immagine in modo programmatico.
D5. VBA è più sicuro di Python per l'automazione?
VBA viene eseguito all'interno di PowerPoint ed è più facile per i non sviluppatori, ma funziona solo su Windows. Python è multipiattaforma e più flessibile per l'automazione su larga scala.
Vedi Anche
Como alterar os planos de fundo dos slides do PowerPoint — 5 métodos
Índice
- Método 1. Alterar Plano de Fundo Usando "Formatar Plano de Fundo"
- Método 2. Usar uma Imagem de Plano de Fundo Personalizada
- Método 3. Aplicar Plano de Fundo a Todos os Slides via Slide Mestre
- Método 4. Alterar Plano de Fundo com Macro VBA
- Método 5. Alterar Plano de Fundo Programaticamente com Python
- Tabela de Comparação: Qual Método Você Deve Escolher?
- Resumo
- Perguntas Frequentes Sobre a Alteração do Plano de Fundo dos Slides
O PowerPoint é amplamente utilizado para apresentar ideias, relatórios e conteúdo de marketing. O plano de fundo de um slide faz mais do que decorar — ele define o tom, melhora a legibilidade e reforça a identidade visual. Escolher o plano de fundo certo pode tornar qualquer apresentação mais profissional e visualmente atraente.
Os planos de fundo dos slides podem ser personalizados manualmente usando ferramentas integradas, como cores sólidas, gradientes, padrões ou imagens. Para usuários avançados, a automação com VBA ou Python (Spire.Presentation) ajuda a economizar tempo em vários slides ou apresentações. Este artigo aborda cinco métodos práticos para alterar os planos de fundo dos slides, desde edições manuais até soluções programáticas.
Visão Geral dos Métodos
- Método 1. Alterar Plano de Fundo Usando "Formatar Plano de Fundo"
- Método 2. Usar uma Imagem de Plano de Fundo Personalizada
- Método 3. Aplicar Plano de Fundo a Todos os Slides via Slide Mestre
- Método 4. Alterar Plano de Fundo com Macro VBA
- Método 5. Alterar Plano de Fundo Programaticamente com Python
Método 1. Alterar Plano de Fundo Usando "Formatar Plano de Fundo"
Uma das maneiras mais fáceis de alterar o plano de fundo de um slide é através do recurso Formatar Plano de Fundo do PowerPoint. Ele oferece várias opções de preenchimento — Sólido, Gradiente, Imagem ou Textura e Padrão — todas acessíveis a partir de um único painel.
Como fazer:
- Abra sua apresentação do PowerPoint.
- Selecione o slide que deseja modificar.
- Vá para a guia Design na faixa de opções.
- Clique em Formatar Plano de Fundo na extrema direita.
- Escolha o seu tipo de preenchimento preferido:
- Preenchimento Sólido: Escolha uma única cor para um visual limpo e profissional.
- Preenchimento de Gradiente: Misture duas ou mais cores suavemente para um efeito dinâmico.
- Preenchimento com Imagem ou Textura: Aplique uma imagem ou uma das texturas incorporadas do PowerPoint.
- Preenchimento com Padrão: Use designs repetitivos como listras ou pontos para planos de fundo sutis.
- Clique em Aplicar a Todos para usar o mesmo plano de fundo em todos os slides, ou deixe desmarcado para aplicar apenas ao slide atual.
Dicas:
- Escolha cores que contrastem bem com seu texto e elementos visuais. Para legibilidade, use fundos claros com texto escuro ou vice-versa.
- Use o Pincel de Formatação para copiar rapidamente um estilo de plano de fundo de um slide para outro.
Quando usar:
Este método é ideal para a maioria dos usuários que desejam um plano de fundo consistente e profissional sem esforço. É rápido, intuitivo e se integra perfeitamente com os temas incorporados do PowerPoint.
Método 2. Usar uma Imagem de Plano de Fundo Personalizada
Embora a opção Formatar Plano de Fundo suporte preenchimentos com imagem, inserir uma imagem manualmente oferece controle criativo extra. Use esta abordagem quando precisar posicionar, cortar, sobrepor ou cobrir parcialmente o slide com elementos visuais — por exemplo, colocando uma imagem de destaque, deslocando uma foto para trás do texto ou compondo várias imagens e formas.
Guia rápido:
- Vá para Inserir → Imagens → Este Dispositivo (ou fonte online).
- Escolha e insira sua imagem.
- Redimensione ou corte para ajustar ao seu design.
- Clique com o botão direito na imagem → Enviar para Trás para que o texto e os objetos apareçam por cima.
- Ajuste a transparência, se necessário, para evitar que o plano de fundo sobrecarregue o conteúdo do slide.
Dicas:
- Use este método para slides de destaque, como páginas de rosto ou transições, onde você deseja uma imagem distinta e separada do resto do baralho.
- Mantenha os tamanhos dos arquivos pequenos — comprima imagens grandes para evitar o carregamento lento da apresentação.
Quando usar:
Escolha esta abordagem quando precisar de posicionamento preciso, uma composição única ou efeitos visuais em camadas além do que o Formatar Plano de Fundo oferece.
Método 3. Aplicar Plano de Fundo a Todos os Slides via Slide Mestre
Se você deseja aplicar um plano de fundo de forma consistente em todos os slides — incluindo os futuros que você adicionará — o Slide Mestre é a melhor solução. Este método garante que sua apresentação mantenha uma identidade visual uniforme e economiza tempo ao editar grandes conjuntos de slides.
Passo a passo:
- Vá para Exibir → Slide Mestre.
- Selecione o slide mestre superior no painel esquerdo.
- Clique em Estilos de Plano de Fundo → Formatar Plano de Fundo e escolha o plano de fundo desejado (cor, gradiente, imagem ou padrão).
- Feche a visualização do Slide Mestre para retornar ao editor de slides normal.
Dicas:
- Crie vários layouts de Slide Mestre, cada um com um plano de fundo diferente, para separar visualmente as seções da apresentação.
- Bloqueie elementos-chave (logotipos, formas de plano de fundo) no mestre para evitar edições acidentais.
Quando usar:
Use o Slide Mestre ao criar modelos, apresentações corporativas ou materiais educacionais que exigem um plano de fundo consistente em todos os slides e layouts.
Método 4. Alterar Plano de Fundo com Macro VBA
Para usuários avançados familiarizados com scripts, o VBA (Visual Basic for Applications) oferece uma maneira de automatizar as alterações de plano de fundo diretamente no PowerPoint. É útil quando você precisa atualizar vários slides ou apresentações rapidamente com as mesmas configurações.
Exemplo de script VBA:
Sub SetSlideBackgroundColor()
    Dim sld As Slide
    For Each sld In ActivePresentation.Slides
        sld.FollowMasterBackground = False
        sld.Background.Fill.ForeColor.RGB = RGB(100, 149, 237) 'Sky blue
    Next sld
End Sub
Veja como fazer:
- Pressione Alt + F11 para abrir o editor VBA no PowerPoint.
- Clique com o botão direito no nome do projeto e selecione Inserir → Módulo.
- Copie e cole o código VBA fornecido no módulo.
- Pressione F5 para executar a macro, que alterará o plano de fundo de todos os slides.
Quando usar:
O VBA é ideal para usuários que já trabalham no PowerPoint e precisam de automação rápida e repetível — por exemplo, atualizações de modelos corporativos ou tarefas de formatação em massa.
Método 5. Alterar Plano de Fundo Programaticamente com Python
Para desenvolvedores ou analistas que desejam gerar apresentações dinamicamente, o Spire.Presentation for Python oferece uma maneira poderosa de manipular arquivos do PowerPoint, incluindo a alteração de planos de fundo de slides, sem abrir o PowerPoint.
Instalação:
pip install spire.presentation
Aqui está um exemplo de como aplicar uma cor de fundo sólida a todos os slides, usando o Spire.Presentation for Python:
from spire.presentation import *

# Create a Presentation object
presentation = Presentation()
# Load the PowerPoint file
presentation.LoadFromFile("Input.pptx")

# Loop through all slides
for slide in presentation.Slides:
    # Access and customize background
    background = slide.SlideBackground
    background.Type = BackgroundType.Custom
    background.Fill.FillType = FillFormatType.Solid
    background.Fill.SolidColor.Color = Color.get_LightYellow()

# Save the modified presentation
presentation.SaveToFile("AllSlidesBackground.pptx", FileFormat.Pptx2013)
presentation.Dispose()
Passos principais explicados:
- Carrega um arquivo PowerPoint existente.
- Itera através de todos os slides.
- Define uma cor sólida personalizada como plano de fundo.
- Salva a apresentação modificada.
Leia Mais: Definir Cor ou Imagem de Fundo para Slides do PowerPoint em Python
Saída:
Por que usar o Spire.Presentation:
- Funciona em várias plataformas (Windows, macOS, Linux).
- Permite automação em massa (aplicar planos de fundo a centenas de slides).
- Pode se integrar com fontes de dados (Excel, XML, bancos de dados) para criação dinâmica de slides.
Tabela de Comparação: Qual Método Você Deve Escolher?
| Método | Nível de Habilidade | Ideal Para | Escopo | Flexibilidade |
|---|---|---|---|---|
| Formatar Plano de Fundo | Iniciante | Edições rápidas por slide | Slide único ou todos os slides | Moderada – oferece múltiplas opções de preenchimento |
| Imagem de Fundo Personalizada | Iniciante–Intermediário | Designs criativos e layouts únicos | Por slide | Alta – permite cortar, sobrepor e aplicar efeitos |
| Slide Mestre | Intermediário | Design consistente para conjuntos de slides ou modelos inteiros | Todos os slides (atuais e futuros) | Alta – controla layout e tema em conjunto |
| Macro VBA | Intermediário–Avançado | Atualizações em massa no PowerPoint | Todos os slides ou múltiplas apresentações | Média – limitada pelo ambiente VBA do PowerPoint |
| Python (Spire.Presentation) | Avançado | Automação, geração em lote ou integração com pipelines de dados | Múltiplos slides ou arquivos | Muito Alta – controle programático total |
Resumo
Alterar o plano de fundo de um slide do PowerPoint pode ser simples ou altamente automatizado, dependendo de suas necessidades. Para usuários comuns, as opções Formatar Plano de Fundo, imagens personalizadas e Slide Mestre do PowerPoint oferecem opções flexíveis tanto para slides individuais quanto para apresentações inteiras. Para usuários avançados ou desenvolvedores, a automação via VBA ou Python (Spire.Presentation) facilita a aplicação de planos de fundo programaticamente, economizando tempo e garantindo consistência em apresentações grandes ou múltiplas.
Ao entender esses métodos, você pode escolher a abordagem certa para o seu fluxo de trabalho — seja um ajuste manual rápido para um slide, um modelo corporativo com marca ou atualizações de plano de fundo totalmente automatizadas para centenas de slides.
Perguntas Frequentes Sobre a Alteração do Plano de Fundo dos Slides
P1. Como posso redefinir o plano de fundo de um slide?
Use Formatar Plano de Fundo → Redefinir Plano de Fundo para reverter o slide para o estilo padrão do tema.
P2. Posso aplicar planos de fundo diferentes a slides diferentes?
Sim, manualmente através de Formatar Plano de Fundo ou criando vários layouts no Slide Mestre.
P3. Qual resolução de imagem é melhor para planos de fundo de slides?
Use pelo menos 1920×1080 pixels para slides em Full HD. Uma resolução mais alta é recomendada para telas grandes ou projetores.
P4. Posso usar Python para aplicar planos de fundo de gradiente ou imagem?
Sim, o Spire.Presentation for Python suporta cores sólidas, gradientes e preenchimentos com imagem programaticamente.
P5. O VBA é mais seguro que o Python para automação?
O VBA é executado dentro do PowerPoint e é mais fácil para não desenvolvedores, mas funciona apenas no Windows. O Python é multiplataforma e mais flexível para automação em larga escala.
Veja Também
PowerPoint 슬라이드 배경 변경 방법 — 5가지
PowerPoint는 아이디어, 보고서 및 마케팅 콘텐츠를 전달하는 데 널리 사용됩니다. 슬라이드의 배경은 장식 이상의 역할을 합니다. 분위기를 조성하고 가독성을 높이며 브랜딩을 강화합니다. 올바른 배경을 선택하면 모든 프레젠테이션을 더욱 전문적이고 시각적으로 매력적으로 만들 수 있습니다.
슬라이드 배경은 단색, 그라데이션, 패턴 또는 이미지와 같은 내장 도구를 사용하여 수동으로 사용자 지정할 수 있습니다. 고급 사용자의 경우 VBA 또는 Python(Spire.Presentation)을 사용한 자동화를 통해 여러 슬라이드 또는 프레젠테이션에서 시간을 절약할 수 있습니다. 이 문서에서는 수동 편집에서 프로그래밍 방식 솔루션에 이르기까지 슬라이드 배경을 변경하는 다섯 가지 실용적인 방법을 다룹니다.
방법 개요
- 방법 1. "배경 서식"을 사용하여 배경 변경
- 방법 2. 사용자 지정 배경 이미지 사용
- 방법 3. 슬라이드 마스터를 통해 모든 슬라이드에 배경 적용
- 방법 4. VBA 매크로로 배경 변경
- 방법 5. Python을 사용하여 프로그래밍 방식으로 배경 변경
방법 1. "배경 서식"을 사용하여 배경 변경
슬라이드 배경을 변경하는 가장 쉬운 방법 중 하나는 PowerPoint의 배경 서식 기능을 사용하는 것입니다. 단색, 그라데이션, 그림 또는 질감, 패턴 등 여러 채우기 옵션을 단일 창에서 모두 액세스할 수 있습니다.
수행 방법:
- PowerPoint 프레젠테이션을 엽니다.
- 수정할 슬라이드를 선택합니다.
- 리본의 디자인 탭으로 이동합니다.
- 오른쪽 끝에 있는 배경 서식을 클릭합니다.
- 원하는 채우기 유형을 선택합니다.
- 단색 채우기: 깨끗하고 전문적인 모양을 위해 단일 색상을 선택합니다.
- 그라데이션 채우기: 두 가지 이상의 색상을 부드럽게 혼합하여 역동적인 효과를 줍니다.
- 그림 또는 질감 채우기: 이미지 또는 PowerPoint의 내장 질감 중 하나를 적용합니다.
- 패턴 채우기: 미묘한 배경을 위해 줄무늬나 점과 같은 반복적인 디자인을 사용합니다.
- 모든 슬라이드에 동일한 배경을 사용하려면 모두 적용을 클릭하고, 현재 슬라이드에만 적용하려면 선택하지 않은 상태로 둡니다.
팁:
- 텍스트 및 시각 자료와 잘 대비되는 색상을 선택합니다. 가독성을 위해 밝은 배경에 어두운 텍스트를 사용하거나 그 반대로 사용합니다.
- 서식 복사를 사용하여 한 슬라이드에서 다른 슬라이드로 배경 스타일을 빠르게 복사합니다.
사용 시기:
이 방법은 별다른 노력 없이 일관되고 전문적인 배경을 원하는 대부분의 사용자에게 이상적입니다. 빠르고 직관적이며 PowerPoint의 내장 테마와 원활하게 통합됩니다.
방법 2. 사용자 지정 배경 이미지 사용
배경 서식은 그림 채우기를 지원하지만 이미지를 수동으로 삽입하면 추가적인 창의적 제어가 가능합니다. 예를 들어 히어로 이미지를 배치하거나 텍스트 뒤에 사진을 오프셋하거나 여러 이미지와 모양을 구성하는 등 슬라이드를 시각적으로 배치, 자르기, 레이어링 또는 부분적으로 덮어야 할 때 이 방법을 사용합니다.
빠른 가이드:
- 삽입 → 그림 → 이 장치(또는 온라인 소스)로 이동합니다.
- 이미지를 선택하고 삽입합니다.
- 디자인에 맞게 크기를 조정하거나 자릅니다.
- 이미지를 마우스 오른쪽 버튼으로 클릭 → 맨 뒤로 보내기를 선택하여 텍스트와 개체가 맨 위에 나타나도록 합니다.
- 배경이 슬라이드 콘텐츠를 압도하지 않도록 필요한 경우 투명도를 조정합니다.
팁:
- 표지나 전환과 같이 나머지 덱과 구별되는 독특한 이미지를 원하는 눈에 띄는 슬라이드에 이 방법을 사용합니다.
- 파일 크기를 작게 유지 — 큰 이미지를 압축하여 프레젠테이션 로딩 속도가 느려지는 것을 방지합니다.
사용 시기:
배경 서식이 제공하는 것 이상의 정밀한 배치, 독특한 구성 또는 계층화된 시각 효과가 필요할 때 이 방법을 선택합니다.
방법 3. 슬라이드 마스터를 통해 모든 슬라이드에 배경 적용
추가할 미래의 슬라이드를 포함하여 모든 슬라이드에 배경을 일관되게 적용하려면 슬라이드 마스터가 최상의 솔루션입니다. 이 방법을 사용하면 프레젠테이션이 균일한 브랜딩을 유지하고 큰 덱을 편집할 때 시간을 절약할 수 있습니다.
단계별:
- 보기 → 슬라이드 마스터로 이동합니다.
- 왼쪽 패널에서 맨 위 마스터 슬라이드를 선택합니다.
- 배경 스타일 → 배경 서식을 클릭하고 원하는 배경(색상, 그라데이션, 그림 또는 패턴)을 선택합니다.
- 슬라이드 마스터 보기를 닫고 일반 슬라이드 편집기로 돌아갑니다.
팁:
- 각각 다른 배경을 가진 여러 슬라이드 마스터 레이아웃을 만들어 프레젠테이션 섹션을 시각적으로 구분합니다.
- 마스터에서 주요 요소(로고, 배경 모양)를 잠가 우발적인 편집을 방지합니다.
사용 시기:
모든 슬라이드와 레이아웃에 일관된 배경이 필요한 템플릿, 기업 프레젠테이션 또는 교육용 덱을 만들 때 슬라이드 마스터를 사용합니다.
방법 4. VBA 매크로로 배경 변경
스크립팅에 익숙한 고급 사용자를 위해 VBA(Visual Basic for Applications)는 PowerPoint 내에서 직접 배경 변경을 자동화하는 방법을 제공합니다. 여러 슬라이드나 프레젠테이션을 동일한 설정으로 빠르게 업데이트해야 할 때 유용합니다.
예제 VBA 스크립트:
Sub SetSlideBackgroundColor()
    Dim sld As Slide
    For Each sld In ActivePresentation.Slides
        sld.FollowMasterBackground = False
        sld.Background.Fill.ForeColor.RGB = RGB(100, 149, 237) '하늘색
    Next sld
End Sub
수행 방법:
- PowerPoint에서 Alt + F11을 눌러 VBA 편집기를 엽니다.
- 프로젝트 이름을 마우스 오른쪽 버튼으로 클릭하고 삽입 → 모듈을 선택합니다.
- 제공된 VBA 코드를 복사하여 모듈에 붙여넣습니다.
- F5를 눌러 매크로를 실행하면 모든 슬라이드의 배경이 변경됩니다.
사용 시기:
VBA는 이미 PowerPoint 내에서 작업하고 빠른 반복 자동화가 필요한 사용자(예: 기업 템플릿 업데이트 또는 대량 서식 지정 작업)에게 가장 적합합니다.
방법 5. Python을 사용하여 프로그래밍 방식으로 배경 변경
동적으로 프레젠테이션을 생성하려는 개발자나 분석가를 위해 Spire.Presentation for Python은 PowerPoint를 열지 않고도 슬라이드 배경 변경을 포함하여 PowerPoint 파일을 조작하는 강력한 방법을 제공합니다.
설치:
pip install spire.presentation
다음은 Spire.Presentation for Python을 사용하여 모든 슬라이드에 단색 배경색을 적용하는 예입니다.
from spire.presentation import *

# Presentation 객체 생성
presentation = Presentation()
# PowerPoint 파일 로드
presentation.LoadFromFile("Input.pptx")

# 모든 슬라이드를 반복
for slide in presentation.Slides:
    # 배경에 액세스하고 사용자 지정
    background = slide.SlideBackground
    background.Type = BackgroundType.Custom
    background.Fill.FillType = FillFormatType.Solid
    background.Fill.SolidColor.Color = Color.get_LightYellow()

# 수정된 프레젠테이션 저장
presentation.SaveToFile("AllSlidesBackground.pptx", FileFormat.Pptx2013)
presentation.Dispose()
핵심 단계 설명:
- 기존 PowerPoint 파일을 로드합니다.
- 모든 슬라이드를 반복합니다.
- 사용자 지정 단색을 배경으로 설정합니다.
- 수정된 프레젠테이션을 저장합니다.
추가 정보: Python에서 PowerPoint 슬라이드의 배경색 또는 그림 설정
출력:
Spire.Presentation을 사용하는 이유:
- 플랫폼 간(Windows, macOS, Linux) 작동합니다.
- 대량 자동화(수백 개의 슬라이드에 배경 적용)를 허용합니다.
- 동적 슬라이드 생성을 위해 데이터 소스(Excel, XML, 데이터베이스)와 통합할 수 있습니다.
비교표: 어떤 방법을 선택해야 할까요?
| 방법 | 기술 수준 | 최적 대상 | 범위 | 유연성 |
|---|---|---|---|---|
| 배경 서식 | 초급 | 빠른, 슬라이드별 편집 | 단일 또는 모든 슬라이드 | 보통 – 여러 채우기 옵션 제공 |
| 사용자 지정 배경 이미지 | 초급–중급 | 창의적인 디자인 및 독특한 레이아웃 | 슬라이드별 | 높음 – 자르기, 레이어링 및 효과 허용 |
| 슬라이드 마스터 | 중급 | 전체 덱 또는 템플릿에 대한 일관된 디자인 | 모든 슬라이드(현재 및 미래) | 높음 – 레이아웃과 테마를 함께 제어 |
| VBA 매크로 | 중급–고급 | PowerPoint 내 대량 업데이트 | 모든 슬라이드 또는 여러 프레젠테이션 | 중간 – PowerPoint의 VBA 환경에 의해 제한됨 |
| Python (Spire.Presentation) | 고급 | 자동화, 일괄 생성 또는 데이터 파이프라인과의 통합 | 여러 슬라이드 또는 파일 | 매우 높음 – 완전한 프로그래밍 방식 제어 |
요약
PowerPoint 슬라이드의 배경을 변경하는 것은 필요에 따라 간단하거나 고도로 자동화될 수 있습니다. 일반 사용자의 경우 PowerPoint의 배경 서식, 사용자 지정 이미지 및 슬라이드 마스터는 단일 슬라이드와 전체 프레젠테이션 모두에 유연한 옵션을 제공합니다. 고급 사용자 또는 개발자의 경우 VBA 또는 Python(Spire.Presentation)을 통한 자동화를 통해 프로그래밍 방식으로 배경을 쉽게 적용하여 시간을 절약하고 대규모 또는 여러 프레젠테이션에서 일관성을 보장할 수 있습니다.
이러한 방법을 이해하면 한 슬라이드에 대한 빠른 수동 조정, 브랜드화된 기업 템플릿 또는 수백 개의 슬라이드에 대한 완전 자동화된 배경 업데이트 등 워크플로에 적합한 접근 방식을 선택할 수 있습니다.
슬라이드 배경 변경에 대한 FAQ
Q1. 슬라이드의 배경을 어떻게 재설정할 수 있나요?
배경 서식 → 배경 재설정을 사용하여 슬라이드를 테마의 기본 스타일로 되돌립니다.
Q2. 다른 슬라이드에 다른 배경을 적용할 수 있나요?
예, 배경 서식을 통해 수동으로 또는 슬라이드 마스터에서 여러 레이아웃을 만들어 적용할 수 있습니다.
Q3. 슬라이드 배경에 가장 적합한 이미지 해상도는 무엇인가요?
풀 HD 슬라이드의 경우 최소 1920×1080 픽셀을 사용합니다. 대형 화면이나 프로젝터에는 더 높은 해상도를 권장합니다.
Q4. Python을 사용하여 그라데이션 또는 그림 배경을 적용할 수 있나요?
예, Spire.Presentation for Python은 프로그래밍 방식으로 단색, 그라데이션 및 그림 채우기를 지원합니다.
Q5. 자동화에 Python보다 VBA가 더 안전한가요?
VBA는 PowerPoint 내에서 실행되며 비개발자에게는 더 쉽지만 Windows에서만 작동합니다. Python은 플랫폼 간 호환이 가능하며 대규모 자동화에 더 유연합니다.
참고 항목
Comment modifier les arrière-plans des diapositives PowerPoint — 5 méthodes
Table des matières
- Méthode 1. Changer l'arrière-plan en utilisant "Format de l'arrière-plan"
- Méthode 2. Utiliser une image d'arrière-plan personnalisée
- Méthode 3. Appliquer l'arrière-plan à toutes les diapositives via le Masque des diapositives
- Méthode 4. Changer l'arrière-plan avec une macro VBA
- Méthode 5. Changer l'arrière-plan par programmation avec Python
- Tableau comparatif : Quelle méthode choisir ?
- Résumé
- FAQ sur le changement d'arrière-plan des diapositives
PowerPoint est largement utilisé pour présenter des idées, des rapports et du contenu marketing. L'arrière-plan d'une diapositive ne fait pas que décorer : il donne le ton, améliore la lisibilité et renforce l'image de marque. Choisir le bon arrière-plan peut rendre toute présentation plus professionnelle et visuellement attrayante.
Les arrière-plans des diapositives peuvent être personnalisés manuellement à l'aide d'outils intégrés tels que des couleurs unies, des dégradés, des motifs ou des images. Pour les utilisateurs avancés, l'automatisation avec VBA ou Python (Spire.Presentation) permet de gagner du temps sur plusieurs diapositives ou présentations. Cet article présente cinq méthodes pratiques pour changer les arrière-plans des diapositives, des modifications manuelles aux solutions programmatiques.
Aperçu des méthodes
- Méthode 1. Changer l'arrière-plan en utilisant "Format de l'arrière-plan"
- Méthode 2. Utiliser une image d'arrière-plan personnalisée
- Méthode 3. Appliquer l'arrière-plan à toutes les diapositives via le Masque des diapositives
- Méthode 4. Changer l'arrière-plan avec une macro VBA
- Méthode 5. Changer l'arrière-plan par programmation avec Python
Méthode 1. Changer l'arrière-plan en utilisant "Format de l'arrière-plan"
L'une des façons les plus simples de changer l'arrière-plan d'une diapositive est d'utiliser la fonctionnalité Format de l'arrière-plan de PowerPoint. Elle offre plusieurs options de remplissage — Uni, Dégradé, Image ou texture, et Motif — toutes accessibles depuis un seul volet.
Comment faire :
- Ouvrez votre présentation PowerPoint.
- Sélectionnez la diapositive que vous souhaitez modifier.
- Allez dans l'onglet Création du ruban.
- Cliquez sur Format de l'arrière-plan à l'extrême droite.
- Choisissez votre type de remplissage préféré :
- Remplissage uni : Choisissez une seule couleur pour un aspect net et professionnel.
- Remplissage dégradé : Mélangez deux ou plusieurs couleurs en douceur pour un effet dynamique.
- Remplissage avec image ou texture : Appliquez une image ou l'une des textures intégrées de PowerPoint.
- Remplissage avec motif : Utilisez des motifs répétitifs comme des rayures ou des points pour des arrière-plans subtils.
- Cliquez sur Appliquer partout pour utiliser le même arrière-plan sur chaque diapositive, ou laissez la case décochée pour l'appliquer uniquement à la diapositive actuelle.
Conseils :
- Choisissez des couleurs qui contrastent bien avec votre texte et vos visuels. Pour la lisibilité, utilisez des arrière-plans clairs avec du texte sombre ou vice versa.
- Utilisez le Pinceau de reproduction pour copier rapidement un style d'arrière-plan d'une diapositive à une autre.
Quand l'utiliser :
Cette méthode est idéale pour la plupart des utilisateurs qui souhaitent un arrière-plan cohérent et professionnel sans effort. Elle est rapide, intuitive et s'intègre parfaitement aux thèmes intégrés de PowerPoint.
Méthode 2. Utiliser une image d'arrière-plan personnalisée
Bien que le Format de l'arrière-plan prenne en charge les remplissages d'images, l'insertion manuelle d'une image vous donne un contrôle créatif supplémentaire. Utilisez cette approche lorsque vous avez besoin de positionner, recadrer, superposer ou couvrir partiellement la diapositive avec des visuels — par exemple, en plaçant une image principale, en décalant une photo derrière le texte ou en composant plusieurs images et formes.
Guide rapide :
- Allez dans Insertion → Images → Cet appareil (ou source en ligne).
- Choisissez et insérez votre image.
- Redimensionnez-la ou recadrez-la pour l'adapter à votre conception.
- Faites un clic droit sur l'image → Mettre à l'arrière-plan pour que le texte et les objets apparaissent par-dessus.
- Ajustez la transparence si nécessaire pour éviter que l'arrière-plan ne submerge le contenu de la diapositive.
Conseils :
- Utilisez cette méthode pour les diapositives qui se démarquent, comme les pages de garde ou les transitions, où vous souhaitez une image distincte du reste de la présentation.
- Gardez la taille des fichiers petite — compressez les grandes images pour éviter un chargement lent de la présentation.
Quand l'utiliser :
Choisissez cette approche lorsque vous avez besoin d'un placement précis, d'une composition unique ou d'effets visuels superposés au-delà de ce que propose le Format de l'arrière-plan.
Méthode 3. Appliquer l'arrière-plan à toutes les diapositives via le Masque des diapositives
Si vous souhaitez appliquer un arrière-plan de manière cohérente sur chaque diapositive — y compris celles que vous ajouterez à l'avenir — le Masque des diapositives est la meilleure solution. Cette méthode garantit que votre présentation conserve une image de marque uniforme et vous fait gagner du temps lors de la modification de grandes présentations.
Étape par étape :
- Allez dans Affichage → Masque des diapositives .
- Sélectionnez le masque de diapositive principal dans le volet de gauche.
- Cliquez sur Styles d'arrière-plan → Format de l'arrière-plan et choisissez l'arrière-plan souhaité (couleur, dégradé, image ou motif).
- Fermez la vue Masque des diapositives pour revenir à l'éditeur de diapositives normal.
Conseils :
- Créez plusieurs mises en page de Masque des diapositives, chacune avec un arrière-plan différent, pour séparer visuellement les sections de la présentation.
- Verrouillez les éléments clés (logos, formes d'arrière-plan) dans le masque pour éviter les modifications accidentelles.
Quand l'utiliser :
Utilisez le Masque des diapositives lors de la création de modèles, de présentations d'entreprise ou de supports pédagogiques qui nécessitent un arrière-plan cohérent sur toutes les diapositives et mises en page.
Méthode 4. Changer l'arrière-plan avec une macro VBA
Pour les utilisateurs expérimentés à l'aise avec les scripts, VBA (Visual Basic pour Applications) offre un moyen d'automatiser les changements d'arrière-plan directement dans PowerPoint. C'est utile lorsque vous devez mettre à jour rapidement plusieurs diapositives ou présentations avec les mêmes paramètres.
Exemple de script VBA :
Sub SetSlideBackgroundColor()
    Dim sld As Slide
    For Each sld In ActivePresentation.Slides
        sld.FollowMasterBackground = False
        sld.Background.Fill.ForeColor.RGB = RGB(100, 149, 237) 'Bleu ciel
    Next sld
End Sub
Voici comment faire :
- Appuyez sur Alt + F11 pour ouvrir l'éditeur VBA dans PowerPoint.
- Faites un clic droit sur le nom du projet et sélectionnez Insertion → Module .
- Copiez et collez le code VBA fourni dans le module.
- Appuyez sur F5 pour exécuter la macro, ce qui changera l'arrière-plan de toutes les diapositives.
Quand l'utiliser :
VBA est idéal pour les utilisateurs qui travaillent déjà dans PowerPoint et ont besoin d'une automatisation rapide et reproductible — par exemple, pour les mises à jour de modèles d'entreprise ou les tâches de formatage en masse.
Méthode 5. Changer l'arrière-plan par programmation avec Python
Pour les développeurs ou les analystes qui souhaitent générer des présentations de manière dynamique, Spire.Presentation for Python offre un moyen puissant de manipuler les fichiers PowerPoint, y compris de changer les arrière-plans des diapositives, sans ouvrir PowerPoint.
Installation :
pip install spire.presentation
Voici un exemple de la manière d'appliquer une couleur d'arrière-plan unie à toutes les diapositives, en utilisant Spire.Presentation for Python :
from spire.presentation import *

# Créer un objet Presentation
presentation = Presentation()
# Charger le fichier PowerPoint
presentation.LoadFromFile("Input.pptx")

# Parcourir toutes les diapositives
for slide in presentation.Slides:
    # Accéder et personnaliser l'arrière-plan
    background = slide.SlideBackground
    background.Type = BackgroundType.Custom
    background.Fill.FillType = FillFormatType.Solid
    background.Fill.SolidColor.Color = Color.get_LightYellow()

# Enregistrer la présentation modifiée
presentation.SaveToFile("AllSlidesBackground.pptx", FileFormat.Pptx2013)
presentation.Dispose()
Étapes principales expliquées :
- Charge un fichier PowerPoint existant.
- Parcourt toutes les diapositives.
- Définit une couleur unie personnalisée comme arrière-plan.
- Enregistre la présentation modifiée.
Lire la suite : Définir la couleur ou l'image d'arrière-plan pour les diapositives PowerPoint en Python
Sortie :
Pourquoi utiliser Spire.Presentation :
- Fonctionne sur plusieurs plateformes (Windows, macOS, Linux).
- Permet l'automatisation en masse (appliquer des arrière-plans à des centaines de diapositives).
- Peut s'intégrer à des sources de données (Excel, XML, bases de données) pour la création dynamique de diapositives.
Tableau comparatif : Quelle méthode choisir ?
| Méthode | Niveau de compétence | Idéal pour | Portée | Flexibilité |
|---|---|---|---|---|
| Format de l'arrière-plan | Débutant | Modifications rapides par diapositive | Une seule ou toutes les diapositives | Modérée – offre plusieurs options de remplissage |
| Image d'arrière-plan personnalisée | Débutant–Intermédiaire | Conceptions créatives et mises en page uniques | Par diapositive | Élevée – permet le recadrage, la superposition et les effets |
| Masque des diapositives | Intermédiaire | Conception cohérente pour des présentations ou des modèles entiers | Toutes les diapositives (actuelles & futures) | Élevée – contrôle la mise en page et le thème ensemble |
| Macro VBA | Intermédiaire–Avancé | Mises à jour en masse dans PowerPoint | Toutes les diapositives ou plusieurs présentations | Moyenne – limitée par l'environnement VBA de PowerPoint |
| Python (Spire.Presentation) | Avancé | Automatisation, génération par lots ou intégration avec des pipelines de données | Plusieurs diapositives ou fichiers | Très élevée – contrôle programmatique complet |
Résumé
Changer l'arrière-plan d'une diapositive PowerPoint peut être simple ou hautement automatisé, selon vos besoins. Pour les utilisateurs quotidiens , le Format de l'arrière-plan de PowerPoint, les images personnalisées et le Masque des diapositives offrent des options flexibles pour les diapositives uniques et les présentations entières. Pour les utilisateurs avancés ou les développeurs , l'automatisation via VBA ou Python (Spire.Presentation) facilite l'application d'arrière-plans par programmation, ce qui permet de gagner du temps et d'assurer la cohérence sur des présentations volumineuses ou multiples.
En comprenant ces méthodes, vous pouvez choisir la bonne approche pour votre flux de travail — qu'il s'agisse d'une modification manuelle rapide pour une diapositive, d'un modèle d'entreprise de marque ou de mises à jour d'arrière-plan entièrement automatisées pour des centaines de diapositives.
FAQ sur le changement d'arrière-plan des diapositives
Q1. Comment puis-je réinitialiser l'arrière-plan d'une diapositive ?
Utilisez Format de l'arrière-plan → Réinitialiser l'arrière-plan pour rétablir le style par défaut du thème de la diapositive.
Q2. Puis-je appliquer des arrière-plans différents à des diapositives différentes ?
Oui, soit manuellement via le Format de l'arrière-plan, soit en créant plusieurs mises en page dans le Masque des diapositives.
Q3. Quelle est la meilleure résolution d'image pour les arrière-plans de diapositives ?
Utilisez au moins 1920×1080 pixels pour les diapositives Full HD. Une résolution plus élevée est recommandée pour les grands écrans ou les projecteurs.
Q4. Puis-je utiliser Python pour appliquer des arrière-plans en dégradé ou avec des images ?
Oui, Spire.Presentation for Python prend en charge les couleurs unies, les dégradés et les remplissages d'images par programmation.
Q5. VBA est-il plus sûr que Python pour l'automatisation ?
VBA s'exécute à l'intérieur de PowerPoint et est plus facile pour les non-développeurs, mais ne fonctionne que sur Windows. Python est multiplateforme et plus flexible pour l'automatisation à grande échelle.
Voir aussi
- Supprimer les arrière-plans d'une diapositive PowerPoint ou des masques de diapositives en Python
- Comment créer des documents PowerPoint en Python
- 5 façons simples d'exporter des diapositives PPT en tant qu'images (PNG, JPG, TIFF)
- Convertir PowerPoint en HTML : Méthodes simples pour chaque utilisateur
Cómo cambiar los fondos de las diapositivas de PowerPoint — 5 métodos
Tabla de Contenidos
- Método 1. Cambiar el Fondo Usando "Formato de Fondo"
- Método 2. Usar una Imagen de Fondo Personalizada
- Método 3. Aplicar Fondo a Todas las Diapositivas a través del Patrón de Diapositivas
- Método 4. Cambiar el Fondo con una Macro de VBA
- Método 5. Cambiar el Fondo Programáticamente con Python
- Tabla Comparativa: ¿Qué Método Deberías Elegir?
- Resumen
- Preguntas Frecuentes Sobre Cómo Cambiar el Fondo de las Diapositivas
PowerPoint es ampliamente utilizado para presentar ideas, informes y contenido de marketing. El fondo de una diapositiva hace más que decorar: establece el tono, mejora la legibilidad y refuerza la marca. Elegir el fondo adecuado puede hacer que cualquier presentación sea más profesional y visualmente atractiva.
Los fondos de las diapositivas se pueden personalizar manualmente utilizando herramientas integradas como colores sólidos, degradados, patrones o imágenes. Para usuarios avanzados, la automatización con VBA o Python (Spire.Presentation) ayuda a ahorrar tiempo en múltiples diapositivas o presentaciones. Este artículo cubre cinco métodos prácticos para cambiar los fondos de las diapositivas, desde ediciones manuales hasta soluciones programáticas.
Resumen de Métodos
- Método 1. Cambiar el Fondo Usando "Formato de Fondo"
- Método 2. Usar una Imagen de Fondo Personalizada
- Método 3. Aplicar Fondo a Todas las Diapositivas a través del Patrón de Diapositivas
- Método 4. Cambiar el Fondo con una Macro de VBA
- Método 5. Cambiar el Fondo Programáticamente con Python
Método 1. Cambiar el Fondo Usando "Formato de Fondo"
Una de las formas más fáciles de cambiar el fondo de una diapositiva es a través de la función Formato de Fondo de PowerPoint. Ofrece varias opciones de relleno (Sólido, Degradado, Imagen o Textura y Trama) todas accesibles desde un único panel.
Cómo hacerlo:
- Abre tu presentación de PowerPoint.
- Selecciona la diapositiva que deseas modificar.
- Ve a la pestaña Diseño en la cinta de opciones.
- Haz clic en Formato de Fondo en el extremo derecho.
- Elige tu tipo de relleno preferido:
- Relleno sólido: Elige un solo color para un aspecto limpio y profesional.
- Relleno degradado: Mezcla dos o más colores suavemente para un efecto dinámico.
- Relleno con imagen o textura: Aplica una imagen o una de las texturas integradas de PowerPoint.
- Relleno de trama: Usa diseños repetitivos como rayas o puntos para fondos sutiles.
- Haz clic en Aplicar a todo para usar el mismo fondo en todas las diapositivas, o déjalo sin marcar para aplicarlo solo a la diapositiva actual.
Consejos:
- Elige colores que contrasten bien con tu texto y elementos visuales. Para mayor legibilidad, usa fondos claros con texto oscuro o viceversa.
- Usa Copiar formato para copiar rápidamente un estilo de fondo de una diapositiva a otra.
Cuándo usarlo:
Este método es ideal para la mayoría de los usuarios que desean un fondo consistente y profesional sin ningún esfuerzo. Es rápido, intuitivo y se integra perfectamente con los temas integrados de PowerPoint.
Método 2. Usar una Imagen de Fondo Personalizada
Aunque Formato de Fondo admite rellenos de imagen, insertar una imagen manualmente te da un control creativo adicional. Usa este enfoque cuando necesites posicionar, recortar, superponer o cubrir parcialmente la diapositiva con elementos visuales, por ejemplo, colocando una imagen principal, desplazando una foto detrás del texto o componiendo múltiples imágenes y formas.
Guía rápida:
- Ve a Insertar → Imágenes → Este dispositivo (o fuente en línea).
- Elige e inserta tu imagen.
- Redimensiona o recórtala para que se ajuste a tu diseño.
- Haz clic derecho en la imagen → Enviar al fondo para que el texto y los objetos aparezcan encima.
- Ajusta la transparencia si es necesario para evitar que el fondo abrume el contenido de la diapositiva.
Consejos:
- Usa este método para diapositivas destacadas, como portadas o transiciones, donde desees una imagen distinta al resto de la presentación.
- Mantén los tamaños de archivo pequeños: comprime las imágenes grandes para evitar que la presentación se cargue lentamente.
Cuándo usarlo:
Elige este enfoque cuando necesites una colocación precisa, una composición única o efectos visuales en capas más allá de lo que ofrece Formato de Fondo.
Método 3. Aplicar Fondo a Todas las Diapositivas a través del Patrón de Diapositivas
Si deseas aplicar un fondo de manera consistente en todas las diapositivas, incluidas las futuras que agregarás, el Patrón de diapositivas es la mejor solución. Este método garantiza que tu presentación mantenga una marca uniforme y ahorra tiempo al editar presentaciones grandes.
Paso a paso:
- Ve a Vista → Patrón de diapositivas .
- Selecciona la diapositiva maestra superior en el panel izquierdo.
- Haz clic en Estilos de fondo → Formato de fondo y elige el fondo que desees (color, degradado, imagen o trama).
- Cierra la vista Patrón de diapositivas para volver al editor de diapositivas normal.
Consejos:
- Crea múltiples diseños de Patrón de diapositivas, cada uno con un fondo diferente, para separar visualmente las secciones de la presentación.
- Bloquea los elementos clave (logotipos, formas de fondo) en el patrón para evitar ediciones accidentales.
Cuándo usarlo:
Usa el Patrón de diapositivas al crear plantillas, presentaciones corporativas o mazos educativos que requieran un fondo consistente en todas las diapositivas y diseños.
Método 4. Cambiar el Fondo con una Macro de VBA
Para los usuarios avanzados que se sienten cómodos con los scripts, VBA (Visual Basic para Aplicaciones) proporciona una forma de automatizar los cambios de fondo directamente en PowerPoint. Es útil cuando necesitas actualizar rápidamente varias diapositivas o presentaciones con la misma configuración.
Ejemplo de script de VBA:
Sub SetSlideBackgroundColor()
    Dim sld As Slide
    For Each sld In ActivePresentation.Slides
        sld.FollowMasterBackground = False
        sld.Background.Fill.ForeColor.RGB = RGB(100, 149, 237) 'Sky blue
    Next sld
End Sub
A continuación, te explicamos cómo hacerlo:
- Presiona Alt + F11 para abrir el editor de VBA en PowerPoint.
- Haz clic con el botón derecho en el nombre del proyecto y selecciona Insertar → Módulo .
- Copia y pega el código VBA proporcionado en el módulo.
- Presiona F5 para ejecutar la macro, que cambiará el fondo de todas las diapositivas.
Cuándo usarlo:
VBA es ideal para usuarios que ya trabajan en PowerPoint y necesitan una automatización rápida y repetible, por ejemplo, para actualizaciones de plantillas corporativas o tareas de formato masivo.
Método 5. Cambiar el Fondo Programáticamente con Python
Para desarrolladores o analistas que desean generar presentaciones dinámicamente, Spire.Presentation para Python proporciona una forma poderosa de manipular archivos de PowerPoint, incluido el cambio de fondos de diapositivas, sin abrir PowerPoint.
Instalación:
pip install spire.presentation
Aquí hay un ejemplo de cómo aplicar un color de fondo sólido a todas las diapositivas, usando Spire.Presentation para Python:
from spire.presentation import *

# Create a Presentation object
presentation = Presentation()
# Load the PowerPoint file
presentation.LoadFromFile("Input.pptx")

# Loop through all slides
for slide in presentation.Slides:
    # Access and customize background
    background = slide.SlideBackground
    background.Type = BackgroundType.Custom
    background.Fill.FillType = FillFormatType.Solid
    background.Fill.SolidColor.Color = Color.get_LightYellow()

# Save the modified presentation
presentation.SaveToFile("AllSlidesBackground.pptx", FileFormat.Pptx2013)
presentation.Dispose()
Pasos principales explicados:
- Carga un archivo de PowerPoint existente.
- Itera a través de todas las diapositivas.
- Establece un color sólido personalizado como fondo.
- Guarda la presentación modificada.
Leer más: Establecer color de fondo o imagen para diapositivas de PowerPoint en Python
Salida:
Por qué usar Spire.Presentation:
- Funciona en todas las plataformas (Windows, macOS, Linux).
- Permite la automatización masiva (aplicar fondos a cientos de diapositivas).
- Se puede integrar con fuentes de datos (Excel, XML, bases de datos) para la creación dinámica de diapositivas.
Tabla Comparativa: ¿Qué Método Deberías Elegir?
| Método | Nivel de Habilidad | Ideal Para | Alcance | Flexibilidad |
|---|---|---|---|---|
| Formato de Fondo | Principiante | Ediciones rápidas por diapositiva | Diapositiva única o todas | Moderada: ofrece múltiples opciones de relleno |
| Imagen de Fondo Personalizada | Principiante–Intermedio | Diseños creativos y diseños únicos | Por diapositiva | Alta: permite recortar, superponer y aplicar efectos |
| Patrón de Diapositivas | Intermedio | Diseño consistente para presentaciones o plantillas completas | Todas las diapositivas (actuales y futuras) | Alta: controla el diseño y el tema juntos |
| Macro VBA | Intermedio–Avanzado | Actualizaciones masivas dentro de PowerPoint | Todas las diapositivas o múltiples presentaciones | Media: limitada por el entorno VBA de PowerPoint |
| Python (Spire.Presentation) | Avanzado | Automatización, generación por lotes o integración con canalizaciones de datos | Múltiples diapositivas o archivos | Muy alta: control programático total |
Resumen
Cambiar el fondo de una diapositiva de PowerPoint puede ser simple o altamente automatizado, dependiendo de tus necesidades. Para los usuarios cotidianos, el Formato de Fondo de PowerPoint, las imágenes personalizadas y el Patrón de Diapositivas ofrecen opciones flexibles tanto para diapositivas individuales como para presentaciones completas. Para usuarios avanzados o desarrolladores, la automatización a través de VBA o Python (Spire.Presentation) facilita la aplicación de fondos mediante programación, ahorrando tiempo y garantizando la coherencia en presentaciones grandes o múltiples.
Al comprender estos métodos, puedes elegir el enfoque adecuado para tu flujo de trabajo, ya sea un ajuste manual rápido para una diapositiva, una plantilla corporativa de marca o actualizaciones de fondo totalmente automatizadas para cientos de diapositivas.
Preguntas Frecuentes Sobre Cómo Cambiar el Fondo de las Diapositivas
P1. ¿Cómo puedo restablecer el fondo de una diapositiva?
Usa Formato de Fondo → Restablecer Fondo para revertir la diapositiva al estilo predeterminado del tema.
P2. ¿Puedo aplicar diferentes fondos a diferentes diapositivas?
Sí, ya sea manualmente a través de Formato de Fondo o creando múltiples diseños en el Patrón de Diapositivas.
P3. ¿Qué resolución de imagen es mejor para los fondos de las diapositivas?
Usa al menos 1920 × 1080 píxeles para diapositivas Full HD. Se recomienda una resolución más alta para pantallas grandes o proyectores.
P4. ¿Puedo usar Python para aplicar fondos de degradado o de imagen?
Sí, Spire.Presentation para Python admite colores sólidos, degradados y rellenos de imagen mediante programación.
P5. ¿Es VBA más seguro que Python para la automatización?
VBA se ejecuta dentro de PowerPoint y es más fácil para los no desarrolladores, pero solo funciona en Windows. Python es multiplataforma y más flexible para la automatización a gran escala.
Ver También
Wie man PowerPoint-Folienhintergründe ändert – 5 Methoden
Inhaltsverzeichnis
- Methode 1. Hintergrund ändern mit „Hintergrund formatieren“
- Methode 2. Ein benutzerdefiniertes Hintergrundbild verwenden
- Methode 3. Hintergrund über den Folienmaster auf alle Folien anwenden
- Methode 4. Hintergrund mit einem VBA-Makro ändern
- Methode 5. Hintergrund programmgesteuert mit Python ändern
- Vergleichstabelle: Welche Methode sollten Sie wählen?
- Zusammenfassung
- FAQs zum Ändern des Folienhintergrunds
PowerPoint wird häufig verwendet, um Ideen, Berichte und Marketinginhalte zu präsentieren. Der Hintergrund einer Folie ist mehr als nur Dekoration – er gibt den Ton an, verbessert die Lesbarkeit und stärkt das Branding. Die Wahl des richtigen Hintergrunds kann jede Präsentation professioneller und optisch ansprechender machen.
Folienhintergründe können manuell mit integrierten Werkzeugen wie Volltonfarben, Farbverläufen, Mustern oder Bildern angepasst werden. Für fortgeschrittene Benutzer hilft die Automatisierung mit VBA oder Python (Spire.Presentation), Zeit bei mehreren Folien oder Präsentationen zu sparen. Dieser Artikel behandelt fünf praktische Methoden zum Ändern von Folienhintergründen, von manuellen Bearbeitungen bis hin zu programmgesteuerten Lösungen.
Methodenübersicht
- Methode 1. Hintergrund ändern mit „Hintergrund formatieren“
- Methode 2. Ein benutzerdefiniertes Hintergrundbild verwenden
- Methode 3. Hintergrund über den Folienmaster auf alle Folien anwenden
- Methode 4. Hintergrund mit einem VBA-Makro ändern
- Methode 5. Hintergrund programmgesteuert mit Python ändern
Methode 1. Hintergrund ändern mit „Hintergrund formatieren“
Eine der einfachsten Möglichkeiten, den Hintergrund einer Folie zu ändern, ist die Funktion Hintergrund formatieren von PowerPoint. Sie bietet mehrere Fülloptionen – Einfarbige Füllung, Farbverlauf, Bild- oder Texturfüllung und Musterfüllung – alle über einen einzigen Bereich zugänglich.
So wird's gemacht:
- Öffnen Sie Ihre PowerPoint-Präsentation.
- Wählen Sie die Folie aus, die Sie ändern möchten.
- Gehen Sie zur Registerkarte Entwurf im Menüband.
- Klicken Sie ganz rechts auf Hintergrund formatieren.
- Wählen Sie Ihre bevorzugte Füllart:
- Einfarbige Füllung: Wählen Sie eine einzelne Farbe für ein sauberes und professionelles Aussehen.
- Farbverlauf: Mischen Sie zwei oder mehr Farben sanft für einen dynamischen Effekt.
- Bild- oder Texturfüllung: Wenden Sie ein Bild oder eine der integrierten Texturen von PowerPoint an.
- Musterfüllung: Verwenden Sie wiederholende Designs wie Streifen oder Punkte für dezente Hintergründe.
- Klicken Sie auf Für alle übernehmen, um denselben Hintergrund auf jeder Folie zu verwenden, oder lassen Sie das Kontrollkästchen deaktiviert, um ihn nur auf die aktuelle Folie anzuwenden.
Tipps:
- Wählen Sie Farben, die gut mit Ihrem Text und Ihren visuellen Elementen kontrastieren. Verwenden Sie für eine gute Lesbarkeit helle Hintergründe mit dunklem Text oder umgekehrt.
- Verwenden Sie den Format übertragen-Pinsel, um einen Hintergrundstil schnell von einer Folie auf eine andere zu kopieren.
Wann man es benutzt:
Diese Methode ist ideal für die meisten Benutzer, die ohne großen Aufwand einen konsistenten, professionellen Hintergrund wünschen. Sie ist schnell, intuitiv und lässt sich nahtlos in die integrierten Designs von PowerPoint integrieren.
Methode 2. Ein benutzerdefiniertes Hintergrundbild verwenden
Obwohl „Hintergrund formatieren“ Bildfüllungen unterstützt, gibt Ihnen das manuelle Einfügen eines Bildes zusätzliche kreative Kontrolle. Verwenden Sie diesen Ansatz, wenn Sie visuelle Elemente positionieren, zuschneiden, überlagern oder die Folie teilweise damit bedecken müssen – zum Beispiel, um ein Heldenbild zu platzieren, ein Foto hinter Text zu versetzen oder mehrere Bilder und Formen zu komponieren.
Kurzanleitung:
- Gehen Sie zu Einfügen → Bilder → Dieses Gerät (oder Online-Quelle).
- Wählen Sie Ihr Bild aus und fügen Sie es ein.
- Passen Sie die Größe an oder schneiden Sie es zu, damit es zu Ihrem Design passt.
- Klicken Sie mit der rechten Maustaste auf das Bild → In den Hintergrund, damit Text und Objekte darüber erscheinen.
- Passen Sie bei Bedarf die Transparenz an, um zu verhindern, dass der Hintergrund den Folieninhalt überdeckt.
Tipps:
- Verwenden Sie diese Methode für herausragende Folien, wie Titelseiten oder Übergänge, bei denen Sie ein unverwechselbares Bild wünschen, das sich vom Rest des Decks abhebt.
- Halten Sie die Dateigrößen klein – komprimieren Sie große Bilder, um ein langsames Laden der Präsentation zu verhindern.
Wann man es benutzt:
Wählen Sie diesen Ansatz, wenn Sie eine präzise Platzierung, eine einzigartige Komposition oder überlagerte visuelle Effekte benötigen, die über das hinausgehen, was „Hintergrund formatieren“ bietet.
Methode 3. Hintergrund über den Folienmaster auf alle Folien anwenden
Wenn Sie einen Hintergrund konsistent auf jede Folie anwenden möchten – einschließlich zukünftiger, die Sie hinzufügen werden – ist der Folienmaster die beste Lösung. Diese Methode stellt sicher, dass Ihre Präsentation ein einheitliches Branding beibehält und spart Zeit bei der Bearbeitung großer Decks.
Schritt für Schritt:
- Gehen Sie zu Ansicht → Folienmaster .
- Wählen Sie die oberste Masterfolie im linken Bereich aus.
- Klicken Sie auf Hintergrundformate → Hintergrund formatieren und wählen Sie Ihren gewünschten Hintergrund (Farbe, Farbverlauf, Bild oder Muster).
- Schließen Sie die Folienmaster-Ansicht, um zum normalen Folieneditor zurückzukehren.
Tipps:
- Erstellen Sie mehrere Folienmaster-Layouts, jedes mit einem anderen Hintergrund, um Präsentationsabschnitte visuell zu trennen.
- Sperren Sie Schlüsselelemente (Logos, Hintergrundformen) im Master, um versehentliche Bearbeitungen zu verhindern.
Wann man es benutzt:
Verwenden Sie den Folienmaster beim Erstellen von Vorlagen, Unternehmenspräsentationen oder Schulungsdecks, die einen konsistenten Hintergrund über alle Folien und Layouts hinweg erfordern.
Methode 4. Hintergrund mit einem VBA-Makro ändern
Für Power-User, die mit Skripting vertraut sind, bietet VBA (Visual Basic for Applications) eine Möglichkeit, Hintergrundänderungen direkt in PowerPoint zu automatisieren. Dies ist nützlich, wenn Sie mehrere Folien oder Präsentationen schnell mit denselben Einstellungen aktualisieren müssen.
Beispiel-VBA-Skript:
Sub SetSlideBackgroundColor()
    Dim sld As Slide
    For Each sld In ActivePresentation.Slides
        sld.FollowMasterBackground = False
        sld.Background.Fill.ForeColor.RGB = RGB(100, 149, 237) 'Sky blue
    Next sld
End Sub
So wird's gemacht:
- Drücken Sie Alt + F11, um den VBA-Editor in PowerPoint zu öffnen.
- Klicken Sie mit der rechten Maustaste auf den Projektnamen und wählen Sie Einfügen → Modul .
- Kopieren Sie den bereitgestellten VBA-Code und fügen Sie ihn in das Modul ein.
- Drücken Sie F5, um das Makro auszuführen, das den Hintergrund aller Folien ändert.
Wann man es benutzt:
VBA eignet sich am besten für Benutzer, die bereits in PowerPoint arbeiten und eine schnelle, wiederholbare Automatisierung benötigen – zum Beispiel für die Aktualisierung von Unternehmensvorlagen oder für Massenformatierungsaufgaben.
Methode 5. Hintergrund programmgesteuert mit Python ändern
Für Entwickler oder Analysten, die Präsentationen dynamisch erstellen möchten, bietet Spire.Presentation for Python eine leistungsstarke Möglichkeit, PowerPoint-Dateien zu bearbeiten, einschließlich des Änderns von Folienhintergründen, ohne PowerPoint zu öffnen.
Installation:
pip install spire.presentation
Hier ist ein Beispiel, wie man mit Spire.Presentation for Python eine einfarbige Hintergrundfarbe auf alle Folien anwendet:
from spire.presentation import *

# Create a Presentation object
presentation = Presentation()
# Load the PowerPoint file
presentation.LoadFromFile("Input.pptx")

# Loop through all slides
for slide in presentation.Slides:
    # Access and customize background
    background = slide.SlideBackground
    background.Type = BackgroundType.Custom
    background.Fill.FillType = FillFormatType.Solid
    background.Fill.SolidColor.Color = Color.get_LightYellow()

# Save the modified presentation
presentation.SaveToFile("AllSlidesBackground.pptx", FileFormat.Pptx2013)
presentation.Dispose()
Kernschritte erklärt:
- Lädt eine vorhandene PowerPoint-Datei.
- Durchläuft alle Folien.
- Legt eine benutzerdefinierte Volltonfarbe als Hintergrund fest.
- Speichert die geänderte Präsentation.
Weiterlesen: Hintergrundfarbe oder -bild für PowerPoint-Folien in Python festlegen
Ausgabe:
Warum Spire.Presentation verwenden:
- Funktioniert plattformübergreifend (Windows, macOS, Linux).
- Ermöglicht die Massenautomatisierung (Anwenden von Hintergründen auf Hunderte von Folien).
- Kann zur dynamischen Folienerstellung in Datenquellen (Excel, XML, Datenbanken) integriert werden.
Vergleichstabelle: Welche Methode sollten Sie wählen?
| Methode | Fähigkeitslevel | Am besten für | Umfang | Flexibilität |
|---|---|---|---|---|
| Hintergrund formatieren | Anfänger | Schnelle Bearbeitungen pro Folie | Einzelne oder alle Folien | Mittel – bietet mehrere Fülloptionen |
| Benutzerdefiniertes Hintergrundbild | Anfänger–Mittel | Kreative Designs und einzigartige Layouts | Pro Folie | Hoch – ermöglicht Zuschneiden, Überlagern und Effekte |
| Folienmaster | Mittel | Konsistentes Design für ganze Decks oder Vorlagen | Alle Folien (aktuell & zukünftig) | Hoch – steuert Layout und Thema zusammen |
| VBA-Makro | Mittel–Fortgeschritten | Massenaktualisierungen in PowerPoint | Alle Folien oder mehrere Präsentationen | Mittel – durch die VBA-Umgebung von PowerPoint eingeschränkt |
| Python (Spire.Presentation) | Fortgeschritten | Automatisierung, Stapelverarbeitung oder Integration mit Datenpipelines | Mehrere Folien oder Dateien | Sehr hoch – volle programmgesteuerte Kontrolle |
Zusammenfassung
Das Ändern des Hintergrunds einer PowerPoint-Folie kann einfach oder hochautomatisiert sein, je nach Ihren Bedürfnissen. Für alltägliche Benutzer bieten die Optionen Hintergrund formatieren, benutzerdefinierte Bilder und der Folienmaster von PowerPoint flexible Möglichkeiten für sowohl einzelne Folien als auch ganze Präsentationen. Für fortgeschrittene Benutzer oder Entwickler erleichtert die Automatisierung über VBA oder Python (Spire.Presentation) das programmgesteuerte Anwenden von Hintergründen, was Zeit spart und die Konsistenz über große oder mehrere Präsentationen hinweg sicherstellt.
Indem Sie diese Methoden verstehen, können Sie den richtigen Ansatz für Ihren Arbeitsablauf wählen – sei es eine schnelle manuelle Anpassung für eine Folie, eine gebrandete Unternehmensvorlage oder vollständig automatisierte Hintergrundaktualisierungen für Hunderte von Folien.
FAQs zum Ändern des Folienhintergrunds
F1. Wie kann ich den Hintergrund einer Folie zurücksetzen?
Verwenden Sie „Hintergrund formatieren“ → „Hintergrund zurücksetzen“, um die Folie auf den Standardstil des Designs zurückzusetzen.
F2. Kann ich verschiedene Hintergründe auf verschiedene Folien anwenden?
Ja, entweder manuell über „Hintergrund formatieren“ oder durch Erstellen mehrerer Layouts im Folienmaster.
F3. Welche Bildauflösung ist am besten für Folienhintergründe geeignet?
Verwenden Sie mindestens 1920×1080 Pixel für Full-HD-Folien. Eine höhere Auflösung wird für große Bildschirme oder Projektoren empfohlen.
F4. Kann ich Python verwenden, um Farbverlaufs- oder Bildhintergründe anzuwenden?
Ja, Spire.Presentation for Python unterstützt einfarbige Farben, Farbverläufe und Bildfüllungen programmgesteuert.
F5. Ist VBA sicherer als Python für die Automatisierung?
VBA läuft innerhalb von PowerPoint und ist für Nicht-Entwickler einfacher, funktioniert aber nur unter Windows. Python ist plattformübergreifend und flexibler für die groß angelegte Automatisierung.
Siehe auch
Как изменить фон слайдов PowerPoint — 5 способов
Содержание
- Способ 1. Изменение фона с помощью «Формата фона»
- Способ 2. Использование пользовательского фонового изображения
- Способ 3. Применение фона ко всем слайдам через «Образец слайдов»
- Способ 4. Изменение фона с помощью макроса VBA
- Способ 5. Программное изменение фона с помощью Python
- Сравнительная таблица: какой метод выбрать?
- Итог
- Часто задаваемые вопросы об изменении фона слайдов
PowerPoint широко используется для представления идей, отчетов и маркетингового контента. Фон слайда не просто украшает — он задает тон, улучшает читаемость и укрепляет брендинг. Правильно подобранный фон может сделать любую презентацию более профессиональной и визуально привлекательной.
Фоны слайдов можно настраивать вручную с помощью встроенных инструментов, таких как сплошные цвета, градиенты, узоры или изображения. Для продвинутых пользователей автоматизация с помощью VBA или Python (Spire.Presentation) помогает сэкономить время при работе с несколькими слайдами или презентациями. В этой статье рассматриваются пять практических методов изменения фона слайдов, от ручного редактирования до программных решений.
Обзор методов
- Способ 1. Изменение фона с помощью «Формата фона»
- Способ 2. Использование пользовательского фонового изображения
- Способ 3. Применение фона ко всем слайдам через «Образец слайдов»
- Способ 4. Изменение фона с помощью макроса VBA
- Способ 5. Программное изменение фона с помощью Python
Способ 1. Изменение фона с помощью «Формата фона»
Один из самых простых способов изменить фон слайда — это функция PowerPoint «Формат фона». Она предлагает несколько вариантов заливки — сплошная, градиентная, рисунок или текстура, и узор — все они доступны из одной панели.
Как это сделать:
- Откройте вашу презентацию PowerPoint.
- Выберите слайд, который хотите изменить.
- Перейдите на вкладку «Дизайн» на ленте.
- Нажмите «Формат фона» справа.
- Выберите предпочитаемый тип заливки:
- Сплошная заливка: выберите один цвет для чистого и профессионального вида.
- Градиентная заливка: плавно смешайте два или более цветов для динамичного эффекта.
- Заливка рисунком или текстурой: примените изображение или одну из встроенных текстур PowerPoint.
- Узорная заливка: используйте повторяющиеся узоры, такие как полосы или точки, для создания утонченных фонов.
- Нажмите «Применить ко всем», чтобы использовать тот же фон на каждом слайде, или оставьте флажок снятым, чтобы применить только к текущему слайду.
Советы:
- Выбирайте цвета, которые хорошо контрастируют с вашим текстом и визуальными элементами. Для лучшей читаемости используйте светлые фоны с темным текстом или наоборот.
- Используйте «Формат по образцу», чтобы быстро скопировать стиль фона с одного слайда на другой.
Когда использовать:
Этот метод идеально подходит для большинства пользователей, которые хотят получить единообразный, профессиональный фон без лишних усилий. Он быстрый, интуитивно понятный и легко интегрируется со встроенными темами PowerPoint.
Способ 2. Использование пользовательского фонового изображения
Хотя «Формат фона» поддерживает заливку изображением, ручная вставка изображения дает вам дополнительный творческий контроль. Используйте этот подход, когда вам нужно расположить, обрезать, наслоить или частично покрыть слайд визуальными элементами — например, разместить главное изображение, сместить фотографию за текстом или составить композицию из нескольких изображений и фигур.
Краткое руководство:
- Перейдите в Вставка → Изображения → Это устройство (или онлайн-источник).
- Выберите и вставьте ваше изображение.
- Измените размер или обрежьте его, чтобы оно соответствовало вашему дизайну.
- Щелкните правой кнопкой мыши по изображению → На задний план, чтобы текст и объекты отображались поверх него.
- При необходимости отрегулируйте прозрачность, чтобы фон не перекрывал содержимое слайда.
Советы:
- Используйте этот метод для выделяющихся слайдов, таких как титульные страницы или переходы, где вы хотите использовать отдельное изображение, отличное от остальной части презентации.
- Сохраняйте небольшие размеры файлов — сжимайте большие изображения, чтобы предотвратить медленную загрузку презентации.
Когда использовать:
Выбирайте этот подход, когда вам требуется точное размещение, уникальная композиция или многослойные визуальные эффекты, выходящие за рамки возможностей «Формата фона».
Способ 3. Применение фона ко всем слайдам через «Образец слайдов»
Если вы хотите применить фон единообразно ко всем слайдам — включая те, которые вы добавите в будущем — лучшим решением является «Образец слайдов». Этот метод гарантирует, что ваша презентация будет поддерживать единый брендинг и сэкономит время при редактировании больших колод.
Пошаговая инструкция:
- Перейдите в Вид → Образец слайдов.
- Выберите самый верхний образец слайда в левой панели.
- Нажмите Стили фона → Формат фона и выберите желаемый фон (цвет, градиент, изображение или узор).
- Закройте режим «Образец слайдов», чтобы вернуться к обычному редактору слайдов.
Советы:
- Создайте несколько макетов «Образца слайдов», каждый с разным фоном, чтобы визуально разделить разделы презентации.
- Заблокируйте ключевые элементы (логотипы, фоновые фигуры) в образце, чтобы предотвратить случайные изменения.
Когда использовать:
Используйте «Образец слайдов» при создании шаблонов, корпоративных презентаций или учебных материалов, которые требуют единообразного фона на всех слайдах и макетах.
Способ 4. Изменение фона с помощью макроса VBA
Для опытных пользователей, знакомых со скриптами, VBA (Visual Basic for Applications) предоставляет способ автоматизировать изменение фона непосредственно в PowerPoint. Это полезно, когда вам нужно быстро обновить несколько слайдов или презентаций с одинаковыми настройками.
Пример скрипта VBA:
Sub SetSlideBackgroundColor()
    Dim sld As Slide
    For Each sld In ActivePresentation.Slides
        sld.FollowMasterBackground = False
        sld.Background.Fill.ForeColor.RGB = RGB(100, 149, 237) 'Sky blue
    Next sld
End Sub
Как это сделать:
- Нажмите Alt + F11, чтобы открыть редактор VBA в PowerPoint.
- Щелкните правой кнопкой мыши по имени проекта и выберите Insert → Module.
- Скопируйте и вставьте предоставленный код VBA в модуль.
- Нажмите F5, чтобы выполнить макрос, который изменит фон всех слайдов.
Когда использовать:
VBA лучше всего подходит для пользователей, которые уже работают в PowerPoint и нуждаются в быстрой, повторяемой автоматизации — например, для обновления корпоративных шаблонов или массовых задач форматирования.
Способ 5. Программное изменение фона с помощью Python
Для разработчиков или аналитиков, которые хотят динамически создавать презентации, Spire.Presentation for Python предоставляет мощный способ манипулирования файлами PowerPoint, включая изменение фона слайдов, без открытия PowerPoint.
Установка:
pip install spire.presentation
Вот пример того, как применить сплошной цвет фона ко всем слайдам, используя Spire.Presentation for Python:
from spire.presentation import *

# Create a Presentation object
presentation = Presentation()
# Load the PowerPoint file
presentation.LoadFromFile("Input.pptx")

# Loop through all slides
for slide in presentation.Slides:
    # Access and customize background
    background = slide.SlideBackground
    background.Type = BackgroundType.Custom
    background.Fill.FillType = FillFormatType.Solid
    background.Fill.SolidColor.Color = Color.get_LightYellow()

# Save the modified presentation
presentation.SaveToFile("AllSlidesBackground.pptx", FileFormat.Pptx2013)
presentation.Dispose()
Объяснение основных шагов:
- Загружает существующий файл PowerPoint.
- Проходит по всем слайдам.
- Устанавливает пользовательский сплошной цвет в качестве фона.
- Сохраняет измененную презентацию.
Читать далее: Установка цвета фона или изображения для слайдов PowerPoint на Python
Результат:
Зачем использовать Spire.Presentation:
- Работает на разных платформах (Windows, macOS, Linux).
- Позволяет массовую автоматизацию (применение фонов к сотням слайдов).
- Может интегрироваться с источниками данных (Excel, XML, базы данных) для динамического создания слайдов.
Сравнительная таблица: какой метод выбрать?
| Метод | Уровень навыков | Лучше всего подходит для | Область применения | Гибкость |
|---|---|---|---|---|
| Формат фона | Начинающий | Быстрые правки для каждого слайда | Один или все слайды | Умеренная – предлагает несколько вариантов заливки |
| Пользовательское фоновое изображение | Начинающий–Средний | Креативные дизайны и уникальные макеты | Для каждого слайда | Высокая – позволяет обрезать, накладывать слои и применять эффекты |
| Образец слайдов | Средний | Единообразный дизайн для всей презентации или шаблонов | Все слайды (текущие и будущие) | Высокая – управляет макетом и темой вместе |
| Макрос VBA | Средний–Продвинутый | Массовые обновления в PowerPoint | Все слайды или несколько презентаций | Средняя – ограничена средой VBA в PowerPoint |
| Python (Spire.Presentation) | Продвинутый | Автоматизация, пакетная генерация или интеграция с конвейерами данных | Несколько слайдов или файлов | Очень высокая – полный программный контроль |
Итог
Изменение фона слайда PowerPoint может быть как простым, так и высокоавтоматизированным, в зависимости от ваших потребностей. Для обычных пользователей встроенные инструменты PowerPoint, такие как «Формат фона», пользовательские изображения и «Образец слайдов», предоставляют гибкие возможности как для отдельных слайдов, так и для целых презентаций. Для продвинутых пользователей или разработчиков автоматизация с помощью VBA или Python (Spire.Presentation) позволяет легко применять фоны программно, экономя время и обеспечивая единообразие в больших или нескольких презентациях.
Понимая эти методы, вы можете выбрать правильный подход для вашего рабочего процесса — будь то быстрая ручная настройка одного слайда, фирменный корпоративный шаблон или полностью автоматизированное обновление фонов для сотен слайдов.
Часто задаваемые вопросы об изменении фона слайдов
В1. Как сбросить фон слайда?
Используйте «Формат фона» → «Сбросить фон», чтобы вернуть слайд к стилю темы по умолчанию.
В2. Можно ли применять разные фоны к разным слайдам?
Да, либо вручную через «Формат фона», либо создав несколько макетов в «Образце слайдов».
В3. Какое разрешение изображения лучше всего подходит для фонов слайдов?
Используйте разрешение не менее 1920×1080 пикселей для слайдов Full HD. Для больших экранов или проекторов рекомендуется более высокое разрешение.
В4. Могу ли я использовать Python для применения градиентных или графических фонов?
Да, Spire.Presentation for Python поддерживает программное применение сплошных цветов, градиентов и заливок изображениями.
В5. Безопаснее ли VBA, чем Python для автоматизации?
VBA работает внутри PowerPoint и проще для не-разработчиков, но работает только на Windows. Python является кроссплатформенным и более гибким для крупномасштабной автоматизации.
Смотрите также
Convertire RTF in Word: 3 metodi semplici (Online, Word, Python)

La conversione da RTF a Word è essenziale per migliorare la compatibilità con i moderni elaboratori di testi e sbloccare le opzioni di formattazione avanzate di Word. Mentre i file RTF sono comunemente usati per la formattazione di base del testo, i documenti di Word offrono funzionalità aggiuntive come modelli, strumenti di formattazione migliori e progettazione di documenti professionali. In questa guida, ti mostreremo tre semplici metodi per convertire RTF in Word: utilizzando Microsoft Word, strumenti online gratuiti e l'automazione Python, adatti sia ai principianti che agli utenti avanzati.
Cosa imparerai
- Perché convertire RTF in Word?
- Come convertire RTF in Word?
- Migliori pratiche e suggerimenti per evitare problemi di formattazione durante la conversione di RTF in Word
Perché convertire RTF in Word?
La conversione da RTF a Word può migliorare il tuo flusso di lavoro rendendo il documento più facile da gestire e modificare. Di seguito sono riportati alcuni motivi principali per cui potresti voler convertire un file RTF in un documento di Word:
- Formattazione e stile migliorati: Word offre strumenti di formattazione più sofisticati, inclusi stili di testo avanzati, intestazioni, piè di pagina, numeri di pagina e sommari, che non sono completamente supportati in RTF.
- Collaborazione: I documenti di Word sono più comunemente usati in ambienti collaborativi in cui più persone modificano il documento contemporaneamente.
- Sicurezza e compatibilità: I file di Word sono compatibili con una varietà di applicazioni e piattaforme e offrono opzioni più robuste per la protezione e la crittografia dei documenti.
- Funzionalità avanzate: I file di Word ti consentono di aggiungere funzionalità come commenti, tenere traccia delle modifiche e altro, il che semplifica la gestione dei documenti.
Come convertire RTF in Word?
Ora che conosciamo i motivi per convertire RTF in Word, vediamo come farlo. Esploreremo tre metodi: utilizzando Microsoft Word, strumenti online gratuiti e l'automazione Python.
Converti RTF in Word usando Microsoft Word
Microsoft Word è uno degli strumenti più utilizzati per lavorare con i documenti di Word. Fornisce inoltre un modo semplice e affidabile per aprire e salvare file RTF come documenti di Word.
Passaggi per convertire RTF in Word utilizzando Microsoft Word:
-
Apri Microsoft Word: Avvia Microsoft Word sul tuo computer.
-
Apri il file RTF: Vai su File > Apri, quindi seleziona il file RTF che desideri convertire. Word aprirà automaticamente il file RTF.
-
Salva come documento Word: Una volta aperto il file RTF, vai su File > Salva con nome. Dal menu a discesa Salva come, seleziona Documento di Word (*.docx) o Documento di Word 97-2003 (*.doc).

-
Scegli una posizione di salvataggio: Seleziona la posizione in cui desideri salvare il documento di Word e fai clic su Salva. Il tuo file RTF è ora convertito in un documento di Word.
Vantaggi:
- Veloce e semplice: Il processo è veloce e facile.
- Pieno controllo sulla formattazione: Puoi regolare manualmente l'aspetto del documento secondo necessità.
- Nessuno strumento di terze parti necessario: Utilizza Microsoft Word, che è uno strumento ampiamente utilizzato.
Svantaggi:
- Non ideale per conversioni batch: La conversione manuale non è efficiente per più file.
- Richiede Microsoft Word: Devi avere Microsoft Word installato sul tuo sistema.
Converti RTF in Word usando strumenti online gratuiti
Se non hai Microsoft Word o preferisci una soluzione rapida e senza software, strumenti online come Zamzar e convertio sono un'ottima scelta. Carica semplicemente il tuo file RTF, seleziona il formato Word e scarica il tuo documento convertito. Questo approccio è veloce, gratuito e accessibile da qualsiasi dispositivo con una connessione Internet.
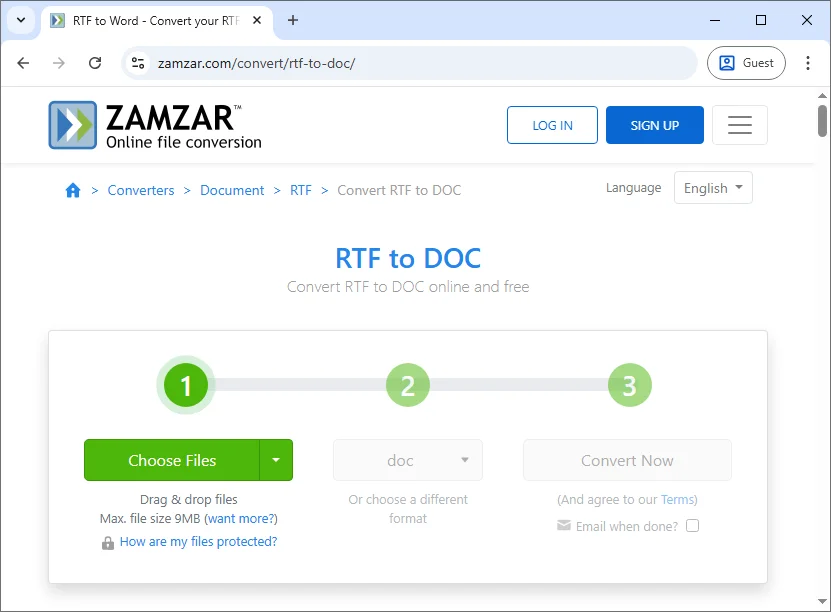
Passaggi per convertire RTF in Word online gratuitamente (usando Zamzar come esempio):
- Vai su Zamzar: Visita il convertitore online gratuito da RTF a Word di Zamzar.
- Carica il tuo file RTF: Fai clic sul pulsante Scegli file per caricare il tuo file RTF dal tuo computer o trascina e rilascia il file nell'area designata.
- Seleziona formato di output: Scegli doc o docx come formato di output.
- Converti il file: Fai clic sul pulsante Converti ora. Lo strumento elaborerà il file e genererà il documento Word convertito.
- Scarica il file Word: Una volta completata la conversione, scarica il documento Word convertito.
Vantaggi:
- Nessuna installazione richiesta: Accessibile da qualsiasi dispositivo con accesso a Internet.
- Gratuito e facile da usare: Ideale per conversioni rapide e una tantum.
- Supporta più formati: Molti strumenti online supportano vari tipi di file oltre a RTF in Word.
Svantaggi:
- Preoccupazioni sulla privacy: Il caricamento di file su siti Web di terze parti potrebbe esporre dati sensibili.
- Limitazioni delle dimensioni dei file: Alcuni strumenti impongono limiti alle dimensioni dei file per le conversioni gratuite.
- Dipendente dalla connessione Internet: Richiede una connessione Internet stabile per accedere e utilizzare lo strumento.
Converti in batch RTF in Word usando l'automazione Python
Per gli utenti che necessitano di convertire in batch RTF in Word frequentemente o preferiscono l'automazione for più file, Python fornisce una soluzione efficiente e scalabile. Utilizzando librerie come Spire.Doc for Python, puoi convertire facilmente file RTF in documenti Word senza la necessità di installare Microsoft Word.
Caratteristiche principali
- Crea e modifica documenti: Crea, modifica e gestisci documenti Word senza sforzo direttamente da Python.
- Converti tra formati: Converti senza problemi tra vari formati di documenti, inclusi RTF in DOCX, DOC in PDF e altro ancora.
- Conserva la struttura del documento: Mantieni l'integrità della formattazione del documento, inclusi stili di testo, tabelle, paragrafi e intestazioni.
- Opzioni di formattazione avanzate: Applica la formattazione personalizzata a testo, tabelle e paragrafi, come la regolazione di margini, stili di carattere e allineamento.
- Conversione batch: Automatizza la conversione di più file RTF in Word in un'unica operazione per un'elaborazione di massa efficiente.
Utilizzando Spire.Doc for Python, puoi automatizzare le conversioni da RTF a Word, garantendo risultati coerenti su grandi set di file eliminando l'intervento manuale.

Passaggi per convertire RTF in Word usando Python:
-
Installa la libreria Python richiesta:
Installa la libreria Spire.Doc da PyPI usando pip:
pip install spire-doc -
Aggiungi lo script Python per convertire RTF in Word:
Una volta installata la libreria, aggiungi il seguente codice per convertire un file RTF in un documento Word in Python:
from spire.doc import * # Create a Document object document = Document() # Load the RTF file document.LoadFromFile("Test.rtf") # Option 1: Save as .docx (Word 2016 format) document.SaveToFile("Test_output.docx", FileFormat.Docx2016) # Option 2: Save as .doc (Word 97-2003 format) # document.SaveToFile("Test_output.doc", FileFormat.Doc) # Close the document document.Close() -
Esegui lo script:
Lo script caricherà il file RTF in un oggetto Documento Spire.Doc e lo salverà in un documento Word DOCX o DOC.
Se desideri convertire in batch più file RTF in una cartella in documenti di Word, puoi modificare il codice come segue:
from spire.doc import *
import os

# Path to the folder containing the RTF files
input_folder = "path_to_rtf_folder"
output_folder = "path_to_output_folder"

# Loop through all files in the folder
for filename in os.listdir(input_folder):
    if filename.endswith(".rtf"):
        # Create a Document object
        document = Document()

        # Load the RTF file
        rtf_path = os.path.join(input_folder, filename)
        document.LoadFromFile(rtf_path)

        # Define the output file path (same name, but with .docx extension)
        output_path = os.path.join(output_folder, f"{os.path.splitext(filename)[0]}.docx")

        # Save as .docx (Word 2016 format)
        document.SaveToFile(output_path, FileFormat.Docx2016)

        # Optionally, save as .doc (Word 97-2003 format)
        # document.SaveToFile(output_path.replace(".docx", ".doc"), FileFormat.Doc)

        # Close the document
        document.Close()

print("Conversione completata per tutti i file RTF.")
Vantaggi:
- Ideale per l'elaborazione batch: Converti facilmente più file RTF contemporaneamente.
- Non è necessario Microsoft Word: La conversione è gestita interamente da Python, senza richiedere Microsoft Word.
- Personalizzabile: Aggiungi funzionalità come la gestione degli errori, la registrazione o la manipolazione dei documenti prima di salvare.
Svantaggi:
- Richiede conoscenza di Python: Non adatto a utenti senza esperienza di programmazione.
- Configurazione richiesta: È necessario installare Python, la libreria necessaria e gestire l'ambiente.
Per maggiori dettagli, consulta la guida completa ufficiale: Python: Converti Word in RTF e viceversa.
Migliori pratiche e suggerimenti per evitare problemi di formattazione durante la conversione di RTF in Word
Durante la conversione di file RTF in Word, seguire alcune best practice può aiutarti a garantire la qualità e l'accuratezza della conversione:
- Controlla la formattazione: Rivedi sempre il documento Word convertito per errori di formattazione. I file RTF a volte perdono la formattazione originale durante la conversione.
- Conversione batch: Se devi convertire molti file RTF, considera l'utilizzo dell'automazione Python o di strumenti di elaborazione batch per risparmiare tempo.
- Salva backup: Conserva i backup dei tuoi file RTF originali, soprattutto se stai utilizzando uno strumento online o uno script automatizzato, per prevenire la perdita di dati.
- Convalida compatibilità: Assicurati che il file Word convertito sia compatibile con la versione di Microsoft Word che stai utilizzando.
Suggerimenti per prevenire problemi di formattazione
-
Controlla immagini e tabelle: Questi elementi sono soggetti a rotture durante la conversione.
-
Usa caratteri comuni: Attieniti a caratteri web-safe come Arial o Times New Roman.
-
Usa Microsoft Word per file complessi: Il convertitore nativo di Word gestisce la formattazione complessa meglio degli strumenti online.
Conclusione
La conversione da RTF a Word è un passaggio semplice ma essenziale per migliorare la formattazione e la compatibilità dei documenti. Che tu preferisca l'affidabilità di Microsoft Word, la comodità degli strumenti online per conversioni rapide o l'efficienza dell'automazione Python per attività di massa, c'è una soluzione per ogni esigenza.
Seleziona il metodo che meglio si adatta alle tue esigenze e inizia a trasformare i tuoi file RTF in documenti Word professionali oggi stesso!
Domande frequenti: conversione da RTF a Word
D1: Posso convertire RTF in Word senza Microsoft Word?
R1: Sì, gli strumenti online e le librerie Python ti consentono di convertire RTF in Word senza che sia installato Microsoft Word.
D2: La conversione da RTF a Word influisce sulla formattazione del documento?
R2: A volte, la conversione da RTF a Word può causare problemi di formattazione minori. Controlla sempre il documento convertito e regola la formattazione secondo necessità.
D3: Posso automatizzare la conversione da RTF a Word per più file?
R3: Sì, Python e la libreria Spire.Doc for Python ti consentono di automatizzare il processo e convertire molti file RTF in Word contemporaneamente, rendendolo efficiente per le attività di conversione di massa.